Ageing and welfare reform in the Nordic Countries, 1990-2010 ...
Ageing and welfare reform in the Nordic Countries, 1990-2010 ...
Ageing and welfare reform in the Nordic Countries, 1990-2010 ...

You also want an ePaper? Increase the reach of your titles
YUMPU automatically turns print PDFs into web optimized ePapers that Google loves.
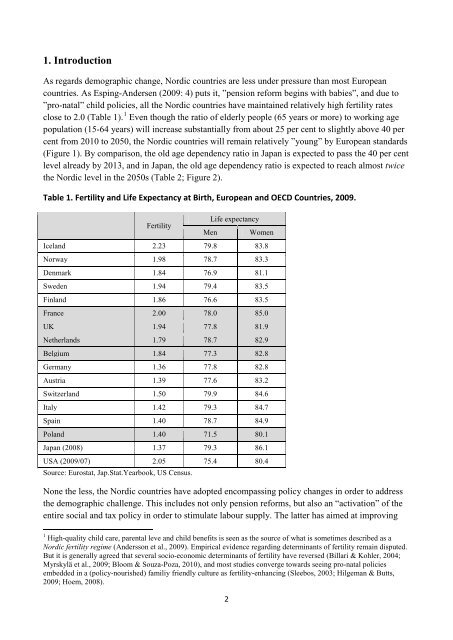
1. IntroductionAs regards demographic change, <strong>Nordic</strong> countries are less under pressure than most Europeancountries. As Esp<strong>in</strong>g-Andersen (2009: 4) puts it, ”pension <strong>reform</strong> beg<strong>in</strong>s with babies”, <strong>and</strong> due to”pro-natal” child policies, all <strong>the</strong> <strong>Nordic</strong> countries have ma<strong>in</strong>ta<strong>in</strong>ed relatively high fertility ratesclose to 2.0 (Table 1). 1 Even though <strong>the</strong> ratio of elderly people (65 years or more) to work<strong>in</strong>g agepopulation (15-64 years) will <strong>in</strong>crease substantially from about 25 per cent to slightly above 40 percent from <strong>2010</strong> to 2050, <strong>the</strong> <strong>Nordic</strong> countries will rema<strong>in</strong> relatively ”young” by European st<strong>and</strong>ards(Figure 1). By comparison, <strong>the</strong> old age dependency ratio <strong>in</strong> Japan is expected to pass <strong>the</strong> 40 per centlevel already by 2013, <strong>and</strong> <strong>in</strong> Japan, <strong>the</strong> old age dependency ratio is expected to reach almost twice<strong>the</strong> <strong>Nordic</strong> level <strong>in</strong> <strong>the</strong> 2050s (Table 2; Figure 2).Table 1. Fertility <strong>and</strong> Life Expectancy at Birth, European <strong>and</strong> OECD <strong>Countries</strong>, 2009.FertilityLife expectancyMenWomenIcel<strong>and</strong> 2.23 79.8 83.8Norway 1.98 78.7 83.3Denmark 1.84 76.9 81.1Sweden 1.94 79.4 83.5F<strong>in</strong>l<strong>and</strong> 1.86 76.6 83.5France 2.00 78.0 85.0UK 1.94 77.8 81.9Ne<strong>the</strong>rl<strong>and</strong>s 1.79 78.7 82.9Belgium 1.84 77.3 82.8Germany 1.36 77.8 82.8Austria 1.39 77.6 83.2Switzerl<strong>and</strong> 1.50 79.9 84.6Italy 1.42 79.3 84.7Spa<strong>in</strong> 1.40 78.7 84.9Pol<strong>and</strong> 1.40 71.5 80.1Japan (2008) 1.37 79.3 86.1USA (2009/07) 2.05 75.4 80.4Source: Eurostat, Jap.Stat.Yearbook, US Census.None <strong>the</strong> less, <strong>the</strong> <strong>Nordic</strong> countries have adopted encompass<strong>in</strong>g policy changes <strong>in</strong> order to address<strong>the</strong> demographic challenge. This <strong>in</strong>cludes not only pension <strong>reform</strong>s, but also an “activation” of <strong>the</strong>entire social <strong>and</strong> tax policy <strong>in</strong> order to stimulate labour supply. The latter has aimed at improv<strong>in</strong>g1 High-quality child care, parental leve <strong>and</strong> child benefits is seen as <strong>the</strong> source of what is sometimes described as a<strong>Nordic</strong> fertility regime (Andersson et al., 2009). Empirical evidence regard<strong>in</strong>g determ<strong>in</strong>ants of fertility rema<strong>in</strong> disputed.But it is generally agreed that several socio-economic determ<strong>in</strong>ants of fertility have reversed (Billari & Kohler, 2004;Myrskylä et al., 2009; Bloom & Souza-Poza, <strong>2010</strong>), <strong>and</strong> most studies converge towards see<strong>in</strong>g pro-natal policiesembedded <strong>in</strong> a (policy-nourished) familiy friendly culture as fertility-enhanc<strong>in</strong>g (Sleebos, 2003; Hilgeman & Butts,2009; Hoem, 2008).2