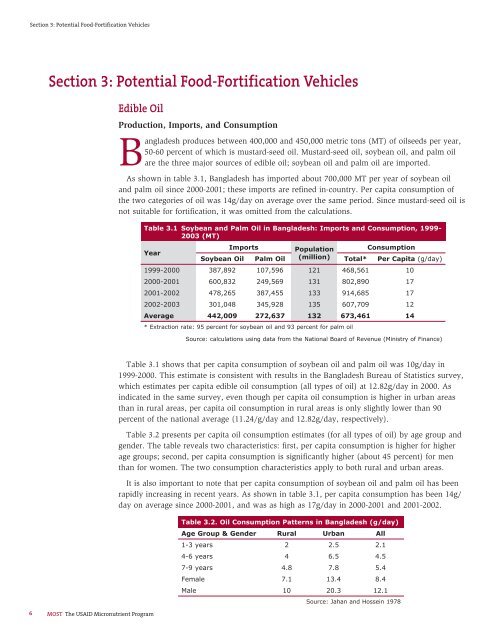
Section 3: Potential <strong>Food</strong>-<strong>Fortification</strong> VehiclesSection 3: Potential <strong>Food</strong>-<strong>Fortification</strong> VehiclesEdible OilProduction, Imports, and Consumption<strong>Bangladesh</strong> produces between 400,000 and 450,000 metric tons (MT) <strong>of</strong> oilseeds per year,50-60 percent <strong>of</strong> which is mustard-seed oil. Mustard-seed oil, soybean oil, and palm oilare the three major sources <strong>of</strong> edible oil; soybean oil and palm oil are imported.As shown in table 3.1, <strong>Bangladesh</strong> has imported about 700,000 MT per year <strong>of</strong> soybean oiland palm oil since 2000-2001; these imports are refined in-country. Per capita consumption <strong>of</strong>the two categories <strong>of</strong> oil was 14g/day on average over the same period. Since mustard-seed oil isnot suitable <strong>for</strong> <strong>for</strong>tification, it was omitted from the calculations.Table 3.1 Soybean and Palm Oil in <strong>Bangladesh</strong>: Imports and Consumption, 1999-2003 (MT)YearImportsPopulationConsumptionSoybean Oil Palm Oil (million) Total* Per Capita (g/day)1999-2000 387,892 107,596 121 468,561 102000-2001 600,832 249,569 131 802,890 172001-2002 478,265 387,455 133 914,685 172002-2003 301,048 345,928 135 607,709 12Average 442,009 272,637 132 673,461 14* Extraction rate: 95 percent <strong>for</strong> soybean oil and 93 percent <strong>for</strong> palm oilSource: calculations using data from the <strong>National</strong> Board <strong>of</strong> Revenue (Ministry <strong>of</strong> Finance)6 MOST The USAID Micronutrient <strong>Program</strong>Table 3.1 shows that per capita consumption <strong>of</strong> soybean oil and palm oil was 10g/day in1999-2000. This estimate is consistent with results in the <strong>Bangladesh</strong> Bureau <strong>of</strong> Statistics survey,which estimates per capita edible oil consumption (all types <strong>of</strong> oil) at 12.82g/day in 2000. Asindicated in the same survey, even though per capita oil consumption is higher in urban areasthan in rural areas, per capita oil consumption in rural areas is only slightly lower than 90percent <strong>of</strong> the national average (11.24/g/day and 12.82g/day, respectively).Table 3.2 presents per capita oil consumption estimates (<strong>for</strong> all types <strong>of</strong> oil) by age group andgender. The table reveals two characteristics: first, per capita consumption is higher <strong>for</strong> higherage groups; second, per capita consumption is significantly higher (about 45 percent) <strong>for</strong> menthan <strong>for</strong> women. The two consumption characteristics apply to both rural and urban areas.It is also important to note that per capita consumption <strong>of</strong> soybean oil and palm oil has beenrapidly increasing in recent years. As shown in table 3.1, per capita consumption has been 14g/day on average since 2000-2001, and was as high as 17g/day in 2000-2001 and 2001-2002.Table 3.2. Oil Consumption Patterns in <strong>Bangladesh</strong> (g/day)Age Group & Gender Rural Urban All1-3 years 2 2.5 2.14-6 years 4 6.5 4.57-9 years 4.8 7.8 5.4Female 7.1 13.4 8.4Male 10 20.3 12.1Source: Jahan and Hossein 1978
Section 3: Potential <strong>Food</strong>-<strong>Fortification</strong> Vehicles80706050403020100Soybean Oil and Palm Oil ProcessingOnly unrefined soybean oil and palm oilare imported, and imports are processed bya limited number <strong>of</strong> producers. Interviewsconducted <strong>for</strong> this study indicate that thereare about 50 oil producers in <strong>Bangladesh</strong>, <strong>of</strong>which 15 are active. Three large producers —with an individual capacity <strong>of</strong> over 500 MT/day — process 80-90 percent <strong>of</strong> all soybean-oiland palm-oil imports.Wheat Flour 1Wheat Production and ImportsWheat is cultivated mainly in thecountry’s northern and western regions,two areas less prone to flooding. During 1995-2001, domestic production averaged about 1.7million MT, while imports averaged about 1.4million MT. In the past four years, averageproduction has been about 1.4 million MT andaverage imports about 1.5 million MT. Thus,total annual wheat supply in <strong>Bangladesh</strong> hasbeen about 3 million MT per year. 2Domestic wheat production expanded at7.8 percent per year, on average, in 1987-2001, and imports declined by 1.7 percentannually during the same period. This trendwas reversed in recent years, however. Overthe past four years, average annual productiondeclined by 3 percent, while average annualimports increased by 16 percent.Average Daily Wheat Consumption, 199954%All66.6%Urban46.5%Rural38.1%Poor65.5%Non-PoorWheat imports in <strong>Bangladesh</strong> fall into threemain categories: imports by the private sector,imports by the government’s Public <strong>Food</strong>Distribution System, and imports by <strong>for</strong>eigndonors.At the start <strong>of</strong> the 1990s, <strong>for</strong>eign donationsaccounted <strong>for</strong> virtually all imports. However,since 1991-92 (date at which they werefirst permitted), private-sector (commercial)imports have increased steadily, while theproportion <strong>of</strong> <strong>for</strong>eign donations has declined.During the same period, governmentcommercial imports through the Public <strong>Food</strong>Distribution System have been negligible. Forthe past three years, the private-sector’s share<strong>of</strong> total imports has been three-quarters. Thefact that private sector imports have beensteadily increasing in the face <strong>of</strong> the declinein <strong>for</strong>eign donations suggests that the wheatsector is becoming more <strong>of</strong> a private-marketactivity in <strong>Bangladesh</strong>.Wheat-Flour ConsumptionAs a source <strong>of</strong> energy and proteinin <strong>Bangladesh</strong>, wheat ranks second inimportance after rice, although representingonly 10-15 percent <strong>of</strong> total cereal consumption(FAO 2002). Wheat consumption is moreimportant in urban areas than in rural areas.A 1999 survey <strong>of</strong> food consumption patternsindicates that overall consumption averages54g/day/person <strong>of</strong> wheat or 43g/day/person<strong>of</strong> wheat flour. Calculations using data inWFP 2004 indicate that total consumptionhas averaged about 56g/day/person <strong>of</strong> wheator 45g/day/person <strong>of</strong> wheat flour in the pastfour years. The 1999 food-consumption surveyreports an average daily per capita wheatconsumption <strong>of</strong> 66.6g in urban areas and46.5g in rural areas (equivalent to 53g and37g <strong>of</strong> wheat flour, respectively). The samesurvey reports separately <strong>for</strong> families classifiedas poor and non-poor. Daily wheat per capitaconsumption was 38.1g <strong>for</strong> the poor and65.5g <strong>for</strong> the non-poor (equivalent to 30g and52g <strong>of</strong> wheat flour, respectively). Results aresummarized in the figure to the left.1 This section on wheat flour draws on Rassas and Fitch 20022 All production and import data are calculated from FAO; WFP 2001; and WFP 2004<strong>Elements</strong> <strong>of</strong> a <strong>National</strong> <strong>Food</strong>-<strong>for</strong>tification <strong>Program</strong> <strong>for</strong> <strong>Bangladesh</strong>7


