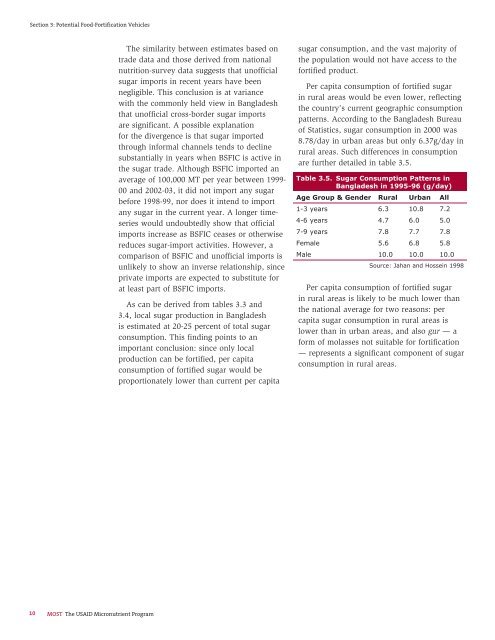
Section 3: Potential <strong>Food</strong>-<strong>Fortification</strong> VehiclesThe similarity between estimates based ontrade data and those derived from nationalnutrition-survey data suggests that un<strong>of</strong>ficialsugar imports in recent years have beennegligible. This conclusion is at variancewith the commonly held view in <strong>Bangladesh</strong>that un<strong>of</strong>ficial cross-border sugar importsare significant. A possible explanation<strong>for</strong> the divergence is that sugar importedthrough in<strong>for</strong>mal channels tends to declinesubstantially in years when BSFIC is active inthe sugar trade. Although BSFIC imported anaverage <strong>of</strong> 100,000 MT per year between 1999-00 and 2002-03, it did not import any sugarbe<strong>for</strong>e 1998-99, nor does it intend to importany sugar in the current year. A longer timeserieswould undoubtedly show that <strong>of</strong>ficialimports increase as BSFIC ceases or otherwisereduces sugar-import activities. However, acomparison <strong>of</strong> BSFIC and un<strong>of</strong>ficial imports isunlikely to show an inverse relationship, sinceprivate imports are expected to substitute <strong>for</strong>at least part <strong>of</strong> BSFIC imports.As can be derived from tables 3.3 and3.4, local sugar production in <strong>Bangladesh</strong>is estimated at 20-25 percent <strong>of</strong> total sugarconsumption. This finding points to animportant conclusion: since only localproduction can be <strong>for</strong>tified, per capitaconsumption <strong>of</strong> <strong>for</strong>tified sugar would beproportionately lower than current per capitasugar consumption, and the vast majority <strong>of</strong>the population would not have access to the<strong>for</strong>tified product.Per capita consumption <strong>of</strong> <strong>for</strong>tified sugarin rural areas would be even lower, reflectingthe country’s current geographic consumptionpatterns. According to the <strong>Bangladesh</strong> Bureau<strong>of</strong> Statistics, sugar consumption in 2000 was8.78/day in urban areas but only 6.37g/day inrural areas. Such differences in consumptionare further detailed in table 3.5.Table 3.5. Sugar Consumption Patterns in<strong>Bangladesh</strong> in 1995-96 (g/day)Age Group & Gender Rural Urban All1-3 years 6.3 10.8 7.24-6 years 4.7 6.0 5.07-9 years 7.8 7.7 7.8Female 5.6 6.8 5.8Male 10.0 10.0 10.0Source: Jahan and Hossein 1998Per capita consumption <strong>of</strong> <strong>for</strong>tified sugarin rural areas is likely to be much lower thanthe national average <strong>for</strong> two reasons: percapita sugar consumption in rural areas islower than in urban areas, and also gur — a<strong>for</strong>m <strong>of</strong> molasses not suitable <strong>for</strong> <strong>for</strong>tification— represents a significant component <strong>of</strong> sugarconsumption in rural areas.10 MOST The USAID Micronutrient <strong>Program</strong>
Section 4: Cost Analysis <strong>of</strong> <strong>Food</strong> <strong>Fortification</strong>Section 4: Cost Analysis <strong>of</strong> <strong>Food</strong> <strong>Fortification</strong>RationaleIn<strong>for</strong>mation on <strong>for</strong>tification costs can be useful to decision-makers in assessing the<strong>for</strong>tification program’s potential economic impact on consumers. Such in<strong>for</strong>mation may, <strong>for</strong>instance, be used to ascertain whether price increases associated with <strong>for</strong>tification will berelatively low and thus not affect consumers adversely. In particular, cost in<strong>for</strong>mation may beused to confirm that, while consumption <strong>of</strong> the <strong>for</strong>tified food will have positive health effects onconsumers, the price increase will not place it beyond the reach <strong>of</strong> the most vulnerable segments<strong>of</strong> the population.Cost in<strong>for</strong>mation is equally important <strong>for</strong> the private sector. Mill owners, oil refiners, andsugar producers will make more-in<strong>for</strong>med decisions when cost in<strong>for</strong>mation is readily available.Knowledge <strong>of</strong> <strong>for</strong>tification costs is all the more important under voluntary <strong>for</strong>tification becauseproducers need an advance determination that <strong>for</strong>tification can be put into operation at a priceconsumers are willing to pay. Factory owners also need in<strong>for</strong>mation on the potential adjustmentsthat may be required in terms <strong>of</strong> plant redesign, new equipment, and personnel.Results<strong>Fortification</strong> <strong>of</strong> wheat flour, oil, and (to a certain extent) sugar requires very little modification<strong>of</strong> the usual processing operations and is relatively simple and inexpensive. The main costs<strong>of</strong> <strong>for</strong>tification are those <strong>of</strong> the micronutrients. The cost <strong>of</strong> the equipment used to incorporatemicronutrients into the food vehicle will depend on the sophistication <strong>of</strong> the system adoptedand on the design and capacity <strong>of</strong> the processing plant. A limited amount <strong>of</strong> labor is required tooperate the equipment and manage the <strong>for</strong>tificant, as well as to implement the necessary qualityassuranceand quality-control procedures. There are also costs associated with testing <strong>for</strong> qualityassurance — daily within the plant and periodically by outside organizations.A summary <strong>of</strong> the unit costs <strong>of</strong> <strong>for</strong>tification appears in table 4.1, with detailed calculationsprovided as annexes to this study. The annexes estimate <strong>for</strong>tification costs in terms <strong>of</strong> totalexpenditure incurred by processors as well as per MT <strong>of</strong> <strong>for</strong>tified flour.Total <strong>for</strong>tification costsAs shown in table 4.1, total cost <strong>of</strong> <strong>for</strong>tification is estimated at about Tk223 ($3.85) per MT<strong>for</strong> oil, Tk295 ($5) per MT <strong>for</strong> wheat flour, and Tk630 ($10.8) <strong>for</strong> sugar. <strong>Fortification</strong> costs,including vitamin A, are estimated at 0.46 percent <strong>of</strong> (weighted) retail price <strong>for</strong> oil (0.43 percent<strong>for</strong> soybean oil and 0.53 percent <strong>of</strong> palm oil); 1.6 percent <strong>of</strong> the retail price <strong>for</strong> flour (maida)in plastic bags; and 2.09 percent <strong>of</strong> the retail price <strong>for</strong> sugar. Such estimates suggest that theadditional cost <strong>of</strong> <strong>for</strong>tification does not appear prohibitive to consumers, particularly in the case<strong>of</strong> oil, where the increase is particularly modest.Cost figures presented in table 4.1 do not include the 47 percent import duty currentlyimposed on micronutrients, and taking the import tax into consideration would raise the costs <strong>of</strong><strong>for</strong>tification substantially. As shown in table 4.2, incorporating such a tax into the calculationswould raise the cost <strong>of</strong> <strong>for</strong>tification to $5.62/MT <strong>for</strong> oil, $7.21/MT <strong>for</strong> wheat flour, and$16.08/MT <strong>for</strong> sugar, with a proportionate increase in retail prices <strong>for</strong> the three commodities.This conclusion suggests that it might be wise to consider eliminating the import duty onmicronutrients.<strong>Elements</strong> <strong>of</strong> a <strong>National</strong> <strong>Food</strong>-<strong>for</strong>tification <strong>Program</strong> <strong>for</strong> <strong>Bangladesh</strong>11


