Elements of a National Food- Fortification Program for Bangladesh
Elements of a National Food- Fortification Program for Bangladesh
Elements of a National Food- Fortification Program for Bangladesh

Create successful ePaper yourself
Turn your PDF publications into a flip-book with our unique Google optimized e-Paper software.
<strong>Elements</strong> <strong>of</strong> a <strong>National</strong> <strong>Food</strong>-<strong>Fortification</strong> <strong>Program</strong> <strong>for</strong> <strong>Bangladesh</strong>
This publication was made possible through support provided by the Office<strong>of</strong> Health, Infectious Disease and Nutrition, <strong>of</strong> the Bureau <strong>for</strong> Global Health,U.S. Agency <strong>for</strong> International Development (USAID).MOST is managed by the International Science and Technology Institute, Inc.(ISTI) under the terms <strong>of</strong> Cooperative Agreement No. HRN-A-00-98-0047-00.Partners are the Academy <strong>for</strong> Educational Development (AED), Helen KellerInternational (HKI), the International <strong>Food</strong> Policy Research Institute (IFPRI), andJohns Hopkins University (JHU). Resource institutions are CARE, the InternationalExecutive Service Corps (IESC), Population Services International (PSI), <strong>Program</strong> <strong>for</strong>Appropriate Technology in Health (PATH), and Save the Children.The opinions expressed in this document are those <strong>of</strong> the author(s) and do not necessarilyreflect the views <strong>of</strong> the U.S. Agency <strong>for</strong> International Development.Suggested Citation:MOST, USAID Micronutrient <strong>Program</strong>. 2004. <strong>Elements</strong> <strong>of</strong> a <strong>National</strong> <strong>Food</strong>-<strong>Fortification</strong> <strong>Program</strong> <strong>for</strong> <strong>Bangladesh</strong>. Arlington, Virginia, USA
<strong>Elements</strong> <strong>of</strong> a <strong>National</strong> <strong>Food</strong>-<strong>Fortification</strong><strong>Program</strong> <strong>for</strong> <strong>Bangladesh</strong>J u n e 2 0 0 4Omar DaryBechir Rassas
This study builds on a recent pilot wheat-flour <strong>for</strong>tificationprogram in <strong>Bangladesh</strong>. Per<strong>for</strong>med through MOST <strong>for</strong> USAID/Dhaka, the pilot program was a limited-term project to improvevitamin A and iron status and also to reduce anemia throughconsumption <strong>of</strong> <strong>for</strong>tified wheat flour with vitamin A, iron, zinc,B1, B2, niacin, and folic acid. The study’s primary objective isto identify major elements <strong>of</strong> a food-<strong>for</strong>tification strategy in<strong>Bangladesh</strong>, including micronutrient <strong>for</strong>mulation <strong>for</strong> the foodvehicles identified as suitable <strong>for</strong> <strong>for</strong>tification.
Table <strong>of</strong> Contents and AcronymsTable <strong>of</strong> ContentsTables and FiguresiiAcronymsiiiSummaryivSection 1: Introduction 1Objective 2Methodology 2Section 2: Nature <strong>of</strong> the Micronutrient Problem 3Malnutrition 3Micronutrient Deficiency 4Current Ef<strong>for</strong>ts to Reduce Micronutrient Deficiency 5<strong>Food</strong>-<strong>Fortification</strong> and Micronutrient Malnutrition 5Section 3: Potential <strong>Food</strong>-<strong>Fortification</strong> Vehicles 6Edible Oil 6Production, Imports, and Consumption 6Wheat Flour 7Wheat Production and Imports 7Wheat-Flour Consumption 7Production Technology 8Products 8Market Structure 8Sugar 9Production 9Imports and Consumption 9Section 4: Cost Analysis <strong>of</strong> <strong>Food</strong>-<strong>Fortification</strong> 11Rationale 11Results 11Section 5: <strong>Elements</strong> <strong>of</strong> a <strong>National</strong> <strong>Food</strong>-<strong>Fortification</strong> <strong>Program</strong> 14<strong>Food</strong> Vehicles and <strong>Fortification</strong> Regime 14Oil 14Wheat Flour 14Sugar 16<strong>Fortification</strong> Formulation 16Packaging and Labeling 17Oil 17Wheat Flour 17<strong>National</strong> Capacity to Implement <strong>Food</strong> <strong>Fortification</strong> 18References 19Annex A: Estimated Costs <strong>of</strong> Oil <strong>Fortification</strong> in <strong>Bangladesh</strong> 20Annex B: Estimated Costs <strong>of</strong> Wheat-Flour <strong>Fortification</strong> in <strong>Bangladesh</strong> 21Annex C: Estimated Costs <strong>of</strong> Sugar <strong>Fortification</strong> in <strong>Bangladesh</strong> 22<strong>Elements</strong> <strong>of</strong> a <strong>National</strong> <strong>Food</strong>-<strong>for</strong>tification <strong>Program</strong> <strong>for</strong> <strong>Bangladesh</strong>i
Table <strong>of</strong> Contents and AcronymsList <strong>of</strong> TablesTable 2.1. Trends in Various Indicators <strong>of</strong> Malnutrition in <strong>Bangladesh</strong> 3Table 2.2. Percent <strong>of</strong> Population Able to Meet Calorie, Protein, and FatRequirements in <strong>Bangladesh</strong> (1995-96) 4Table 2.3. Micronutrient Adequacy in <strong>Bangladesh</strong> (1995-96) 4Table 2.4. Vitamin A Deficiency in <strong>Bangladesh</strong> (percent below the reference point) 4Table 2.5. Anemia Prevalence in <strong>Bangladesh</strong> (percent) 5Table 3.1 Soybean and Palm Oil in <strong>Bangladesh</strong>:Imports and Consumption, 1999-2003 (MT) 6Table 3.2. Oil Consumption Patterns in <strong>Bangladesh</strong> (g/day) 6Table 3.4. Official Sugar Imports in <strong>Bangladesh</strong>, 1990-2003 (MT) 9Table 3.3: Sugar Production in <strong>Bangladesh</strong>, 1993-94 (MT) 9Table 3.5. Sugar Consumption Patterns in <strong>Bangladesh</strong> in 1995-96 (g/day) 10Table 4.1. <strong>Fortification</strong> Costs <strong>for</strong> Wheat Flour, Oil, and Sugar in <strong>Bangladesh</strong> 12Table 4.2. <strong>Fortification</strong> Costs <strong>for</strong> Wheat Flour, Oil, and Sugar in <strong>Bangladesh</strong>with the Current Import Duty on Micronutrients 12Table 5.1: <strong>Fortification</strong> Formulation and Micronutrient Supply<strong>for</strong> Wheat Flour (Maida) and Oil in <strong>Bangladesh</strong> 17iiMOST The USAID Micronutrient <strong>Program</strong>
Table <strong>of</strong> Contents and AcronymsAcronymsBSFICEARFAOGOBMOSTMTNFANGONPANQCVGDUSAIDWFP<strong>Bangladesh</strong> Sugar and <strong>Food</strong> Industries CorporationEstimated average requirement<strong>Food</strong> and Agriculture Organization <strong>of</strong> the United NationsGovernment <strong>of</strong> <strong>Bangladesh</strong>The USAID Micronutrient <strong>Program</strong>Metric ton<strong>National</strong> <strong>Fortification</strong> AllianceNon-Government Organization<strong>National</strong> Plan <strong>of</strong> Action <strong>for</strong> NutritionQuality controlVulnerable Group DevelopmentUnited States Agency <strong>for</strong> International DevelopmentWorld <strong>Food</strong> <strong>Program</strong>meCurrency Unit: TK58=$1<strong>Elements</strong> <strong>of</strong> a <strong>National</strong> <strong>Food</strong>-<strong>for</strong>tification <strong>Program</strong> <strong>for</strong> <strong>Bangladesh</strong>iii
SummarySummaryBackground, Objective, and MethodologyThis study was prepared under MOST, the USAID Micronutrient <strong>Program</strong>. Funded by theOffice <strong>of</strong> Health and Nutrition <strong>of</strong> the United States Agency <strong>for</strong> International Development(USAID), MOST is USAID’s flagship project <strong>for</strong> the promotion <strong>of</strong> activities to improve themicronutrient status <strong>of</strong> at-risk populations throughout the world.The study, which was conducted in April-May 2004, builds on a recent pilot wheat-flour<strong>for</strong>tification program in <strong>Bangladesh</strong>. Per<strong>for</strong>med through MOST <strong>for</strong> USAID/Dhaka, the pilotprogram was a limited-term project to improve vitamin A and iron status and also to reduceanemia through consumption <strong>of</strong> <strong>for</strong>tified wheat flour with vitamin A, iron, zinc, B1, B2, niacin,and folic acid.This study’s primary objective is to identify major elements <strong>of</strong> a food-<strong>for</strong>tification strategy in<strong>Bangladesh</strong>, including micronutrient <strong>for</strong>mulation <strong>for</strong> the food vehicles identified as suitable <strong>for</strong><strong>for</strong>tification.Data were collected from available documents with relevance to the oil, wheat, and sugarindustries, and from extensive interviews with <strong>of</strong>ficials <strong>of</strong> the Government <strong>of</strong> <strong>Bangladesh</strong> (GOB)and other key personnel in Dhaka during a two-week visit to <strong>Bangladesh</strong>.Current Ef<strong>for</strong>ts to Reduce Micronutrient Deficiency in <strong>Bangladesh</strong><strong>Bangladesh</strong> has achieved considerable progress in reducing poverty, child mortality, andmalnutrition. Despite these improvements, however, poverty remains alarmingly high, andthe overall level <strong>of</strong> child malnutrition remains one <strong>of</strong> the highest in the world. Only 32 percent<strong>of</strong> the population meet calorie requirements, 46 percent meet protein requirements, and 25percent meet fat requirements. Intake is low <strong>for</strong> most micronutrients, vitamin A indicators <strong>for</strong>children and women indicate the presence <strong>of</strong> a serious public health problem, and anemia iswidespread among all population groups.<strong>Bangladesh</strong> regards improved nutrition as a top government priority. Ongoing programsto reduce micronutrient deficiency include dietary diversification and other food-basedinterventions such as development <strong>of</strong> home gardens, poultry, fisheries, and other small farmanimals at the community level; salt iodization; and universal vitamin A supplementation <strong>for</strong>young children and lactating women.<strong>Food</strong> <strong>for</strong>tification was initiated with the implementation <strong>of</strong> a pilot wheat-flour <strong>for</strong>tificationactivity. Building on that initiative, the GOB has launched an ef<strong>for</strong>t to examine the suitability<strong>of</strong> other food-<strong>for</strong>tification vehicles. As a result <strong>of</strong> these interventions, it is expected thatfood-<strong>for</strong>tification will soon become an important element <strong>of</strong> the country’s strategy to reducemicronutrient malnutrition.ivMOST The USAID Micronutrient <strong>Program</strong>
Summary<strong>Elements</strong> <strong>of</strong> a <strong>National</strong> <strong>Food</strong>-<strong>Fortification</strong> <strong>Program</strong><strong>Food</strong> Vehicles and <strong>Fortification</strong> RegimeThis study considered three food<strong>for</strong>tificationvehicles: oil, wheat flour,and sugar. The suitability <strong>of</strong> each is brieflysummarized below.OilOil is a most suitable food-<strong>for</strong>tification vehiclein <strong>Bangladesh</strong>. Mustard-seed oil, soybean oil,and palm oil are the country’s three majorsources <strong>of</strong> edible oil. Since mustard-seed oilis not suitable <strong>for</strong> <strong>for</strong>tification, however, the<strong>for</strong>tification program should concentrate onsoybean and palm oils. Right now, per capitaconsumption <strong>of</strong> both these oils is adequateand rapidly increasing. For example, percapita consumption increased from 10g/dayin 1999-2000, to 14g/day on average between2000-2001 and 2002-2003, and was as high as17g/day in 2000-2002. Fortified at a minimumvitamin A level <strong>of</strong> 20mg/kg, consumption <strong>of</strong>13g/day/person <strong>of</strong> oil would supply morethan 50 percent <strong>of</strong> the estimated averagerequirement (EAR).At Tk 223, or $3.85 per metric ton (MT),oil has the lowest <strong>for</strong>tification cost amongthe three commodities considered — about20 percent below wheat-flour <strong>for</strong>tificationcost and well below sugar-<strong>for</strong>tification cost.In addition, total <strong>for</strong>tification costs, includingvitamin A, are estimated at 0.46 percent <strong>of</strong>retail price <strong>for</strong> oil (0.43 percent <strong>for</strong> soybean oiland 0.53 percent <strong>for</strong> palm oil) — suggestingthat oil <strong>for</strong>tification will not have anymeaningful impact on consumption.These cost estimates do not include the47 percent import duty currently imposedon micronutrients. Taking the importtax into consideration raises the costs<strong>of</strong> oil <strong>for</strong>tification to $5.62/MT, with acorresponding increase in retail prices. Thesame conclusion applies to wheat flour andoil, suggesting that elimination <strong>of</strong> the importduty on micronutrients should be considered.Soybean oil and palm oil are imported inan unrefined <strong>for</strong>m. These imports are thenprocessed by a limited number <strong>of</strong> producers.Of the 15 active oil producers in <strong>Bangladesh</strong>,3 have an individual capacity <strong>of</strong> over 1,000MT/day and process 80-90 percent <strong>of</strong> allsoybean and palm oil imports. Both the sizeand limited number <strong>of</strong> producers suggest thatmandatory <strong>for</strong>tification <strong>for</strong> oil would be themost-effective strategy.Wheat FlourWheat flour is a suitable food-<strong>for</strong>tificationvehicle in <strong>Bangladesh</strong>. The structure <strong>of</strong> themilling industry suggests that the wheat-flour<strong>for</strong>tification program should rely on rollermills rather than on chakki mills (small stonemills). It should also be private-sector drivenand voluntary.Per capita wheat-flour consumption isestimated at 43g/day. <strong>Fortification</strong> <strong>of</strong> wheatflour would supply about 20 percent <strong>of</strong> EAR<strong>for</strong> vitamin A, iron, folate, B-12, B-1, B-2, B-6,niacin, and zinc.<strong>Fortification</strong> costs <strong>for</strong> wheat flour are aboutTk295, or $5 per MT, and represent about 1.6percent <strong>of</strong> retail prices, suggesting that theadditional cost <strong>of</strong> <strong>for</strong>tification does not appearprohibitive to consumers.SugarStrong evidence presented in this studysuggests that sugar <strong>for</strong>tification in <strong>Bangladesh</strong>is not recommended. Because the bulk <strong>of</strong>sugar consumed is imported in an alreadyrefined <strong>for</strong>m, it places severe limitations onthe amount <strong>of</strong> sugar available <strong>for</strong> <strong>for</strong>tification.Local production is only about 20-25 percent<strong>of</strong> total sugar consumption, equivalent toless than 2g/day/person. Per capita sugarconsumption in rural areas, where most <strong>of</strong>the vulnerable groups can be found, is evenlower.At about Tk630, or $10.8 per MT, the cost<strong>of</strong> sugar <strong>for</strong>tification is over twice as high asthat <strong>for</strong> wheat flour and nearly three timesthat <strong>for</strong> oil. The additional cost associated<strong>Elements</strong> <strong>of</strong> a <strong>National</strong> <strong>Food</strong>-<strong>for</strong>tification <strong>Program</strong> <strong>for</strong> <strong>Bangladesh</strong>v
Summarywith <strong>for</strong>tification would increase the retailprice <strong>of</strong> sugar by over 2 percent. Assuming<strong>for</strong>tification costs are passed on to consumers,this increase may place <strong>for</strong>tified sugar ata disadvantage relative to the importedun<strong>for</strong>tified product.<strong>Fortification</strong> FormulationThe table below describes the <strong>for</strong>tification<strong>for</strong>mulation and micronutrient supply <strong>for</strong>oil and wheat flour in <strong>Bangladesh</strong>. Fortifiedat a minimum vitamin A level <strong>of</strong> 20mg/kg,oil would supply about 52 percent <strong>of</strong> EAR— an amount expected to have a significantbiological impact. Based on the <strong>for</strong>mulationdescribed in the table, <strong>for</strong>tification <strong>of</strong> maida(refined flour) would supply about 20 percent<strong>of</strong> EAR <strong>for</strong> vitamin A, iron, folate, B-12, B-1,B-2, B-6, niacin, and zinc.<strong>National</strong> Capacity to Implement<strong>Food</strong> <strong>Fortification</strong>There is fervent commitment to food<strong>for</strong>tification in <strong>Bangladesh</strong> at the highestlevel <strong>of</strong> government, and a strong publicand private-sector partnership is emerging.In December 2003, the <strong>Bangladesh</strong> <strong>Food</strong><strong>Fortification</strong> Alliance (NFA) was <strong>for</strong>med,consisting <strong>of</strong> more than 30 members fromthe public and private sectors, civil society,and international development partners. ATechnical Committee was also selected toprovide specialized support to NFA and itsmembers. NFA’s first meeting took place inApril 2004.A rapid assessment conducted <strong>for</strong> thisstudy indicates that <strong>Bangladesh</strong> has thenecessary human and institutional capacityto implement food <strong>for</strong>tification on a nationalscale. However, available evidence suggeststhat while NFA partners are interested in food<strong>for</strong>tification, they will be unable to put theprogram into action without some technicalsupport. An integrated package <strong>of</strong> keytechnical assistance interventions providedby USAID, the Global Alliance <strong>for</strong> ImprovedNutrition, and other donors would create theconditions <strong>for</strong> NFA partners to proceed.<strong>Fortification</strong> Formulation and Micronutrient Supply <strong>for</strong> Wheat Flour (Maida) and Oil in <strong>Bangladesh</strong>Nutrient Form Minimum Level <strong>of</strong>Addition (mg/kg) *Wheat FlourOverage (%) **% EAR in UsualConsumption ***Vitamin A SD250 2 50 16Iron Ferrous fumerate 45 5 20Folate Folic acid 2 50 23B-12 B-12 — 0.01% 0.010 30 18B-1 Thiamin mononitrate 6 40 18B-2 Rib<strong>of</strong>lavin 4 30 16B-6 Pyridoxin 5 20 19Niacin Niacinamide 40 10 16Zinc Zinc oxide 20 5 19OilVitamin A Vitamin A oily 1.7mIU/g 20 5 52Notes:* Selected (1) to provide at least 20 percent EAR from 50g/day/person <strong>of</strong> wheat flour consumption, (2) to be compatiblewith the sensorial properties <strong>of</strong> the product, and (3) to be safe <strong>for</strong> those who consume large amounts <strong>of</strong> the product.** The additional amount over the minimum level to compensate <strong>for</strong> losses in production, storage, and transportation.*** 40g/day <strong>for</strong> wheat flour and 13g/day <strong>for</strong> oil; values <strong>for</strong> families, adult male.viMOST The USAID Micronutrient <strong>Program</strong>
Section 1: IntroductionSection 1: IntroductionBackgroundThis study was prepared under MOST, the USAID Micronutrient <strong>Program</strong>. Funded by theOffice <strong>of</strong> Health and Nutrition <strong>of</strong> the United States Agency <strong>for</strong> International Development(USAID), MOST is USAID’s flagship project <strong>for</strong> the promotion <strong>of</strong> activities to improve themicronutrient status <strong>of</strong> at-risk populations throughout the world.The study builds on a recent pilot wheat-flour <strong>for</strong>tification program in <strong>Bangladesh</strong>. Per<strong>for</strong>medthrough MOST <strong>for</strong> USAID/Dhaka, the pilot program was a limited-term project to improvevitamin A and iron status and also to reduce anemia through consumption <strong>of</strong> <strong>for</strong>tified wheatflour with vitamin A, iron, zinc, B1, B2, niacin, and folic acid.Vitamin A and iron deficiency has led to high rates <strong>of</strong> night blindness, anemia, reducedimmune response, and other health problems in <strong>Bangladesh</strong>, particularly among children andpregnant women. In 1995, the Government <strong>of</strong> <strong>Bangladesh</strong> (GOB) implemented a universalvitamin A capsule distribution program that achieved high coverage <strong>for</strong> children 6 monthsto 5 years <strong>of</strong> age. Although the program has lowered the incidence <strong>of</strong> night blindness andother health problems associated with vitamin A deficiency, significant constraints remain. Inparticular, women are not covered, and many other important micronutrients are not beingsupplied through capsule distribution.The GOB initiated the pilot trial wheat-flour <strong>for</strong>tification program in August 1999, incollaboration with USAID/Dhaka. The purpose <strong>of</strong> the program was to examine the feasibility<strong>of</strong> reducing micronutrient deficiency through food-<strong>for</strong>tification and to verify the applicability<strong>of</strong> known <strong>for</strong>tification technologies to the local situation. <strong>Program</strong> activities were designed togenerate important in<strong>for</strong>mation on the feasibility <strong>of</strong> wheat-flour <strong>for</strong>tification on a larger scale. Toachieve this objective, several activities were undertaken:An organoleptic study to evaluate the organoleptic qualities <strong>of</strong> the <strong>for</strong>tified wheat flour andits productsAn efficacy study to assess the health impact <strong>of</strong> the <strong>for</strong>tified wheat flour on the iron andvitamin A status <strong>of</strong> the recipient populationA utilization and acceptability study to ascertain beneficiaries’ use <strong>of</strong> the wheat flourA cost analysis and sustainability study to assess cost factors and sustainabilityrequirements <strong>for</strong> a nationwide programA promotional and educational campaign to in<strong>for</strong>m recipients <strong>of</strong> the health benefits <strong>of</strong> the<strong>for</strong>tified wheat flourThe wheat-flour <strong>for</strong>tification program demonstrated that wheat-flour <strong>for</strong>tification on a nationalscale would be both feasible and desirable. Following the success <strong>of</strong> the wheat-flour <strong>for</strong>tificationexperience, the GOB requested USAID/Dhaka assistance to examine the feasibility <strong>of</strong> <strong>for</strong>tifyingother food vehicles such as edible oil and sugar. This study took place in response to thatrequest.<strong>Elements</strong> <strong>of</strong> a <strong>National</strong> <strong>Food</strong>-<strong>for</strong>tification <strong>Program</strong> <strong>for</strong> <strong>Bangladesh</strong>1
Section 1: IntroductionObjectiveThe primary objective <strong>of</strong> this study isto identify major elements <strong>of</strong> a food<strong>for</strong>tificationstrategy in <strong>Bangladesh</strong>, includingmicronutrient <strong>for</strong>mulation <strong>for</strong> the foodvehicles identified as suitable <strong>for</strong> <strong>for</strong>tification,equipment needed, and packaging andlabeling requirements.MethodologyThis study, conducted in April-May2004, collected data from availabledocuments with relevance to the oil, wheat,and sugar industries, and from extensiveinterviews with GOB <strong>of</strong>ficials and other keypersonnel in Dhaka during a two-week visitto <strong>Bangladesh</strong>. Two visits were made to oil,wheat flour, and sugar mills in the Dhaka areaand Natore. Major findings and conclusionswere presented to USAID, GOB <strong>of</strong>ficials, andmembers <strong>of</strong> the technical committee <strong>of</strong> thenewly created <strong>National</strong> <strong>Fortification</strong> Alliance(NFA).The study is divided into five sections.Following this introductory material, section2 describes the nature <strong>of</strong> the micronutrientproblem in <strong>Bangladesh</strong>. Section 3 examinesthree potential food-<strong>for</strong>tification vehicles:edible oil, wheat flour, and sugar, withcost analysis <strong>of</strong> <strong>for</strong>tification <strong>for</strong> the threecommodities presented in section 4. Majorelements <strong>of</strong> a national food-<strong>for</strong>tificationprogram are identified in the final section,which examines food vehicles and <strong>for</strong>tification<strong>for</strong>mulation, production, and packaging andlabeling requirements.2 MOST The USAID Micronutrient <strong>Program</strong>
Section 2: Nature <strong>of</strong> the Micronutrient ProblemSection 2: Nature <strong>of</strong> the Micronutrient ProblemMalnutrition<strong>Bangladesh</strong> has achieved considerable progress in reducing poverty, child mortality, andmalnutrition. Despite these improvements, however, poverty remains alarmingly high.Nearly 45 percent <strong>of</strong> the population remained below the poverty line in 2000, and 20percent lived in hardcore poverty — defined as consuming fewer than 1,800 calories per day. Inurban areas, those percentages are 52 percent and 25 percent, respectively (<strong>Bangladesh</strong> Bureau<strong>of</strong> Statistics 2001).Children in <strong>Bangladesh</strong> suffer from short-term acute food deficits (as reflected in low weight<strong>for</strong>-age)as well as from longer-term chronic under-nutrition (as reflected in high rates <strong>of</strong>stunting). As shown in table 2.1, the rate <strong>of</strong> stunting <strong>for</strong> children below six years <strong>of</strong> age wasabout 49 percent in 2000 (38 percent in urban areas and 50 percent in rural areas). Withinthe same age group, the proportion <strong>of</strong> underweight children was about 50 percent (42 percentin urban areas and 53 percent in rural areas), and wasting was over 10 percent. Between 13percent and 19 percent <strong>of</strong> children were severely underweight or stunted.Table 2.1. Trends in Various Indicators <strong>of</strong> Malnutrition in <strong>Bangladesh</strong>Nutrition Status Indicator Child Nutrition Survey, 2000Demographic &Health Survey1999-2000Urban Rural AllStunting (height-<strong>for</strong>-age)% below 2 standard deviationsUnderweight (weight-<strong>for</strong>-age)% below 2 standard deviationsWasting (weight-<strong>for</strong>-height)% below 2 standard deviationsSource: World Bank 2002a.38.3 50.7 48.8 4542.2 53.8 51.1 4811.8 11.9 11.7 10The overall level <strong>of</strong> child malnutrition in <strong>Bangladesh</strong> remains one <strong>of</strong> the highest in the world.In the late 1990s, <strong>Bangladesh</strong> ranked second in terms <strong>of</strong> the proportion <strong>of</strong> underweight childrenbelow five years <strong>of</strong> age and fourth in terms <strong>of</strong> the proportion <strong>of</strong> children stunted. <strong>Bangladesh</strong>also had the second-highest percentage (30 percent) <strong>of</strong> infants with low birth weight in theworld (Ministry <strong>of</strong> Finance 2002b).Malnutrition in <strong>Bangladesh</strong> varies by geographic location, with children in rural areas havinghigher incidence <strong>of</strong> malnutrition than in urban areas. The lowest rates <strong>of</strong> child malnutritionare found in the urban areas <strong>of</strong> Dhaka and Khulna division. There are large differences inchild malnutrition across economic groups, with the poor having the highest incidence <strong>of</strong>malnutrition.As shown in table 2.2, only 32 percent <strong>of</strong> the population meet calorie requirements, 36percent meet protein requirements, and 25 percent meet fat requirements. In rural areas, theseproportions are higher <strong>for</strong> calories (35 percent) but lower <strong>for</strong> protein (45 percent) and fat (21percent) — reflecting the importance <strong>of</strong> cereals in their diet, especially rice.<strong>Elements</strong> <strong>of</strong> a <strong>National</strong> <strong>Food</strong>-<strong>for</strong>tification <strong>Program</strong> <strong>for</strong> <strong>Bangladesh</strong>3
Section 2: Nature <strong>of</strong> the Micronutrient ProblemMicronutrient DeficiencyTable 2.3 describes nutrition adequacy interms <strong>of</strong> estimated average requirement(EAR). Micronutrient intake is low <strong>for</strong>calcium, iron, vitamin A, and vitamin B-2.Although not evaluated in the table, intakes<strong>of</strong> vitamin B-12 and zinc are likely to be lowbecause their sources are similar to those<strong>for</strong> the other micronutrients listed. Table 2.3shows that intake is adequate (higher than100 percent <strong>of</strong> EAR) only <strong>for</strong> vitamin B-1 andniacin.Table 2.4 shows vitamin A indicators <strong>for</strong>children and women. In all cases, serumretinol levels indicate the presence <strong>of</strong> a seriouspublic health problem (percent deficiencyhigher than 15 percent). Deficiency figures arelower among preschoolers due to the vitaminA supplementation program. However, whilesupplementation has reduced clinical andocular signs <strong>of</strong> vitamin A deficiency in this agegroup, their serum retinol level remains low.Table 2.2. Percent <strong>of</strong> Population Able to Meet Calorie, Protein, and FatRequirements in <strong>Bangladesh</strong> (1995-96)Intake as a %Calories Protein Fat<strong>of</strong> RequirementRural Urban All Rural Urban All Rural Urban All< 80% 36 50 39 32 31 32 70 49 6580-90% 15 16 15 11 10 11 5 6 590-99% 14 12 14 11 10 11 4 5 4100% & above 35 22 32 45 49 36 21 40 25Source: Jahan and Hussain 1998Table 2.3. Micronutrient Adequacy in <strong>Bangladesh</strong> (1995-96)Intake (mg/day) % EARNutrient EAR (mg/day) Rural Urban Rural UrbanCalcium 833 328 363 40 43Iron 21.6 11 13 51 60Vitamin A * 429 259 378 43 88B-1 1 1.2 1.1 120 110B-2 1.1 0.5 0.5 41 41Niacin 12 19 17 160 141Note:* Based on new equivalence factor <strong>of</strong> 1:12 <strong>for</strong> B-carotene, instead <strong>of</strong> 1:6 (retinol: B-carotene).Source Calculations using data in Jahan and Hossein 19984 MOST The USAID Micronutrient <strong>Program</strong>Table 2.4. Vitamin A Deficiency in <strong>Bangladesh</strong>(percent below the reference point)Age Group & GenderReferencePoint (mmol/l)% Deficiency1-5 years old < 0.7 22School Children < 1.05 74Adolescent Girls < 1.05 47WomenNon-pregnant < 1.05 30Pregnant < 1.05 47Lactating < 1.05 46Source: Mannan 2002
Section 2: Nature <strong>of</strong> the Micronutrient ProblemTable 2.5. Anemia Prevalence in<strong>Bangladesh</strong> (percent)YearAge Group &1995-96Gender1999Rural UrbanPreschoolers 52Male — 60.4 29.3Female — 79.4 47.15-14 yearsMale — 78 65Female — 83 76WomenNon-pregnant 38.9 85.2 69.2Pregnant * 49.2 60 53.4Lactating 48.7 83.7 80.9Note:* Anemia is normally higher <strong>for</strong> pregnant women.The reference criteria used to assess anemiamight explain the unusual results presented here.Source: Johan and Hussein 1998; Helen Keller 2001.Current Ef<strong>for</strong>ts to ReduceMicronutrient DeficiencyTable 2.5 demonstratesthat anemia is avery serious healthproblem <strong>for</strong> all ageand population groups.Anemia is substantiallyhigher in rural areasthan in urban areas <strong>for</strong>both men and womenand <strong>for</strong> all age groups.It is also significantlyhigher <strong>for</strong> womenthan <strong>for</strong> men <strong>for</strong> allgeographic locationsand age groups.As reflected in its <strong>National</strong> Plan <strong>of</strong> Action<strong>for</strong> Nutrition (NPAN), prepared incollaboration with government pr<strong>of</strong>essionals,non-governmental organizations (NGOs),private-sector agencies, and donororganizations in 1997, <strong>Bangladesh</strong> regardsimproved nutrition as a top governmentpriority. The NPAN is tasked with analyzingthe current nutrition situation in <strong>Bangladesh</strong>,defining objectives and targets, <strong>for</strong>mulating astrategic framework <strong>for</strong> plan implementation,and defining the institutional framework <strong>for</strong>translating those plans into action.NPAN has five central components:Promote breastfeeding andcomplementary feedingCare <strong>for</strong> the economically deprived andnutritionally vulnerablePromote appropriate diets and healthylifestylesOngoing programs to reduce micronutrientdeficiency in <strong>Bangladesh</strong> are dietarydiversification and other food-basedinterventions, including development <strong>of</strong>home gardens, poultry, fisheries, and othersmall farm animals at the community level;salt iodization; and universal vitamin Asupplementation <strong>for</strong> young children andlactating women.<strong>Food</strong> <strong>Fortification</strong> andMicronutrient MalnutritionDespite the success <strong>of</strong> vitamin Asupplementation and related activities,especially <strong>for</strong> preschoolers, significant ef<strong>for</strong>tsare still needed to reduce micronutrientmalnutrition. As part <strong>of</strong> its strategy t<strong>of</strong>urther reduce this deficiency, the GOBrequested USAID assistance to introduce food<strong>for</strong>tification.<strong>Food</strong> <strong>for</strong>tification — the addition <strong>of</strong>micronutrients to processed foods — is afood-based approach <strong>for</strong> the prevention <strong>of</strong>micronutrient malnutrition. <strong>Fortification</strong> <strong>of</strong>widely consumed foods can result in rapidimprovements in the micronutrient status<strong>of</strong> large segments <strong>of</strong> the population. Otheradvantages <strong>of</strong> food <strong>for</strong>tification are that itdoes not require changes in consumptionpatterns and relies upon an existing deliveryinfrastructure.The food-<strong>for</strong>tification program in <strong>Bangladesh</strong>was initiated with the implementation <strong>of</strong> apilot wheat-flour <strong>for</strong>tification activity. Buildingon that initiative, the GOB has launchedan ef<strong>for</strong>t to examine the suitability <strong>of</strong> otherfood-<strong>for</strong>tification vehicles. As a result <strong>of</strong>these interventions, it is expected that food<strong>for</strong>tification will soon become an importantelement <strong>of</strong> the country’s strategy to reducemicronutrient malnutrition.Enhance nutrition education, advocacy,and community participationReduce micronutrient deficiency<strong>Elements</strong> <strong>of</strong> a <strong>National</strong> <strong>Food</strong>-<strong>for</strong>tification <strong>Program</strong> <strong>for</strong> <strong>Bangladesh</strong>5
Section 3: Potential <strong>Food</strong>-<strong>Fortification</strong> VehiclesSection 3: Potential <strong>Food</strong>-<strong>Fortification</strong> VehiclesEdible OilProduction, Imports, and Consumption<strong>Bangladesh</strong> produces between 400,000 and 450,000 metric tons (MT) <strong>of</strong> oilseeds per year,50-60 percent <strong>of</strong> which is mustard-seed oil. Mustard-seed oil, soybean oil, and palm oilare the three major sources <strong>of</strong> edible oil; soybean oil and palm oil are imported.As shown in table 3.1, <strong>Bangladesh</strong> has imported about 700,000 MT per year <strong>of</strong> soybean oiland palm oil since 2000-2001; these imports are refined in-country. Per capita consumption <strong>of</strong>the two categories <strong>of</strong> oil was 14g/day on average over the same period. Since mustard-seed oil isnot suitable <strong>for</strong> <strong>for</strong>tification, it was omitted from the calculations.Table 3.1 Soybean and Palm Oil in <strong>Bangladesh</strong>: Imports and Consumption, 1999-2003 (MT)YearImportsPopulationConsumptionSoybean Oil Palm Oil (million) Total* Per Capita (g/day)1999-2000 387,892 107,596 121 468,561 102000-2001 600,832 249,569 131 802,890 172001-2002 478,265 387,455 133 914,685 172002-2003 301,048 345,928 135 607,709 12Average 442,009 272,637 132 673,461 14* Extraction rate: 95 percent <strong>for</strong> soybean oil and 93 percent <strong>for</strong> palm oilSource: calculations using data from the <strong>National</strong> Board <strong>of</strong> Revenue (Ministry <strong>of</strong> Finance)6 MOST The USAID Micronutrient <strong>Program</strong>Table 3.1 shows that per capita consumption <strong>of</strong> soybean oil and palm oil was 10g/day in1999-2000. This estimate is consistent with results in the <strong>Bangladesh</strong> Bureau <strong>of</strong> Statistics survey,which estimates per capita edible oil consumption (all types <strong>of</strong> oil) at 12.82g/day in 2000. Asindicated in the same survey, even though per capita oil consumption is higher in urban areasthan in rural areas, per capita oil consumption in rural areas is only slightly lower than 90percent <strong>of</strong> the national average (11.24/g/day and 12.82g/day, respectively).Table 3.2 presents per capita oil consumption estimates (<strong>for</strong> all types <strong>of</strong> oil) by age group andgender. The table reveals two characteristics: first, per capita consumption is higher <strong>for</strong> higherage groups; second, per capita consumption is significantly higher (about 45 percent) <strong>for</strong> menthan <strong>for</strong> women. The two consumption characteristics apply to both rural and urban areas.It is also important to note that per capita consumption <strong>of</strong> soybean oil and palm oil has beenrapidly increasing in recent years. As shown in table 3.1, per capita consumption has been 14g/day on average since 2000-2001, and was as high as 17g/day in 2000-2001 and 2001-2002.Table 3.2. Oil Consumption Patterns in <strong>Bangladesh</strong> (g/day)Age Group & Gender Rural Urban All1-3 years 2 2.5 2.14-6 years 4 6.5 4.57-9 years 4.8 7.8 5.4Female 7.1 13.4 8.4Male 10 20.3 12.1Source: Jahan and Hossein 1978
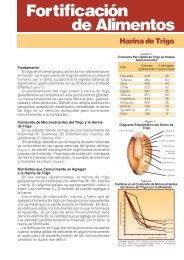
Section 3: Potential <strong>Food</strong>-<strong>Fortification</strong> Vehicles80706050403020100Soybean Oil and Palm Oil ProcessingOnly unrefined soybean oil and palm oilare imported, and imports are processed bya limited number <strong>of</strong> producers. Interviewsconducted <strong>for</strong> this study indicate that thereare about 50 oil producers in <strong>Bangladesh</strong>, <strong>of</strong>which 15 are active. Three large producers —with an individual capacity <strong>of</strong> over 500 MT/day — process 80-90 percent <strong>of</strong> all soybean-oiland palm-oil imports.Wheat Flour 1Wheat Production and ImportsWheat is cultivated mainly in thecountry’s northern and western regions,two areas less prone to flooding. During 1995-2001, domestic production averaged about 1.7million MT, while imports averaged about 1.4million MT. In the past four years, averageproduction has been about 1.4 million MT andaverage imports about 1.5 million MT. Thus,total annual wheat supply in <strong>Bangladesh</strong> hasbeen about 3 million MT per year. 2Domestic wheat production expanded at7.8 percent per year, on average, in 1987-2001, and imports declined by 1.7 percentannually during the same period. This trendwas reversed in recent years, however. Overthe past four years, average annual productiondeclined by 3 percent, while average annualimports increased by 16 percent.Average Daily Wheat Consumption, 199954%All66.6%Urban46.5%Rural38.1%Poor65.5%Non-PoorWheat imports in <strong>Bangladesh</strong> fall into threemain categories: imports by the private sector,imports by the government’s Public <strong>Food</strong>Distribution System, and imports by <strong>for</strong>eigndonors.At the start <strong>of</strong> the 1990s, <strong>for</strong>eign donationsaccounted <strong>for</strong> virtually all imports. However,since 1991-92 (date at which they werefirst permitted), private-sector (commercial)imports have increased steadily, while theproportion <strong>of</strong> <strong>for</strong>eign donations has declined.During the same period, governmentcommercial imports through the Public <strong>Food</strong>Distribution System have been negligible. Forthe past three years, the private-sector’s share<strong>of</strong> total imports has been three-quarters. Thefact that private sector imports have beensteadily increasing in the face <strong>of</strong> the declinein <strong>for</strong>eign donations suggests that the wheatsector is becoming more <strong>of</strong> a private-marketactivity in <strong>Bangladesh</strong>.Wheat-Flour ConsumptionAs a source <strong>of</strong> energy and proteinin <strong>Bangladesh</strong>, wheat ranks second inimportance after rice, although representingonly 10-15 percent <strong>of</strong> total cereal consumption(FAO 2002). Wheat consumption is moreimportant in urban areas than in rural areas.A 1999 survey <strong>of</strong> food consumption patternsindicates that overall consumption averages54g/day/person <strong>of</strong> wheat or 43g/day/person<strong>of</strong> wheat flour. Calculations using data inWFP 2004 indicate that total consumptionhas averaged about 56g/day/person <strong>of</strong> wheator 45g/day/person <strong>of</strong> wheat flour in the pastfour years. The 1999 food-consumption surveyreports an average daily per capita wheatconsumption <strong>of</strong> 66.6g in urban areas and46.5g in rural areas (equivalent to 53g and37g <strong>of</strong> wheat flour, respectively). The samesurvey reports separately <strong>for</strong> families classifiedas poor and non-poor. Daily wheat per capitaconsumption was 38.1g <strong>for</strong> the poor and65.5g <strong>for</strong> the non-poor (equivalent to 30g and52g <strong>of</strong> wheat flour, respectively). Results aresummarized in the figure to the left.1 This section on wheat flour draws on Rassas and Fitch 20022 All production and import data are calculated from FAO; WFP 2001; and WFP 2004<strong>Elements</strong> <strong>of</strong> a <strong>National</strong> <strong>Food</strong>-<strong>for</strong>tification <strong>Program</strong> <strong>for</strong> <strong>Bangladesh</strong>7
Section 3: Potential <strong>Food</strong>-<strong>Fortification</strong> VehiclesWheat is consumed primarily in flat breadsknown as chapatis and parotas, althoughraised breads and pastries — <strong>of</strong>ten frombakeries — are also consumed in urban areas.The flat breads are made with whole-wheatflour known as atta, whereas breads andpastries are made with various grades <strong>of</strong> whiteflour known as maida.Production TechnologyThere are essentially two types <strong>of</strong> flour millsin <strong>Bangladesh</strong>: traditional chakki mills androller mills. Chakki mills are small stonemills, usually located in rural markets and insome urban commercial centers. Although theexact figure is unknown, there are commonlyreported to be thousands <strong>of</strong> chakki mills in<strong>Bangladesh</strong>.Chakki mills, many imported from India,produce whole-wheat flour. These millstypically have the capacity to grind a few tons<strong>of</strong> grain per day and operate on demand, ascustomers bring in grain <strong>for</strong> milling.Roller mills are the main source <strong>of</strong> flour <strong>for</strong>urban consumers, and most <strong>of</strong> those mills arelocated in or near urban centers, particularlyin the industrial areas <strong>of</strong> greater Dhaka andChittagong. According to recent studies, thereare about 260 roller mills in <strong>Bangladesh</strong>.These mills tend to be much larger thanchakki mills. It is reported that while dailymilling output <strong>of</strong> the roller mills rangesfrom 20 to 150 MT <strong>of</strong> wheat, nearly all havecapacities <strong>of</strong> over 50 MT/day.ProductsProducts <strong>of</strong> the mills vary depending upontheir markets and upon the capacity <strong>of</strong> theirequipment. It appears that all mills producesome combination <strong>of</strong> three basic items: maida,atta, and bran. Most mills also produce asmall amount <strong>of</strong> souji (farina), which is used<strong>for</strong> confections and pastries made <strong>for</strong> specialoccasions. A certain amount <strong>of</strong> bran is addedback to maida to make atta, and the rest <strong>of</strong>the bran is sold <strong>for</strong> cattle feed. Mills withmore-sophisticated equipment <strong>of</strong>ten make twoor three grades <strong>of</strong> maida — with the whitestgoing as their premium quality — while othermills make two grades <strong>of</strong> atta.Depending upon the technical characteristicsand commercial objectives <strong>of</strong> the mill, theproduct mix varies within the following ranges,as a percent <strong>of</strong> the original grain weight:Maida 60-65%Atta 20-25%Souji 2-3%Bran 15-20%Refraction (milling loss) 1-4%Atta produced by roller mills is differentfrom that produced by chakki mills in thatit normally contains less bran. It also variesin nutritional content, according to how itis made. Some mills appear to use only themill’s highest “ash stream,” sometimes called“red dog,” which has very high mineraland vitamin content. Other mills produce a“premium” (lighter color) atta that containsmore maida, but a reduced micronutrientcontent.Market StructureSince the chakki mills operate primarily ascustom mills (grinding wheat <strong>for</strong> individualcustomers), commercial marketing <strong>of</strong> wheatflour is mostly an activity <strong>of</strong> the roller mills.Roller mills produce mainly <strong>for</strong> the urbanmarket, but they also sell flour to merchantsand restaurants in rural areas, particularlythose within reach <strong>of</strong> the mills’ location.The exact size <strong>of</strong> the market served by theroller mills is not well understood. Within theindustry itself, it is <strong>of</strong>ten said that roller millsaccount <strong>for</strong> over half the flour consumed inthe country. But it is also said that roller millsproduce primarily <strong>for</strong> the urban market. Whatis not known is the extent to which roller-millflour penetrates the rural market.<strong>Bangladesh</strong>’s transport system placeslimitations on the marketing area that anygiven mill can serve. Nevertheless, roller-millflour does reach into rural markets to some8 MOST The USAID Micronutrient <strong>Program</strong>
Section 3: Potential <strong>Food</strong>-<strong>Fortification</strong> Vehiclesextent. It is estimated that about one-third <strong>of</strong>the flour produced by roller mills is sold torural consumers. It is also estimated (Rassasand Fitch 2002) that roller-mill productionaccounts <strong>for</strong> about 48 percent <strong>of</strong> the wheatflour consumed in <strong>Bangladesh</strong>.SugarProductionIn <strong>Bangladesh</strong>, sugar production is basedupon the sugarcane industry, whichproduces over 7 million MT <strong>of</strong> sugarcaneannually over an area <strong>of</strong> 180,000 hectares inthe north-west and south-west. It is estimatedthat about 0.5 million farmers are involved insugarcane production. Sugarcane farming issupported by the <strong>Bangladesh</strong> Sugar ResearchInstitute, headquartered in Ishurdi, Pabna,about 250 km north-west <strong>of</strong> Dhaka. TheInstitute conducts research on sugarcane, gur(molasses), and cane juice. Its mandate isTable 3.3: Sugar Production in <strong>Bangladesh</strong>, 1993-94 (MT)Year Capacity Production1993-94 202,050 221,5471994-95 198,440 270,1961995-96 195,440 183,9341995-96 210,440 135,3201995-96 210,440 166,4571998-99 210,440 152,9791999-00 210,440 123,4982000-01 210,440 98,3552001-02 210,440 204,3292002-03 210,440 177,3992003-04 210,440 119,390Source: BSFICTable 3.4. Official Sugar Imports in <strong>Bangladesh</strong>, 1990-2003 (MT)Year Government Private Sector Total1999-00 147,000 102,140 249,1402000-01 98,972 183,884 282,8562001-02 125,350 132,622 257,9722002-03 26,250 231,126 257,376Source: government import-data are from the BSFIC; private import data arefrom the <strong>National</strong> Board <strong>of</strong> Revenue, Ministry <strong>of</strong> Finance.to develop and disseminate new sugarcanevarieties and improved production technology.Although sugar production averaged about170,000 MT in the past 10 years and about145,000 MT in the past five years, it hasfluctuated widely — particularly in recentyears (table 3.3).Sugar is produced in 15 factories ownedby the <strong>Bangladesh</strong> Sugar and <strong>Food</strong> IndustriesCorporation (BSFIC), a state-owned company.BSFIC employs almost 17,000 workers andpurchases its sugarcane through a contractfarmingscheme that provides credit to farmersin the <strong>for</strong>m <strong>of</strong> inputs and cash. 3Since 1995-96, competition with gurproducers, together with fluctuation insugarcane production, has resulted inunderutilization <strong>of</strong> BSFIC plant capacity (table3.3). Excess capacity averaged almost 60,000MT/year in the past ten years and more than80,000 MT/year in the past five years.Total production and <strong>of</strong>ficial imports inthe past four years were about 410,000 MTper year on average (tables 3.3 and 3.4),equivalent to an average daily consumption <strong>of</strong>8.5g. This consumption figure is in line withestimates derived from national nutritionsurveydata. For instance, per capita sugarconsumption is estimated at 7g/day in Jahanand Hossain and ranges between 6.85g/day and 9.2g/day in <strong>Bangladesh</strong> Bureau <strong>of</strong>Statistics 2001.Imports and ConsumptionOnly white sugar is imported in <strong>Bangladesh</strong>.Official imports averaged slightly more than260,000 MT in the past four years (table3.4). All sugar imports have been channeledthrough the private sector, except during afive-year period extending from 1998-99 to2002-2003. BSFIC has yet to import any sugarin 2003-2004.3 Contract farming is an institutional arrangement between farmers and buyers in which farmers supply produce according to specifiedproduction and management methods, while buyers retain responsibility <strong>for</strong> marketing operations and technical assistance.<strong>Elements</strong> <strong>of</strong> a <strong>National</strong> <strong>Food</strong>-<strong>for</strong>tification <strong>Program</strong> <strong>for</strong> <strong>Bangladesh</strong>9
Section 3: Potential <strong>Food</strong>-<strong>Fortification</strong> VehiclesThe similarity between estimates based ontrade data and those derived from nationalnutrition-survey data suggests that un<strong>of</strong>ficialsugar imports in recent years have beennegligible. This conclusion is at variancewith the commonly held view in <strong>Bangladesh</strong>that un<strong>of</strong>ficial cross-border sugar importsare significant. A possible explanation<strong>for</strong> the divergence is that sugar importedthrough in<strong>for</strong>mal channels tends to declinesubstantially in years when BSFIC is active inthe sugar trade. Although BSFIC imported anaverage <strong>of</strong> 100,000 MT per year between 1999-00 and 2002-03, it did not import any sugarbe<strong>for</strong>e 1998-99, nor does it intend to importany sugar in the current year. A longer timeserieswould undoubtedly show that <strong>of</strong>ficialimports increase as BSFIC ceases or otherwisereduces sugar-import activities. However, acomparison <strong>of</strong> BSFIC and un<strong>of</strong>ficial imports isunlikely to show an inverse relationship, sinceprivate imports are expected to substitute <strong>for</strong>at least part <strong>of</strong> BSFIC imports.As can be derived from tables 3.3 and3.4, local sugar production in <strong>Bangladesh</strong>is estimated at 20-25 percent <strong>of</strong> total sugarconsumption. This finding points to animportant conclusion: since only localproduction can be <strong>for</strong>tified, per capitaconsumption <strong>of</strong> <strong>for</strong>tified sugar would beproportionately lower than current per capitasugar consumption, and the vast majority <strong>of</strong>the population would not have access to the<strong>for</strong>tified product.Per capita consumption <strong>of</strong> <strong>for</strong>tified sugarin rural areas would be even lower, reflectingthe country’s current geographic consumptionpatterns. According to the <strong>Bangladesh</strong> Bureau<strong>of</strong> Statistics, sugar consumption in 2000 was8.78/day in urban areas but only 6.37g/day inrural areas. Such differences in consumptionare further detailed in table 3.5.Table 3.5. Sugar Consumption Patterns in<strong>Bangladesh</strong> in 1995-96 (g/day)Age Group & Gender Rural Urban All1-3 years 6.3 10.8 7.24-6 years 4.7 6.0 5.07-9 years 7.8 7.7 7.8Female 5.6 6.8 5.8Male 10.0 10.0 10.0Source: Jahan and Hossein 1998Per capita consumption <strong>of</strong> <strong>for</strong>tified sugarin rural areas is likely to be much lower thanthe national average <strong>for</strong> two reasons: percapita sugar consumption in rural areas islower than in urban areas, and also gur — a<strong>for</strong>m <strong>of</strong> molasses not suitable <strong>for</strong> <strong>for</strong>tification— represents a significant component <strong>of</strong> sugarconsumption in rural areas.10 MOST The USAID Micronutrient <strong>Program</strong>
Section 4: Cost Analysis <strong>of</strong> <strong>Food</strong> <strong>Fortification</strong>Section 4: Cost Analysis <strong>of</strong> <strong>Food</strong> <strong>Fortification</strong>RationaleIn<strong>for</strong>mation on <strong>for</strong>tification costs can be useful to decision-makers in assessing the<strong>for</strong>tification program’s potential economic impact on consumers. Such in<strong>for</strong>mation may, <strong>for</strong>instance, be used to ascertain whether price increases associated with <strong>for</strong>tification will berelatively low and thus not affect consumers adversely. In particular, cost in<strong>for</strong>mation may beused to confirm that, while consumption <strong>of</strong> the <strong>for</strong>tified food will have positive health effects onconsumers, the price increase will not place it beyond the reach <strong>of</strong> the most vulnerable segments<strong>of</strong> the population.Cost in<strong>for</strong>mation is equally important <strong>for</strong> the private sector. Mill owners, oil refiners, andsugar producers will make more-in<strong>for</strong>med decisions when cost in<strong>for</strong>mation is readily available.Knowledge <strong>of</strong> <strong>for</strong>tification costs is all the more important under voluntary <strong>for</strong>tification becauseproducers need an advance determination that <strong>for</strong>tification can be put into operation at a priceconsumers are willing to pay. Factory owners also need in<strong>for</strong>mation on the potential adjustmentsthat may be required in terms <strong>of</strong> plant redesign, new equipment, and personnel.Results<strong>Fortification</strong> <strong>of</strong> wheat flour, oil, and (to a certain extent) sugar requires very little modification<strong>of</strong> the usual processing operations and is relatively simple and inexpensive. The main costs<strong>of</strong> <strong>for</strong>tification are those <strong>of</strong> the micronutrients. The cost <strong>of</strong> the equipment used to incorporatemicronutrients into the food vehicle will depend on the sophistication <strong>of</strong> the system adoptedand on the design and capacity <strong>of</strong> the processing plant. A limited amount <strong>of</strong> labor is required tooperate the equipment and manage the <strong>for</strong>tificant, as well as to implement the necessary qualityassuranceand quality-control procedures. There are also costs associated with testing <strong>for</strong> qualityassurance — daily within the plant and periodically by outside organizations.A summary <strong>of</strong> the unit costs <strong>of</strong> <strong>for</strong>tification appears in table 4.1, with detailed calculationsprovided as annexes to this study. The annexes estimate <strong>for</strong>tification costs in terms <strong>of</strong> totalexpenditure incurred by processors as well as per MT <strong>of</strong> <strong>for</strong>tified flour.Total <strong>for</strong>tification costsAs shown in table 4.1, total cost <strong>of</strong> <strong>for</strong>tification is estimated at about Tk223 ($3.85) per MT<strong>for</strong> oil, Tk295 ($5) per MT <strong>for</strong> wheat flour, and Tk630 ($10.8) <strong>for</strong> sugar. <strong>Fortification</strong> costs,including vitamin A, are estimated at 0.46 percent <strong>of</strong> (weighted) retail price <strong>for</strong> oil (0.43 percent<strong>for</strong> soybean oil and 0.53 percent <strong>of</strong> palm oil); 1.6 percent <strong>of</strong> the retail price <strong>for</strong> flour (maida)in plastic bags; and 2.09 percent <strong>of</strong> the retail price <strong>for</strong> sugar. Such estimates suggest that theadditional cost <strong>of</strong> <strong>for</strong>tification does not appear prohibitive to consumers, particularly in the case<strong>of</strong> oil, where the increase is particularly modest.Cost figures presented in table 4.1 do not include the 47 percent import duty currentlyimposed on micronutrients, and taking the import tax into consideration would raise the costs <strong>of</strong><strong>for</strong>tification substantially. As shown in table 4.2, incorporating such a tax into the calculationswould raise the cost <strong>of</strong> <strong>for</strong>tification to $5.62/MT <strong>for</strong> oil, $7.21/MT <strong>for</strong> wheat flour, and$16.08/MT <strong>for</strong> sugar, with a proportionate increase in retail prices <strong>for</strong> the three commodities.This conclusion suggests that it might be wise to consider eliminating the import duty onmicronutrients.<strong>Elements</strong> <strong>of</strong> a <strong>National</strong> <strong>Food</strong>-<strong>for</strong>tification <strong>Program</strong> <strong>for</strong> <strong>Bangladesh</strong>11
Section 4: Cost Analysis <strong>of</strong> <strong>Food</strong> <strong>Fortification</strong>Table 4.1. <strong>Fortification</strong> Costs <strong>for</strong> Wheat Flour, Oil, and Sugar in <strong>Bangladesh</strong>Cost per Metric TonItemWheat Flour Oil SugarTk Dollar Tk Dollar Tk DollarCapital Costs 15.1 0.26 3.3 0.06 29.8 0.51Maintenance & Repair 0.9 0.02 0.2 — 1.7 0.03Electric Power 0.5 0.01 0.4 0.01 3.5 0.06Labor 0.6 0.01 0.2 — 1.0 0.02Testing at Factory 10.6 0.18 5.8 0.10 11.6 0.20Outside Testing 2.8 0.05 1.5 0. 03 2.6 0.04Vitamin A or Premix 264 4.55 215.2 3.71 606.9 10.46<strong>Fortification</strong> Cost 294 5.07 223 3.85 627 10.81Note: — denotes a negligible amountTable 4.2. <strong>Fortification</strong> Costs <strong>for</strong> Wheat Flour,Oil, and Sugar in <strong>Bangladesh</strong> with theCurrent Import Duty on MicronutrientsCommodity<strong>Fortification</strong> Costs(dollar/MT)Percent <strong>of</strong>retail priceOil 5.55 0.62Wheat Flour 7.21 2.3Sugar 15.93 3.08MicronutrientsWhile vitamin A is the only ingredient addedto oil and sugar, <strong>for</strong>tified wheat flour containsthiamine, rib<strong>of</strong>lavin, niacin, folic acid, iron,and zinc — in addition to vitamin A.At 90-95 percent <strong>of</strong> total <strong>for</strong>tification costs,the premix 4 is the single largest component<strong>of</strong> those costs. It is worth noting that sincethe cost <strong>of</strong> vitamin A is about 50 percent <strong>of</strong>premix cost <strong>for</strong> wheat flour, reducing theamount <strong>of</strong> vitamin A in the wheat flour wouldlower the cost <strong>of</strong> the premix significantly.<strong>Fortification</strong> equipmentMicronutrient mix is metered into the stream<strong>of</strong> the <strong>for</strong>tified commodity as it flows througha conveyor or pneumatic transfer spoutnear the end <strong>of</strong> the processing operation.Incorporating micronutrients into the foodvehicle requires a mixer, blender, or similarequipment and a special automatic feederwith a flow-rate-control device — regulated byeither weight or volume — that causesthe addition <strong>of</strong> the micronutrient mix to varywith product flow on the line.The feeder tank contains paddles or otheragitators to ensure that the micronutrient mixflows evenly and does not clog. The feeder isusually equipped with electrical or electronicsafeguards to ensure that the line is stoppedif the flow <strong>of</strong> micronutrient mix is insufficientor excessive, or when the flow <strong>of</strong> producton the line is inadequate to permit uni<strong>for</strong>mmixing. In the case <strong>of</strong> sugar, the micronutrientmix is first diluted with a certain amount <strong>of</strong>sugar inside a batch blender. The combination<strong>of</strong> micronutrient mix and a given amount <strong>of</strong>sugar is called premix.Total annual costs <strong>of</strong> the <strong>for</strong>tificationequipment, including investment,maintenance, repairs, and energy, areestimated at Tk16.5 ($0.29) per MT <strong>for</strong> wheatflour, TK35 ($0.60) <strong>for</strong> sugar, and Tk4 ($0.07)<strong>for</strong> oil.It is worth noting that annual investmentcosts <strong>of</strong> the <strong>for</strong>tification equipment willdepend not only on the purchase price <strong>of</strong> such4 A premix is a combination <strong>of</strong> the micronutrients themselves and another ingredient (<strong>of</strong>ten the same food to be <strong>for</strong>tified) to improvethe combination <strong>of</strong> the micronutrient mix in the food and reduce the segregation between the food and micronutrient particles.12MOST The USAID Micronutrient <strong>Program</strong>
Section 4: Cost Analysis <strong>of</strong> <strong>Food</strong> <strong>Fortification</strong>equipment, but will also and more importantlyreflect the economies <strong>of</strong> scale associated withfactory output. 5Quality assurance and quality controlQuality assurance refers to systematicimplementation <strong>of</strong> a set <strong>of</strong> activities toensure that the <strong>for</strong>tified food will meetquality standards. Quality control refers tothe techniques and activities that documentcompliance with the technical requirements <strong>of</strong>food-<strong>for</strong>tification through the use <strong>of</strong> objective,measurable indicators.Each producing factory has a qualityassurancedepartment responsible <strong>for</strong>inexpensive, semi-quantitative testing carriedout at regular intervals while the mill is inoperation. Tests are run shortly after thesamples are taken so that problems canbe detected and corrected as they occur. Aportion <strong>of</strong> each sample is saved <strong>for</strong> possibleverification tests by food-control authorities.The premix received from the manufactureris also sampled and tested to confirm quality.Quality-control personnel are responsible<strong>for</strong> maintaining records <strong>of</strong> the testing aswell as <strong>of</strong> the quantities <strong>of</strong> premix used and<strong>for</strong>tified commodity produced. Periodically,samples are sent to outside laboratories toconfirm quality and con<strong>for</strong>mity with technicalspecifications.As indicated in table 4.1, the costs <strong>of</strong> testingare low <strong>for</strong> wheat flour (Tk13 or $0.23 perMT) and oil (Tk 7.3 or $0.13 per MT), andslightly higher <strong>for</strong> sugar (Tk 14.2 or $0.24 perMT).LaborAdditional labor is required to operate andmonitor the <strong>for</strong>tification equipment and toadd the micronutrient premix to the feeder.Additional personnel are also required to carryout the various quality-control and qualityassuranceprocedures, including regularsampling and testing <strong>of</strong> the <strong>for</strong>tified food.Ranging between Tk0.2 <strong>for</strong> oil and Tk0.6 <strong>for</strong>wheat flour, labor costs per MT are negligible<strong>for</strong> all commodities under consideration.5 Economies <strong>of</strong> scale in production occur because both investment and operating costs per unit <strong>of</strong> output tend to decrease as quantityprocessed increases. For instance, investment costs <strong>of</strong> the equipment per unit <strong>of</strong> <strong>for</strong>tified food are expected to be lower <strong>for</strong> factorieswith larger production capacity since the same equipment may be used in smaller factories to produce a smaller output. Similarly, perunit labor costs decline with size because additional labor is marginal in a large plant relative to a smaller plant.<strong>Elements</strong> <strong>of</strong> a <strong>National</strong> <strong>Food</strong>-<strong>for</strong>tification <strong>Program</strong> <strong>for</strong> <strong>Bangladesh</strong>13
Section 5: <strong>Elements</strong> <strong>of</strong> a <strong>National</strong> <strong>Food</strong>-<strong>Fortification</strong> <strong>Program</strong>Section 5: <strong>Elements</strong> <strong>of</strong> a <strong>National</strong> <strong>Food</strong>-<strong>Fortification</strong> <strong>Program</strong><strong>Food</strong> Vehicles and <strong>Fortification</strong> RegimeOilOil is a most suitable food-<strong>for</strong>tification vehicle in <strong>Bangladesh</strong>. Per capita consumption,the structure <strong>of</strong> the processing industry, and low <strong>for</strong>tification costs provide a strongrationale <strong>for</strong> such a conclusion. Analysis <strong>of</strong> the marketing system <strong>for</strong> oil indicates thatmandatory <strong>for</strong>tification would be the optimal option.ConsumptionMustard-seed, soybean, and palm oils are the country’s three major sources <strong>of</strong> edible oil. Sincemustard-seed oil is not suitable <strong>for</strong> <strong>for</strong>tification, the <strong>for</strong>tification program should concentrate onsoybean oil and palm oil. Per capita consumption <strong>of</strong> soybean oil and palm oil is both adequateand rapidly increasing. As detailed in section 4, <strong>for</strong>tified at a minimum vitamin A level <strong>of</strong> 20mg/kg, consumption <strong>of</strong> 13g/day/person <strong>of</strong> oil would supply about 52 percent <strong>of</strong> EAR — an amountexpected to have a significant biological impact. Per capita consumption increased from 10g/dayin 1999-2000 to 14g/day on average between 2000-2001 and 2002-2003, and rose as high as 17g/day in 2000-2002.Oil is consumed in adequate amounts in both rural and urban areas. Although per capita oilconsumption is higher in urban areas than in rural areas, the difference is not substantial. A2000 household income and expenditure survey (<strong>Bangladesh</strong> Bureau <strong>of</strong> Statistics 2001) showsthat per capita oil consumption in rural areas is only slightly lower than 90 percent <strong>of</strong> thenational average (11.24g/day in rural areas and 12.82g/day nationwide).Industry StructureSoybean oil and palm oil, which are imported in an unrefined <strong>for</strong>m, are processed by onlya limited number <strong>of</strong> producers. Of the 15 active oil producers in <strong>Bangladesh</strong>, only 3 have anindividual capacity <strong>of</strong> more than 1000 MT/day, and these producers process 80-90 percent <strong>of</strong>all soybean and palm oil imports. Both the size and limited number <strong>of</strong> producers suggest thatmandatory <strong>for</strong>tification <strong>for</strong> oil would be the most-effective strategy.CostAt Tk 223, or $3.81 per MT, oil has the lowest <strong>for</strong>tification cost among the three commoditiesconsidered — about 20 percent below wheat-flour <strong>for</strong>tification cost and well below sugar<strong>for</strong>tification cost. In addition, total <strong>for</strong>tification costs, including vitamin A, are estimated at 0.46percent <strong>of</strong> retail price <strong>for</strong> oil — 0.43 percent <strong>for</strong> soybean oil, and 0.53 percent <strong>of</strong> palm oil.Wheat FlourWheat flour is a suitable food-<strong>for</strong>tification vehicle in <strong>Bangladesh</strong>. This conclusion is supported bywheat-flour consumption levels and patterns, relatively low <strong>for</strong>tification costs, and the structure14MOST The USAID Micronutrient <strong>Program</strong>
Section 5: <strong>Elements</strong> <strong>of</strong> a <strong>National</strong> <strong>Food</strong>-<strong>Fortification</strong> <strong>Program</strong><strong>of</strong> the milling industry. As detailed below, thewheat-flour <strong>for</strong>tification program should relyon roller mills, not on chakki mills and shouldalso be private-sector driven and voluntary.ConsumptionPer capita wheat-flour consumption isestimated at 43g/day. Although per capitawheat-flour consumption in urban areasis higher than in rural areas, per capitaconsumption in rural areas (about 38g/day)is only 15-20 percent lower than the nationalaverage. As explained in section 4, <strong>for</strong>tification<strong>of</strong> wheat flour would supply an adequateamount <strong>of</strong> about 20 percent <strong>of</strong> the EAR <strong>for</strong>vitamin A, iron, folate, B-12, B-1, B-2, B-6,niacin, and zinc.<strong>Fortification</strong> CostsAs detailed in the previous section,<strong>for</strong>tification costs <strong>for</strong> wheat flour are aboutTk293, or $5 per MT, and represent about 1.6percent <strong>of</strong> retail prices; these figures suggestthat the additional cost <strong>of</strong> <strong>for</strong>tification doesnot appear prohibitive to consumers.A Private-Sector-Driven <strong>Program</strong>The pilot wheat-flour <strong>for</strong>tification programwas implemented in collaboration with theWorld <strong>Food</strong> <strong>Program</strong> (WFP) in support <strong>of</strong>the Vulnerable Group Development (VGD)program. Fortified atta <strong>for</strong> the VGD programis produced in special chakki mills that havebeen constructed with equipment (includingmicronutrient feeders) imported fromDenmark. These mills are operated by NGOs,under the close supervision <strong>of</strong> USAID andWFP. While this arrangement may be suitable<strong>for</strong> the limited production envisaged under theongoing pilot activity, no mechanism is nowin place that will allow production to expandbeyond the VGD program or to continuebeyond WFP’s current programming cycle.There are two reasons <strong>for</strong> concluding thatthe current approach <strong>of</strong> producing <strong>for</strong>tifiedflour in small chakki mills operated byNGOs is neither institutionally viable noreconomically sustainable under a larger-scaleprogram. First, if the <strong>for</strong>tification <strong>of</strong> wheatflour is to expand on a sustainable basis, itmust be embedded in the prevailing flourproductionand -marketing system. Passed onto consumers, the costs <strong>of</strong> <strong>for</strong>tification willbe reflected in somewhat higher flour prices.Since the flour market in <strong>Bangladesh</strong> is drivenby a vibrant and highly competitive privatesector, any flour-<strong>for</strong>tification program shouldbuild on this private-sector-based structure.Second, due to the small size <strong>of</strong> thechakki mills, their large number, and theirdistribution in remote and scattered locationsin rural areas, they are difficult to regulate.It should be added that less-refined chakkimillflour contains larger quantities <strong>of</strong> naturalvitamins and minerals than does the refinedroller-mill maida.A Roller-Mill Driven Manufacturing MethodMilling capacity is a critical factor indetermining the ease and method <strong>of</strong><strong>for</strong>tification. Evidence from other countriessuggests <strong>for</strong>tification at medium (25–150 MT/day) and large mills (>150 MT/day) to bemost appropriate, whereas the feasibility andeffectiveness <strong>of</strong> <strong>for</strong>tification at smaller stone orhammer mills has yet to be established. Largemills invariably have more-modern equipmentand a higher technical capacity to integrate the<strong>for</strong>tification technology. Larger mills can alsomore easily amortize start-up costs and takeadvantage <strong>of</strong> various economies <strong>of</strong> scale inproduction and marketing. 6Chakki mills in <strong>Bangladesh</strong> typically havethe capacity to grind only a few tons <strong>of</strong> grainper day, whereas the capacity <strong>of</strong> roller millsranges from 20 to 150 MT/day. The fact thatmany <strong>of</strong> the roller mills are already usingplastic packaging and engage in advertisingbased on product quality also makes rollermills a logical place to initiate commercial<strong>for</strong>tification.6 See previous footnote<strong>Elements</strong> <strong>of</strong> a <strong>National</strong> <strong>Food</strong>-<strong>for</strong>tification <strong>Program</strong> <strong>for</strong> <strong>Bangladesh</strong>15
Section 5: <strong>Elements</strong> <strong>of</strong> a <strong>National</strong> <strong>Food</strong>-<strong>Fortification</strong> <strong>Program</strong>Although roller mills represent theonly practical means <strong>of</strong> introducing flour<strong>for</strong>tification on a sustainable basis, it mustbe recognized that this will initially limitrural access to the <strong>for</strong>tified product, sincemost rural consumers obtain their flourthrough chakki mills. In the longer run,as the economy develops further and astransportation improves, it is likely that<strong>Bangladesh</strong> will follow the same pattern thathas been observed in other countries: rollermill production will expand and account <strong>for</strong>an increasing share <strong>of</strong> the rural market. Asthat occurs, <strong>for</strong>tified flour will further extendinto rural areas.ConsumptionThe bulk <strong>of</strong> sugar consumed in <strong>Bangladesh</strong>is imported in an already refined <strong>for</strong>m, thusplacing severe limitations on the amount<strong>of</strong> sugar available <strong>for</strong> <strong>for</strong>tification. Localproduction is only about 20-25 percent <strong>of</strong> totalsugar consumption, equivalent to less than2g/day/person. Moreover, per capita sugarconsumption in rural areas — where most<strong>of</strong> the vulnerable groups can be found — ismuch lower than in urban areas. Increasedcompetition between sugar and gur (molasses)in recent years has put additional pressure onper capita sugar consumption in rural areas.A Voluntary, not Mandatory, <strong>Program</strong>The number <strong>of</strong> mills, their size, and the extentto which flour milling is centralized willdetermine whether a mandatory or voluntaryprogram is the better option. The structure <strong>of</strong>the milling industry in <strong>Bangladesh</strong> suggeststhat a mandatory flour-<strong>for</strong>tification programwill not be realistic <strong>for</strong> two reasons. First, thesmaller mills, especially those located in ruralareas, typically will lack the capital resourcesneeded to participate in the <strong>for</strong>tificationprogram. Second, implementation <strong>of</strong> a qualitycontrolsystem will not be possible when mostparticipants consist <strong>of</strong> a large number <strong>of</strong> smallmills scattered throughout the country.CostAt about Tk630, or $10.8 per MT, the cost<strong>of</strong> sugar <strong>for</strong>tification is more than twice ashigh as that <strong>for</strong> wheat flour and nearly threetimes as high as <strong>for</strong> oil. The additional costassociated with <strong>for</strong>tification would lead to anincrease <strong>of</strong> over 2 percent in the retail price <strong>of</strong>sugar. Assuming <strong>for</strong>tification costs are passedon to consumers, this increase may place<strong>for</strong>tified sugar at a disadvantage relative tothe imported un<strong>for</strong>tified product. Only a shiftin demand <strong>for</strong> local sugar — stimulated, <strong>for</strong>instance, by a strong promotion and healtheducationcampaign — would enable <strong>for</strong>tifiedsugarproduction to compete with un<strong>for</strong>tifiedprivate-sector imports.SugarThe case <strong>for</strong> sugar <strong>for</strong>tification in <strong>Bangladesh</strong>is based on two major arguments, the firstbeing that the country has only 15 sugarfactories, which would make programcoordination and quality-control systems easyto implement. The second argument is that theBSFIC, a state-owned company, operates allthose factories.However, strong evidence presented inthis study suggests that sugar <strong>for</strong>tificationin <strong>Bangladesh</strong> is not recommended. Thisconclusion is supported by a combination<strong>of</strong> very low per capita consumption andrelatively high <strong>for</strong>tification costs.<strong>Fortification</strong> FormulationTable 5.1 describes the <strong>for</strong>tification<strong>for</strong>mulation and micronutrient supply <strong>for</strong>oil and wheat flour in <strong>Bangladesh</strong>. Fortifiedat a minimum vitamin A level <strong>of</strong> 20mg/kg,oil would supply about 52 percent <strong>of</strong> EAR— an amount expected to have a significantbiological impact.Based on the <strong>for</strong>mulation described in table5.1, <strong>for</strong>tification <strong>of</strong> maida would supply about20 percent <strong>of</strong> EAR <strong>for</strong> vitamin A, iron, folate,B-12, B-1, B-2, B-6, niacin, and zinc.16MOST The USAID Micronutrient <strong>Program</strong>
Section 5: <strong>Elements</strong> <strong>of</strong> a <strong>National</strong> <strong>Food</strong>-<strong>Fortification</strong> <strong>Program</strong>Table 5.1: <strong>Fortification</strong> Formulation and Micronutrient Supply <strong>for</strong> Wheat Flour (Maida) and Oilin <strong>Bangladesh</strong>Nutrient Form Minimum Level <strong>of</strong>Addition (mg/kg) *Wheat FlourPackaging and LabelingPackaging and product labeling playan important role in <strong>for</strong>tification, assome micronutrient additives degrade withexposure to heat, light, and other factorssuch as excessive moisture (in wheat flour,<strong>for</strong> example). Vitamins are affected by bothheat and excessive moisture, while mineralstend to be affected to a lesser extent. 7 Certainpackaging and labeling guidelines shouldthere<strong>for</strong>e be followed <strong>for</strong> each productconsidered <strong>for</strong> <strong>for</strong>tification.OilInterviews with producers indicate that about85 percent <strong>of</strong> oil produced in <strong>Bangladesh</strong> issold in large tin cans, with the remaindersold in smaller plastic bottles. Processingplants have mechanical packaging machinesthat affix their own labels and promotionalin<strong>for</strong>mation on each can or bottle. Down themarketing chain, oil in tin cans is sold toretailers and small vendors, who then resell insmaller quantities to consumers from stalls attraditional markets throughout the country.While <strong>for</strong>tified oil sold in tin cans is notlikely to lose any <strong>of</strong> its micronutrient content,the shelf life <strong>of</strong> vitamin A in oil sold intransparent plastic bottles will be adverselyaffected by exposure to light. An importantstep in the oil-<strong>for</strong>tification program willbe to replace the transparent plastic bottlewith a more-opaque container to protect themicronutrient content.Wheat FlourOverage (%) **% EAR in UsualConsumption ***Vitamin A SD250 2 50 16Iron Ferrous fumerate 45 5 20Folate Folic acid 2 50 23B-12 B-12 — 0.01% 0.010 30 18B-1 Thiamin mononitrate 6 40 18B-2 Rib<strong>of</strong>lavin 4 30 16B-6 Pyridoxin 5 20 19Niacin Niacinamide 40 10 16Zinc Zinc oxide 20 5 19OilVitamin A Vitamin A oily 1.7mIU/g 20 5 52Notes:* Selected (1) to provide at least 20 percent EAR from 50g/day/person <strong>of</strong> wheat flour consumption, (2) to becompatible with the sensorial properties <strong>of</strong> the product, and (3) to be safe <strong>for</strong> those who consume large amounts <strong>of</strong>the product.** The additional amount over the minimum level to compensate <strong>for</strong> losses in production, storage, and transportation.*** 40g/day <strong>for</strong> wheat flour and 13g/day <strong>for</strong> oil; values <strong>for</strong> families, adult male.Wheat flour in <strong>Bangladesh</strong> normally has amoisture content <strong>of</strong> 13–16 percent. At theselevels, significant loss <strong>of</strong> micronutrientswould be expected to occur if <strong>for</strong>tified flourwere stored <strong>for</strong> several months. Since flourin <strong>Bangladesh</strong> is rarely stored <strong>for</strong> more thana few weeks, micronutrient loss due to thepresence <strong>of</strong> moisture is not expected to occur.If mills were to produce dryer flour, withmoisture content <strong>of</strong> 10 percent or less, itwould be possible to store flour <strong>for</strong> longerperiods <strong>of</strong> time, provided the low moisturelevels could be maintained. For thesepurposes, it would be preferable to pack the7 Sensitivity <strong>of</strong> vitamins and minerals to heat, light and similar factors are a few <strong>of</strong> the underlying reasons <strong>for</strong> selecting the overage figuresin table 5. 1.<strong>Elements</strong> <strong>of</strong> a <strong>National</strong> <strong>Food</strong>-<strong>for</strong>tification <strong>Program</strong> <strong>for</strong> <strong>Bangladesh</strong>17
Section 5: <strong>Elements</strong> <strong>of</strong> a <strong>National</strong> <strong>Food</strong>-<strong>Fortification</strong> <strong>Program</strong>flour in plastic, which would prevent the flourfrom accumulating moisture from the humidair that normally prevails in <strong>Bangladesh</strong>.However, when the flour is being marketedwithin a short period, as is currently the case,plastic is not essential.Accurate labeling is critical when<strong>for</strong>tification is not mandatory, as expectedin the case <strong>of</strong> wheat flour in <strong>Bangladesh</strong>.When <strong>for</strong>tification is not mandatory, labelingis the only means by which consumers andinspectors can distinguish <strong>for</strong>tified flour fromthe regular product. In<strong>for</strong>mation contained inlabeling can also be a useful part <strong>of</strong> promotionand consumer education.Packaging material also plays an importantrole in labeling. It is easier to print detailedlabel in<strong>for</strong>mation on plastic than on jute sackmaterials. Furthermore, it is common <strong>for</strong>the large sacks to be reused — a procedurethat could lead to confusion and perhapsto deceptive practices by unscrupulousmerchants, who could place regular flour ina sack that had been labeled as containing<strong>for</strong>tified flour.For purposes <strong>of</strong> clear product identification,the small plastic bags would be a preferredmethod <strong>of</strong> packaging <strong>for</strong>tified flour. However,these bags are expensive and normally addone takka or more per kg to the retail price <strong>of</strong>flour, which would tend to place it out <strong>of</strong> thereach <strong>of</strong> poorer consumers. Large (25 kg) bagswith plastic lining, such as those currentlyused by WFP under the pilot program, can beclearly labeled and, while they do cost morethan the plain jute sacks, they cost less ona per-kilogram basis than small, individualplastic bags.<strong>National</strong> Capacity to Implement<strong>Food</strong> <strong>Fortification</strong>There is fervent commitment to food<strong>for</strong>tification in <strong>Bangladesh</strong> at the highestlevel <strong>of</strong> government, and a strong public andprivate-sector partnership is emerging.public and private sectors, civil society, andinternational development partners. Headedby the Minister <strong>of</strong> Industries, NFA includesthe Principal Secretary, Prime Minister’sOffice, and Secretaries <strong>of</strong> the Ministries <strong>of</strong>Agriculture, Commerce, Health and FamilyWelfare, <strong>Food</strong>, and Science, Technology, andIn<strong>for</strong>mation Communications.NFA’s private-sector members includethe Presidents <strong>of</strong> the Vegetable Oil RefinersAssociation, the Oil Mill Refiners Association,and the Major and Compact Flour Mill OwnersAssociation. International developmentpartners are represented by USAID, WFP,UNICEF, World Health Organization, theMicronutrient Initiative, and the InternationalCenter <strong>for</strong> Diarrheal Diseases and Research.A Technical Committee provides specializedsupport to NFA and its members. NFA held itsfirst meeting in April 2004.A rapid assessment conducted <strong>for</strong> thisstudy indicates that <strong>Bangladesh</strong> has thenecessary human and institutional capacityto implement food <strong>for</strong>tification on a nationalscale. However, available evidence suggeststhat while NFA partners are interested infood <strong>for</strong>tification, they will be unable to putthe program into action without technicalsupport. An integrated package <strong>of</strong> keytechnical-assistance interventions provided bythe Global Alliance <strong>for</strong> Improved Nutrition,USAID, and other donors would help createthe conditions <strong>for</strong> NFA partners to proceed.Technical-assistance interventions will beneeded to implement all five component <strong>of</strong>food <strong>for</strong>tification: production and distribution,including industrial implementation andquality assurance/control; food control,including legislation, inspection anden<strong>for</strong>cement, and program testing andmonitoring; communications and marketing;monitoring and evaluation; and programmanagement.In December 2003, NFA was <strong>for</strong>med,consisting <strong>of</strong> over 30 members from the18MOST The USAID Micronutrient <strong>Program</strong>
ReferencesReferences<strong>Bangladesh</strong> Bureau <strong>of</strong> Statistics. May 1999. Report <strong>of</strong> the Poverty Monitoring Survey. Dhaka,<strong>Bangladesh</strong>: Ministry <strong>of</strong> Planning, Statistics Division.______. December 2001. Household Income and Expenditure Survey - 2000.<strong>Food</strong> and Agriculture Organization. 2002. “<strong>Food</strong> Balance Sheets,” <strong>Bangladesh</strong>. Annual sheets<strong>for</strong> 1985-1999. (Available from www.fao.org.)Helen Keller International, Institute <strong>of</strong> Public Health and Nutrition. 2001. The NutritionalSurveillance Project in <strong>Bangladesh</strong> in 1999. Dhaka, <strong>Bangladesh</strong>.Jahan, Khursheed, and Mosharff Hossain. July 1998. Nature and Extent <strong>of</strong> Malnutrition in<strong>Bangladesh</strong>: <strong>Bangladesh</strong> <strong>National</strong> Nutrition Survey, 1995-96. Dhaka, <strong>Bangladesh</strong>: Institute <strong>of</strong>Nutrition and <strong>Food</strong> Science, University <strong>of</strong> DhakaMannan, Abdul, Mohammad, Mamunar Rashid, A.Z. Amanatullah, M. Eshaque Ali, and M.Shahjahan. 2002. Dhaka, <strong>Bangladesh</strong>: <strong>Bangladesh</strong> <strong>National</strong> Nutrition Council.Ministry <strong>of</strong> Finance, Economic Relations Division. March 2003. <strong>Bangladesh</strong>:A <strong>National</strong> Strategy<strong>for</strong> Economic Growth, Poverty Reduction and Social Development. Dhaka, <strong>Bangladesh</strong>:Government <strong>of</strong> the People’s Republic <strong>of</strong> <strong>Bangladesh</strong>.Ministry <strong>of</strong> Health and Family Welfare. 1997. Dhaka, <strong>Bangladesh</strong>: Government <strong>of</strong> the People’sRepublic <strong>of</strong> <strong>Bangladesh</strong>.Ministry <strong>of</strong> Health and Family Welfare, in Collaboration with the <strong>Bangladesh</strong> <strong>National</strong>Nutrition Council. 1997. <strong>Bangladesh</strong> <strong>National</strong> Plan <strong>of</strong> Action <strong>for</strong> Nutrition. Dhaka, <strong>Bangladesh</strong>:Government <strong>of</strong> <strong>Bangladesh</strong>Rassas, Bechir and James Fitch. July 2002. Wheat Flour <strong>Fortification</strong> in <strong>Bangladesh</strong>: CostAnalysis and Sustainability Considerations. Arlington, VA: MOST, The USAID Micronutrient<strong>Program</strong>.World Bank. 2002a. <strong>Bangladesh</strong>: Progress in Poverty Reduction. Background Paper, <strong>Bangladesh</strong>Development Forum, Paris, March 13-15, 2002. Washington, D.C.World Bank. 2002b. Poverty in <strong>Bangladesh</strong>: Building on Progress. Washington, D.C.: PovertyReduction and Economic Management Sector Unit, South Asia Region.World <strong>Food</strong> <strong>Program</strong>me. January 2004. <strong>Bangladesh</strong> <strong>Food</strong> Grain Digest. WFP-<strong>Bangladesh</strong>.______. December 2001. <strong>Bangladesh</strong> <strong>Food</strong> Grain Digest. WFP-<strong>Bangladesh</strong>.______. July 2000. Report on Market Survey <strong>of</strong> Flour Mills <strong>of</strong> <strong>Bangladesh</strong>. WFP-<strong>Bangladesh</strong>.<strong>Elements</strong> <strong>of</strong> a <strong>National</strong> <strong>Food</strong>-<strong>for</strong>tification <strong>Program</strong> <strong>for</strong> <strong>Bangladesh</strong>19
Annex TablesAnnex TablesAnnex A: Estimated Costs <strong>of</strong> Oil <strong>Fortification</strong> in <strong>Bangladesh</strong>CostCost ItemTKDollarAnnual CostsInvestment CostsPurchase price (blender) 1,160,000 20,000Handling, shipping, and insurance 46,400 800Total cost, CIF Chittagong 1,206,400 20,800Customs duty 69,600 1,200Customs clearance and handling in <strong>Bangladesh</strong> 24,128 416Subtotal cost, delivered to mill 1,300,128 22,416Local handling, installation, and training 195,019 3,362Total investment costs 1,495,147 25,778Annual investment costs 297,911 5,136Variable CostsOperating costs <strong>of</strong> equipmentMaintenance and repair 17,400 300Electric power 34,800 600Other operating costsLabor 14,280 246Internal Testing 522,000 9,000Outside testing 139,200 2,400Vitamin A 27,953,100 481,950Total variable costs 20,076,480 346,146<strong>Fortification</strong> Costs Per Metric TonAnnual capital Costs (depreciation & interest) 3.3 0.06Maintenance and repair 0.2 0.00Electric power 0.4 0.01labor 0.2 0.00Internal Testing 5.8 0.10Outside testing 1.5 0.03Vitamin A 215.2 3.71<strong>Fortification</strong> cost 223.3 3.85Key Parameters and AssumptionsItemUnitCustoms duty on imported equipment 6%Annual plant capacity90,000 MT/yearEquipment life10 yearsInterest rate 15%Annual Maintenance as a % <strong>of</strong> equipment costs 1.5%20 MOST The USAID Micronutrient <strong>Program</strong>
Annex TablesAnnex B: Estimated Costs <strong>of</strong> Wheat-Flour <strong>Fortification</strong> in <strong>Bangladesh</strong>CostCost ItemTKDollarAnnual CostsInvestment CostsPurchase price (buffer tank, flow rate control, etc.) 2,973,398 51,354Handling, shipping, and insurance 171,273 2,953Total cost, CIF Chittagong 3,144,572 54,312Customs duty 178,404 3,081Customs clearance, and handling in <strong>Bangladesh</strong> 59,468 1,086Subtotal cost, delivered to mill 3,382,544 58,480Local handling, installation, and training 342,479 5,915Total investment costs 3,725,022 64,395Annual investment costs 742,218 12,819Variable CostsOperating costs <strong>of</strong> equipmentMaintenance and repair 44,601 770Electric power 23,940 413Other operating costsLabor 28,800 497Internal Testing 521,100 9,000Outside testing 138,960 2,400Vitamin A 11,199,189 193,423Total variable costs 11,956,590 206,504<strong>Fortification</strong> Costs Per Metric TonAnnual capital Costs (depreciation and interest) 15.1 0.26Maintenance and repair 0.9 0.02Electric power 0.5 0.01labor 0.6 0.01Internal Testing 10.6 0.18Outside testing 2.8 0.05Vitamin A 263.7 4.55<strong>Fortification</strong> cost 294.2 5.07Key Parameters and AssumptionsItemUnitCustoms duty on imported equipment 6%Annual plant production <strong>of</strong> <strong>for</strong>tified flour49,000 MT/yearEquipment life10 yearsInterest rate 15%Annual Maintenance as a % <strong>of</strong> equipment costs 1.5%<strong>Elements</strong> <strong>of</strong> a <strong>National</strong> <strong>Food</strong>-<strong>for</strong>tification <strong>Program</strong> <strong>for</strong> <strong>Bangladesh</strong>21
Annex TablesAnnex C: Estimated Costs <strong>of</strong> Sugar <strong>Fortification</strong> in <strong>Bangladesh</strong>Cost ItemCostTKDollarAnnual CostsInvestment CostsPurchase price (mixer and feeder) 1,740,000 30,000Handling, shipping, and insurance 69,600 1,200Total cost, CIF Chittagong 1,809,600 31,200Customs duty 104,400 1,800Customs clearance and handling in <strong>Bangladesh</strong> 36,192 624Subtotal cost, delivered to mill 1,950,192 33,624Local handling, installation, and training 292,529 5,044Total investment costs 2,242,721 38,668Annual investment costs 446,867 7,705Variable CostsOperating costs <strong>of</strong> equipmentMaintenance and repair 26,100 450Electric power 52,200 900Other operating costsLabor 14,280 246Internal Testing 174,000 3,000Outside testing 38,667 667Premix 9,103,433 156,956Total variable costs 9,382,579 161,769<strong>Fortification</strong> Costs Per Metric TonAnnual capital Costs (depreciation & interest) 29.8 0.51Maintenance and repair 1.7 0.03Electric power 3.5 0.06labor 1.0 0.02Internal Testing 11.6 0.20Outside testing 2.6 0.04Premix 606.9 10.46<strong>Fortification</strong> cost 627.2 10.81Key Parameters & AssumptionsItemUnitCustoms duty on imported equipment 6%Annual plant capacity90,000 MT/yearEquipment life10 yearsInterest rate 15%Annual Maintenance as a % <strong>of</strong> equipment costs 1.5%22 MOST The USAID Micronutrient <strong>Program</strong>
<strong>Bangladesh</strong> has the necessary human and institutional capacity toimplement food <strong>for</strong>tification on a national scale. However, availableevidence suggests that while NFA partners are interested in food<strong>for</strong>tification, they will be unable to put the program into action withouttechnical support. An integrated package <strong>of</strong> key technical-assistanceinterventions provided by the Global Alliance <strong>for</strong> Improved Nutrition,USAID, and other donors would help create the conditions <strong>for</strong> NFApartners to proceed. Technical-assistance interventions will be neededto implement all five components <strong>of</strong> food <strong>for</strong>tification: production anddistribution, including industrial implementation and quality assurance/control; food control, including legislation, inspection and en<strong>for</strong>cement,and program testing and monitoring; communications and marketing;monitoring and evaluation; and program management.