Compendium of Surveys (to assess fruit and vegetable consumption)
Compendium of Surveys (to assess fruit and vegetable consumption)
Compendium of Surveys (to assess fruit and vegetable consumption)
- No tags were found...
Create successful ePaper yourself
Turn your PDF publications into a flip-book with our unique Google optimized e-Paper software.
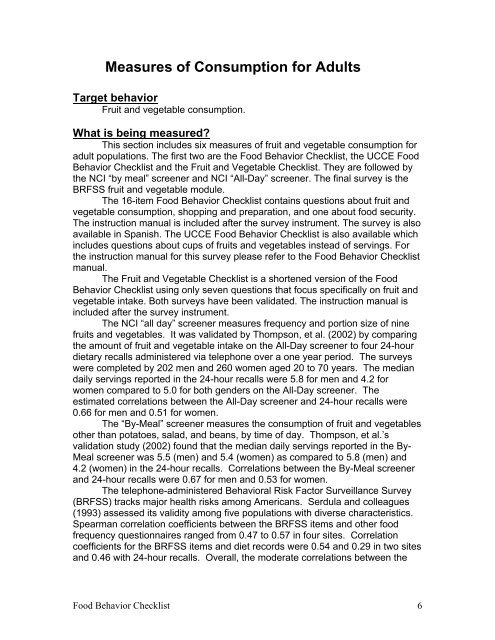
Measures <strong>of</strong> Consumption for AdultsTarget behaviorFruit <strong>and</strong> <strong>vegetable</strong> <strong>consumption</strong>.What is being measured?This section includes six measures <strong>of</strong> <strong>fruit</strong> <strong>and</strong> <strong>vegetable</strong> <strong>consumption</strong> foradult populations. The first two are the Food Behavior Checklist, the UCCE FoodBehavior Checklist <strong>and</strong> the Fruit <strong>and</strong> Vegetable Checklist. They are followed bythe NCI “by meal” screener <strong>and</strong> NCI “All-Day” screener. The final survey is theBRFSS <strong>fruit</strong> <strong>and</strong> <strong>vegetable</strong> module.The 16-item Food Behavior Checklist contains questions about <strong>fruit</strong> <strong>and</strong><strong>vegetable</strong> <strong>consumption</strong>, shopping <strong>and</strong> preparation, <strong>and</strong> one about food security.The instruction manual is included after the survey instrument. The survey is alsoavailable in Spanish. The UCCE Food Behavior Checklist is also available whichincludes questions about cups <strong>of</strong> <strong>fruit</strong>s <strong>and</strong> <strong>vegetable</strong>s instead <strong>of</strong> servings. Forthe instruction manual for this survey please refer <strong>to</strong> the Food Behavior Checklistmanual.The Fruit <strong>and</strong> Vegetable Checklist is a shortened version <strong>of</strong> the FoodBehavior Checklist using only seven questions that focus specifically on <strong>fruit</strong> <strong>and</strong><strong>vegetable</strong> intake. Both surveys have been validated. The instruction manual isincluded after the survey instrument.The NCI “all day” screener measures frequency <strong>and</strong> portion size <strong>of</strong> nine<strong>fruit</strong>s <strong>and</strong> <strong>vegetable</strong>s. It was validated by Thompson, et al. (2002) by comparingthe amount <strong>of</strong> <strong>fruit</strong> <strong>and</strong> <strong>vegetable</strong> intake on the All-Day screener <strong>to</strong> four 24-hourdietary recalls administered via telephone over a one year period. The surveyswere completed by 202 men <strong>and</strong> 260 women aged 20 <strong>to</strong> 70 years. The medi<strong>and</strong>aily servings reported in the 24-hour recalls were 5.8 for men <strong>and</strong> 4.2 forwomen compared <strong>to</strong> 5.0 for both genders on the All-Day screener. Theestimated correlations between the All-Day screener <strong>and</strong> 24-hour recalls were0.66 for men <strong>and</strong> 0.51 for women.The “By-Meal” screener measures the <strong>consumption</strong> <strong>of</strong> <strong>fruit</strong> <strong>and</strong> <strong>vegetable</strong>sother than pota<strong>to</strong>es, salad, <strong>and</strong> beans, by time <strong>of</strong> day. Thompson, et al.’svalidation study (2002) found that the median daily servings reported in the By-Meal screener was 5.5 (men) <strong>and</strong> 5.4 (women) as compared <strong>to</strong> 5.8 (men) <strong>and</strong>4.2 (women) in the 24-hour recalls. Correlations between the By-Meal screener<strong>and</strong> 24-hour recalls were 0.67 for men <strong>and</strong> 0.53 for women.The telephone-administered Behavioral Risk Fac<strong>to</strong>r Surveillance Survey(BRFSS) tracks major health risks among Americans. Serdula <strong>and</strong> colleagues(1993) <strong>assess</strong>ed its validity among five populations with diverse characteristics.Spearman correlation coefficients between the BRFSS items <strong>and</strong> other foodfrequency questionnaires ranged from 0.47 <strong>to</strong> 0.57 in four sites. Correlationcoefficients for the BRFSS items <strong>and</strong> diet records were 0.54 <strong>and</strong> 0.29 in two sites<strong>and</strong> 0.46 with 24-hour recalls. Overall, the moderate correlations between theFood Behavior Checklist 6


