Mascini1 - esonn
Mascini1 - esonn
Mascini1 - esonn
- No tags were found...

Create successful ePaper yourself
Turn your PDF publications into a flip-book with our unique Google optimized e-Paper software.
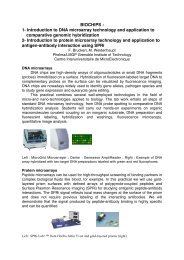
Trace measurements of pollutans(intercalators, binders of DNA) Hybridization indicator(bacteria , virus , genetic inherited diseases) Biosensing of drugs
Disposable electrochemical biosensors forthe detection of low molecular weightsubstances which show affinity with DNA Electrochemical DNA biosensors for thedetection of specific DNA sequences
Screen printed electrodes (SPE)Electric connectionsInsulating ink1 cmSilver pseudo-reference electrodeGraphite counter electrodeGraphite working electrodeAdvantages:• each electrode is disposable:no contamination• easy to produce and to use• low cost
Portable apparatus (PalmSens ® )The system is based on a screen printed electrochemical cell, and a PalmSens ® instrument for electrochemical analysis connected with a pocket PC.DNA biosensorStirrer platePalm Sens & pocket PCScreen printed electrodes
Potential driven adsorption:+0.5 V vs Ag-SPEPhosphate groupScreen printed electrode
Electrochemical procedure• Pretreatment: +1.6V for 120s and +1.8V for 60s, in 0.25M aceticbuffer (pH=4.75) with 10mM KCl, under stirred conditions.• DNA immobilisation: 50ppm of double stranded calf thymus DNA,+0.5 V for 120s, under stirred conditions.• Blank or sample interaction: 10µl of the sample solutions onto theworking electrode surface for 2 min.• Measurements: Square wave voltammetry in 0.25M acetic buffer(pH=4.75) with 10mM KClParameters: potential range from +0.2V to +1.45V Frequency= 200Hz , E step = 15 mV , E amplitude = 40 mV
Analytical signali (µA)2.251.500.75BlankAnalyteS bS sThe interaction of the DNAwith pollutant moleculesmodifies the oxidationof the DNA guanine baseGuanine OxidationE p = +1.0 V vs Ag-SPE0.000.2 0.4 0.6 0.8 1.0 1.2 1.4E (V)Genoxicity index:S guanine % = (S s / S b ) * 100S b: guanine peak after theinteraction with the blanksolutionS s: guanine peak after theinteraction with the sample
2-Naphthylamine and 2-Anthramineon dsDNA Calf Thymus biosensorNH 2NH 21201001008080R %6040R %6040202000 5 10 15 20 252-Naphthylamine (µM)00.0 0.4 0.8 1.2 1.62-Anthramine (µM)
Acridine orange on dsDNACalf Thymus biosensorNNN1000.4Phosphate buffer Guanine peakAcridine Orange 0.05 µMR %8060dt/dE (s/V)0.2Acridine Orange 0.10 µMAcridine Orange 0.20 µMAnalyte peak40200.0 0.1 0.2 0.3 0.4Analyte (µM)0.00.6 0.8 1.0 1.2E (V)
Standard compoundsDNA biosensorR %DNA biosensorR %2-Anthramine(0.077 g/ml)- 39 ± 10 %Stearylamine(13 µg/ml)-14 ± 3 %2-Anthramine(0.116 g/ml)- 56 ± 13 %Stearylamine(46 µg/ml)- 42 ± 6 %2-Anthramine(0.154 g/ml)- 67 ± 11 %Mix of polyethoxylates(0.1 µg/ml)- 9 ± 9 %1,2-Diaminoanthraquinone(0.019 µg/ml)- 49 ± 6 %Mix of sulfonates(1 µg/ml)- 23 ± 11 %1,2-Diaminoanthraquinone(0.039 µg/ml)- 86 ± 9 %Estradiol +Ethynylestradiol(0.0005 g/ml)- 37 ± 2 %2-Aminonaphtalene(0.82 µg/ml)- 39 ± 5 %2-Chlorophenol(10 g/ml)- 39 ± 11 %2-Aminonaphtalene(3.26 µg/ml)-68 ± 9 %4-nitroquinoline-N-oxide*(0.5 µg/ml)- 70 3 %Acridine orange(0.015 µg/ml)-20 ± 6 %4-nitroquinoline-N-oxide*(0.01 µg/ml)- 50 8 %Acridine orange(0.058 µg/ml)-62 ± 8 %N-methyl-N’-nitronitrosoguanidine(40 µg/ml)*- 20 10 %Mix of LAS(1 µg/ml)- 26 ± 5 %N-methyl-N’-nitronitrosoguanidine(4 µg/ml)*- 5 ± 3 %Mix of LAS(5 µg/ml) - 64 ± 7 %Carbaryl(0.002 g/ml)- 48 ± 7 %* Solution containing 1 % of DMSO
Bioluminescence as an indicator of toxicity: Toxalert® SystemLuminescent bacteria, e.g. Vibrio Fischeri NRRLB-11177, naturally emit light, calledbioluminescence. The enzyme involved is bacterial luciferase which catalyses the followingreaction: FMNH 2+ O2 + R-CO-H FMN + R-COOH + H 2O + LightBioluminescence is directly linked to the vitality, themetabolic status, of the cell. A toxic substance will causechanges to the cellular state which are rapidly reflected in adecrease in bioluminescence.The reduction of bioluminescence can be measured witha photomultiplier in a luminometer.
Cytotoxicity testReference method(ToxAlert 100, MERCK)Bioluminescent bacteria (Vibrio Fischeri):luciferaseFMNH 2 + O 2 + RCHO FMN + RCOOH + H 2 O + lightProcedure:( = 489 nm )Reconstitution of Liquid Dried Bacteria (15’)Preincubation of bacteria suspension ( 500 l; 15’)Measurement of luminescence; addiction of 500 l of sample solutionIncubation (30’)Measurement of the remaining luminescenceToxicity index: inhibitory effect (I %):I % 20I % =I b - I sI b·100Toxic sampleI b= Luminescence intensityin the blank solutionI s= Luminescence intensityin the sample solution
River water samples (Arno)Sample(1 liter)Filtering(0.45 m)SPE(C 18 )Eluition(AcOEt;NaCl 2 %)Preconcentration:160 timesI % (ToxAlert 100)100806040200ToxAlert 100DNA biosensor100806040200-R % (DNA biosensor)1 2 3 4 5 6 7 8 9Samples
Waste Water AnalysisFlorence Treatment Plants
Waste Water Samples : Influents100100I% (ToxAlert 100)80604020ToxAlert 10080604020- R% (DNA biosensor)DNA biosensor00 1 2 3 4 5 6 7 8 9010 11 12 13 14 15Raw influents
Role of DNA biosensors for RiskAssessment in marineenvironment Monitoring of DNA binding substances in– tissues or biological fluids of organisms not exposed to pollutants– tissues or biological fluids of organisms exposed to pollutants– organisms tissues or biological fluids spiked with pollutants Comparison with bio-markers (i.e. weight, growth of theorganisms) Comparison with other molecular bio-assays (i.e. Cometassay)
What are PAHs ?• Sources: incomplete combustion of organic material likecoal and oil; forest fires and volcanic eruptions.• PAHs and their metabolites, may intercalate betweenadjacent base pairs or may form DNA-adducts that cantrigger carcinogenic processes. Therefore, all PAHs aremutagenic and harmful to reproduction. The heavyPAHs (five to seven rings) in particular, are a majorcause of these chronic damages.• Due to their liposolubility they are absorbed fairly easilyby living organisms, and can be accumulated ortransformed into more toxic substances.• The detection of PAH metabolites in fish bile (organisms)can be used as a marker of recent exposure atcontaminated sites.
Analysis of PAHs metabolitesstandard solutions3-OH-Benzo [a] Pyrene1-OH-Benzo [a] Pyrene100100OH9090S%8070OHS%80706060500 2 4 6 8 103-OH-Benzo[a]Pyrene concentration (µg/mL)500 2 4 6 8 101-OH-Benzo[a]Pyrene concentration (µg/mL)
• Atlantic codFish species– Live chiefly in cold or temperate northern seas, atdephts of 180 - 360 m– Max lenght 1.5 m– Commercially important as food as the source ofcod-liver oil• Haddock– Same family of cod– Shorter– Very abundant in the North Atlantic Ocean, it
1) Karmøy island area, species:Atlantic codFish from six sea areas at different pollution levelsSamples diluted 1:5000 with acetic buffer 0.25M pH 4.75 + 1% EtOH1465Pollutionsource1009080Blank & referencePolluted samplesVery polluted samplesS%703N25KmN605000Blank 1 2 3 4 5 6Areas
FIELDSITEComparison with different testsTYPEOF SITEDNAbiosensorS %F-int 341/383Pyrene-like metab.(µg/mL bile) ¤Condition index(weight(g) xlenght(cm) -3 )x100 ¤Liversomatiticindex ¤1 Reference 100 699 52 Lowcontamin.3 Near aharbour4 Moderatecontamin.5 Highcontamin.6 Highcontamin.86 8 *83 7 *82 7 *75 1 *80 5 *86 1 *75 8 *72 8 *54 2 *55 6 *3.73.54.86.015.0 *17.7 *56.0 *61.0 *158.0 *154.0 *1175.0 *1049.0 *0.93 0.06 2.0 0.80.84 0.08 * 1.9 0.80.84 0.08 * 1.4 0.5 *0.89 0.07 1.7 0.80.85 0.08 * 1.8 1.40.76 0.12 * 1.2 0.3 *¤ Measured performed by Akvamiljø Centre (Randaberg, Norway)* Significantly different from reference site (1), P
2) Tampen area, species HaddockFish from two sea areas at different pollution levels, sampling in 2002Samples diluted 1:5000 with aceticbuffer 0.25M pH 4.75 + 1% EtOH1101009010090referenceexposedS %80706050S%8070604000blank reference exposed10 Km awayfrom TampenStatfjordoil field5040-- -- -- -- -- -- -- -- -- -- -- -- -- -- -- -- --fish bile samples
Analysis of real soil samples• ACNA Cengio (SV) soil, March 2003, different depths• Soil pretreatment– The same as described before• Extraction– 0.5g soil with 20mL solvent• acetic buffer 0.25M pH 4.7• phosphate buffer 25mM pH 7.4• ethanol 96%– Mix 2min, then ultrasonic bath 30 min X 2 (T 25°C)– Centrifuge 5000 r.p.m. 10 min (T 25°C)– Filtration with filters 0.45µmA l i ith DNAbi
Area Depth (cm)1 202 Superficial3 204 40ResultsExtract with acetic buffer 0.25M pH 4.75Extract with phosphate buffer 25mM pH 7.4Extract with ethanol 96%100431S %806024020BORMIDA RIVER0Blank 1 2 3 4Samples/areas ACNA
ConclusionElectrochemical DNA biosensor is a suitabletool to evidence the presence of compoundsof environmental interest in real samples.It is unable to distinguish single compoundsbut it could be useful for screening purposesto evaluate total toxicity of water samples.
DNA structure
Sequence-specific HybridisationBiosensorsHybridisation Biosensorsare used for identifying specific target sequencesdetermining the order of the four bases : A, C, G, and T.DNA base pairing represents the basis for suchhybridisation assays.
Applications of DNA BiosensorsThe detection of specific DNA sequences is of significance inmany areas including clinical, environmental and food analysis.The analysis of gene sequences and the study of genepolymorphisms play a fundamental role in rapid detection ofgenetic mutations, offering the possibility of performingreliable diagnosis even before any symptoms of a diseaseappear.In the environmental and food areas the detection of specificDNA sequences can be used for the detection of GeneticallyModified Organisms or Pathogenic bacteria.
Electrochemical GenosensorsDetermination of specific sequence od DNADetermination of the Promoter CaMV 35SHydentification of geneticallymodified organisms
Biosensor Assembly:Procedure for immobilization of DNA probe:Screen Printed Gold surfaceProbe (25-mer)1 µmol/L overnightHS-(CH 2) 6-5’-GGC-CAT-CGT-TGA-AGA-TGC-CTC-TGC-C-3’SS SS S SMCH (HS-(CH 2) 6-OH)1 mM for 1 hOHOHOHOHOHOHOHS S S S S S S S S S S S S
Measurement of the HybridizationReaction:OHOHOHOHOHOHOHOHSSSSSSGold electrode modifiedwith DNA/MCHS= Non elettroactiveP= ElettroactiveS P S P S PSSSSSHybridization (20 min)with biotinilated sequenceSOHSOH OHSSSOH OHSSOH OHSSSSOHInteraction withAlkaline Phosphatase-Streptavidin (20 min)ElectrochemicalmeasurementOHOHOHOHOHOH OHOHSIncubation withsubstrateOHOHOHOHOHOH OHOHSSSSSSSSSSS(20 min)SSSSSSSSSSS
OOPOHOHSubstrate:ALKALINEPHOSPHATASE-naphtyl phosphate(non elettroactive)PO 43-+OHProdoct:-naphtol(elettroactive)Differential Pulse Voltammetry (DPV) :i (µA)15.012.510.07.55.02.5Voltammetry:Ep = +0.2 V vs. Ag-SPESonda ProbeCompl. 200 nmol/LStep potential 0.005 VModulation amplitude: 0.070 VInterval time: 0.05 sModulation time 0.15 s0.00.0 0.1 0.2 0.3 0.4 0.5 0.6E (V)Scan potential: 0 V +0.60 V
Calibration Curve:i (µA)14121086420ComplementareNon-complementarei (µA)86420Experimental dataLinear fit0 10 20 30nmol/L0 200 400 600 800 1000 1200[Complementare]/(nmol/L)Linear range up to 25 nmol/LRiproducibility of the measurements (n=4): 12%Detection Limit: 0.25 nmol/LHigh selectivity for non complementary sequence
GMOs can be defined as organisms whose genome has been alteredin a way that does not occur naturally by mating or naturalrecombination.A gene cassette consists of a promoter (P), a codingregion and a terminator (T)PromoterCoding regionTerminatorGene cassetteIntroduction of foreign genes to produce novel proteins• Pest & disease tolerance•Improvement of the chemical profile
Officially established method on European scaleDetection of two regulatory sequences commonlyfound in transgenic plantsPromoter region (35S) of the CAMV(cauliflower mosaic virus) ribosomal RNANOS terminator of the nopalin synthase genefrom the soil bacterium Agrobacterium Tumefasciens
Base sequence of the PCR amplified productsPrimerPrimerSondagctcctacaaatgccatcatTGCGATAAAGGAAAGGCCATCGTTGAAGATGCCTCTGCCGACAGTGGTCCCAAAGATGGACCCCCACCCACGAGGAGCATCGTGGAAAAAGAAGACGTTCCAACCACGTCTTCAAAGCAAGTGGATTGATGTGATATCTCCACTGACGTAAGGGATgacgcacaatcccactatccPrimergaatcctgttgccggtcttgCGATGATTATCATATAATTTCTGTTGAATTACGTTAAGCATGTAATAATTAACATGTAATGCATGACGTTATTTATGAGATGGGTTTTTATGATTAGAGTCCCGCAATTATACATTTAATACGCGATAGAAAACAAAATAtagcgcgcaaactaggataaSonda35STNOSPrimer
Sequence 35S amplified with the PolimeraseChain reaction (PCR)The amplified probes are biotinilated in 5’ (obtained by biotinilated primers)TARGET : sequence of promoter CaMV 35S (195 bp) amplified from the plasmidepBI 121 extracted from E. Coli .Probe5’-GCT CCT ACA AAT GCC ATC ATT GCG ATA AAT GAA A GGC CAT CGT TGA AGA TGC CTCTGC C GAC AGT GGT CCC AAA GAT GGA CCC CAC CCA CGA GGA GCA TCG TGG AAA AAG AAGACG TTT CAA CCA CGT CTT CAA AGC AAG TGGATT GAT GTG ATA TCT CCA CTG ACG TAAGGG ATG ACG CAC AAT CCC ACT ATC-3’Negative Control: sequence biotinilated with the gene of lectine, 217bp
PROCEDURE for the ANALYSYS FOR AMPLIFIEDCleaning of the amplified (with columns of acetale membranes )Thermic denaturation : 5 min. a +100°C; 5 min a 0°CS S S
Results obtained with amplified samples:i (nA)17515012510075502500 20 40 60 80 100 120SampleConc.(nmol/L)Signal(nA)1 100 161152 100 149253 100 151154 100 15035 100 15111mix PCR - 163mix PCR - 131mix PCR - 112Neg. Control . 100 61Neg. Control 100 184Neg. Control. 100 105[P35S] /(nmol/L)2xSSC - 72Linearity in a wide range of concentrations (0-120 nM)Detection Limit (S/N=3) =15 nMHigh selectivity
AFFINITY BIOSENSORMolecularRecognitionTransductionAnalyticalSignalanalyteMOLECULAR RECOGNITION ELEMENTSBIOLOGICAL Antibodies Receptors Nucleic AcidsBIOMIMETIC Molecular ImprintedPolymers (MIP) Peptide Nucleic Acid (PNA) Oligopeptides Aptamers
APTAMERSAptamers are oligonucleotides that are identified through a combinatorialselection process for high affinity binding to target molecules. In theselection process, a combinatorial library of oligonucleotides is passedthrough a column containing the immobilized target.Those oligonucleotides that do not bind are discarded, while those thatbind are collected and amplified.This cycle is repeated several times until a small number of affinitybinders, or aptamers, have been isolated from the combinatorial pool.
APTAMERs Synthetic sequence (30-40 mer) of nucleic acids,single strand DNA or RNA, obtained by an in vitroselection (SELEX) Molecolar recognition higly selective for thestructures selected Possibility to obtain aptamers for a wide kind ofstructures Thermal stability and lifetime higher in comparisonwith protein receptors (antibodies) Any animal involved ;the procedure is suitable alsofor small molecole or any toxicants Time for obtaining : 2-3 months (v. monoclonalantibodies)
Constant SequenceConstantPromotor T7RegionrandomRegion5’ 3’DNA Library 1PCR 2dsDNA3a Separation8double strand Trascription 3bSeparation andAnalysisssDNA pool o RNA pool7RT-PCR/PCRSELEX Procedure(Systematic Evolution of Ligands by EXponentialenrichment)Incubation with the analyte target4ElutionRNA/ssDNA6Separation of the sequencesbound from free 5
The majority of aptamer structures result from intramolecular basepairing to produce loops or bulges, forming structures such as the hairpin,the pseudo knot, and the stem-loop/bulge. A different type of structuralmotif is the G-quartet, also known as “quadruplex”, “tetraplex” or“G4” DNA.A) Pseudoknot , b) G-Quartet, c) hairpin, d) stem-loop/bulgeFrom Anal. Chem. 1995, 664A
GOALCouple the advantages of aptamers (selectivity,amplifications) with Biosensors formatRealization of a Biosensor model with anAPTAMERtaken an aptamer from literatureanalyte of clinical interestspecific antibody , exploited as reference