Transactions A.S.M.E.
Transactions A.S.M.E.
Transactions A.S.M.E.
- No tags were found...

Create successful ePaper yourself
Turn your PDF publications into a flip-book with our unique Google optimized e-Paper software.
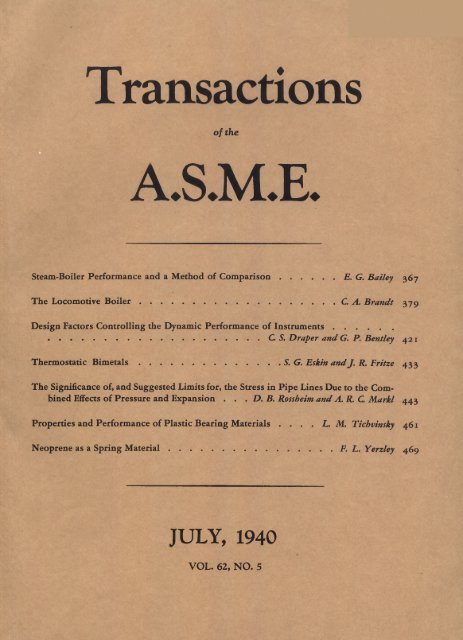
<strong>Transactions</strong>of theA.S.M.E.Steam-Boiler Perform ance and a M ethod of C o m p a r is o n ......................... E. G. B a iley 367T he Locom otive B o i l e r .......................................................................................... C. A . B r a n d t 379D esign Factors C ontrolling the D ynam ic Perform ance of I n s tr u m e n ts ..................................................................................................................................................... C. S. D ra p er a n d G. P. B entley 421Therm ostatic B i m e t a l s ................................................................. S. G. E skin a n d J . R. F ritze 433The Significance of, and Suggested Limits for, the Stress in Pipe Lines Due to the CombinedEffects of Pressure and Expansion . . . D . B. Rossbeim a n d A . R. C. M a r k l 443Properties and Perform ance of Plastic B earing M aterials . . . . L . M . T ichvinsky 461N eoprene as a Spring M a t e r i a l ............................................................................F. L . Y erzley 469JULY, 1940V O L . 62, N O . 5
<strong>Transactions</strong>of The American Society of Mechanical EngineersPublished on the tenth of every month, except March, June, September, and DecemberOFFICERS OF THE SOCIETY:W a r r e n H . M c B r y d b , PresidentW . D . E n n i s , TreasurerC. E . D a v i e s , SecretaryCOMMITTEE ONPUBLICATIONS:C o l e m a n S e l l e r s , 3 dC . B . P e c k , ChairmanC . R. S o d e r b e r oF. L. B r a d l e y A. R. S t e v e n s o n , J r .G e o r g e A. S t e t s o n , EditorADVISORYMEMBERS OF THE COMMITTEE ON PUBLICATIONS:W . L. D u d l e y , S e a t t l e , W a s h . A. N . G o d d a r d , D e t r o i t , M i c h . E . J . K a t e s , N ew Y o r k , N . Y»L. S. M a r k s , C a m b r i d g e , M a s s . J. M . T o d d , N e w O r l e a n s , L a . N . C . E b a u g h , G a i n e s v i l l e , F l a .Junior MembersC . C . K i r b y , N e w Y o r k , N . Y . H . B. F e r n a l d , J r . , N e w Y o r k , N . Y .P u b lish ed m onthly by T h e A m erican Society o f M echanical E ngineers. P u b lication office at 20th and N orth am pton Streets, Easton, Pa. T h e editorialdepartm ent located at th e headquarters o f th e Society, 2 9 W est T h irty-N in th Street, N ew Y ork , N . Y . C able address, ‘'D ynam ic,” N ew Y ork. P rice $ 1 .5 0a copy, $ 1 2 .0 0 a year; to m em b ers and affiliates, $ 1 .0 0 a cop y, $ 7 .5 0 a year. C hanges o f address m ust be received at Society headquarters tw o w eek s beforethey are to b e effective o n th e m a ilin g list. P lease send old as w ell as n ew a d d r e ss.. . . By-Law: T h e Society shall n ot be resp on sib le for statem ents or o p in io n s advanced in papers o r ------printed in its p ub lication s (B 1 3 , Par. 4 ) . . . . Entered as secon d -class matter M arch 2, 1928, at th e P o st Office at Easton, Pa.,under the Act o f A ugust 2 4 , 1912. . . . C opyrighted, 1 9 4 0 , by T h e A m erican Society o f M echanical Engineers.
Steam -B oiler P erform ance and aM ethod of C om p arisonBy E. G. BAILEY,1 NEW YORK, N. Y.T h is paper p r e se n ts d a ta from tw o m e th o d s o f d e te r m in ing rates o f h e a t a b so rp tio n in d ifferen t se c tio n s o f s te a m -boiler u n its . O ne b y d irect m e a su r e m e n t o f e v a p o ratio n ,first p u b lish e d in F ra n ce in 1874, d escrib in g F re n c h lo c o m o tiv e-b o iler te s t s , is com p a red w ith r ec en t d a ta o nm odern fu rn a ces u s in g th e g a s-te m p e r a tu r e -w e ig h tm e th o d . A m e th o d o f co m p a rin g d a ta fro m a ll ty p e s,kin d s, a n d sizes o f b o iler u n its a t diverse r a tes o f o u tp u t ispresen ted . It c o n sists briefly o f p lo ttin g “ h e a t abso rb ed ”in per c e n t o f to ta l h e a t a v a ila b le a g a in st “ e q u iv a len t su r face a rea ,” w h ic h r e s u lts in a ll p o in ts , h a v in g th e sa m e B tuavaila b le per sq f t per h r, b e in g o n t h e sa m e o r d in a te .R ep resen ta tiv e d a ta from m o d ern sta tio n a r y a n d m a r in eboilers are com p a red , to g e th e r w ith t h e d a ta fr o m th eF ren ch lo co m o tiv e-b o ile r t e s t s o f 65 y ears’ sta n d in g .D a ta o n v o lu m es o f fu r n a c e s a n d e n tir e b o iler u n its aregiven to g eth er w ith d raft lo sse s a n d e fficien cies.THE three branches of steam engineering—locomotive,marine, and stationary—have developed their individualterms with respect to rates of boiler output and performance.Some of these terms are becoming less significant due to varietiesof fuel, the addition of superheaters, economizers, air heaters, etc.However, there are common bases for comparison which can andshould be used in ways that will be universally applicable to allforms of fuel-burning and heat-absorbing equipment. One ofthe principal purposes of this paper is to present a method whichis believed to be of value, not only in comparing boilers of differenttypes, but also in comparing more accurately the relative resultsfrom similar boilers.As a basis for comparison with the modern locomotive boiler,which is being covered in another paper from the A.S.M.E. RailroadDivision,2 data are given in this paper on the performanceof present-day stationary boilers. Because of the great diversityof boiler types, a really comprehensive treatment of the subjecthas not been possible within the space limitations. However, it isbelieved that the most value can be obtained by giving performancedata from a few representative types of modern stationaryboilers, and presenting them in a form which may be readily comparedwith similar data from locomotive or other boilers.Ooal-burning locomotives are fired by hand or stoker and nonegreatly exceeds an output of 100,000 lb of steam per hr. Manylocomotives in the South and West are oil-fired. In order tomake the results more directly comparable, the stationary-boilerdata presented herewith are taken from boilers of a smaller sizethan is normally used in central-station practice and with workingpressures approaching those now used in locomotives.In addition to hand, stoker, and oil firing, one unit burningpulverized coal is included, since many stationary boilers arenow designed for burning pulverized coal, oil, or gas without anychange in the equipment. Some marine-boiler performance dataare also given to show wherein conditions aboard ship have influencedthe design and performance requirements.While boiler efficiency is the final basis of comparison, with acomplete heat balance to show7the distribution of heat losses inunburned fuel, stack gases, excess air, etc., it is of further importanceto know the distribution of heat absorbed by the boiler,superheater, economizer, and air heater and, from the surfaces ofeach, to know the average rates of heat absorption of these componentparts. The absorption of radiant heat in the furnace, theeffect of slag, cleanliness of heating surfaces, and the absorption ofheat in different parts of the boiler sections are also factors ofimportance in connection wTith the design of furnaces and boilers,as w’ell as in the operation of the fuel-burning and steam-generatingequipment. The latter information is not obtainable frompresent standard tests.M e t h o d s o f M e a s u r in g H e a t A b s o r p t io nAn interesting study of the rates of heat absorption in differentsections of the firebox and boiler tubes of a small locomotiveboiler was made between 1860 and 1864 by the Northern Railwayof France,3 where a boiler divided into five sections was builtand the evaporation was determined separately in each section.Another method of determining the rate of heat absorption indifferent sections of furnaces and boilers was described by theauthor in a previous paper4 before the Society. This methoddetermines heat absorption by measuring the furnace gas temperaturesand gas weights at consecutive stages in the travel ofthe gases, the difference in the heat content of the gases betweenany two points in the gas travel being the heat absorbed byradiation and convection by any surface between these points.R e s u l t s F r o m H e a t -A b s o r p t io n T e s t sA diagram of the French locomotive is shown in Fig. I.6 Thefirebox w7as 3 ft square at the grate, and there wyere 125 tubesabout l 7/g in. diam and 12 ft 4 in. long. The five divisions of theboiler were arranged for continuous gas flow and separate waterlevels were maintained. The evaporation from each section wasdetermined by a number of tests at different ratings. Threetests at the highest draft used have been selected for presentationand the essential data are given in Table 1. Tests A-l and A-2were made with briquettes and test A-3 with coke. Test A-2was run with half of the tubes plugged and the total evaporationwas about 87 per cent of that obtained in test A-l or at about 623“The Practical Physics of the Modern Steam Boiler," by F. J.1 Vioe-President, The Babcock & Wilcox Company. Mem. Rowan, D . Van Nostrand Co., N ew York, 1903, p. 143.A.S.M.E.“ Permanent W ay Rolling Stock and Technical Working of R ailways,” by C. H . F. Couche (translated from the French by J. N.* "The Locomotive Boiler,” by C. A. Brandt, Trans. A .S.M .E .,vol. 62, July, 1940, pp. 379-419.Shoolbred and J. E. W ilson), vol. 3, Dulau and Co., London, 1878.Contributed by the Power D ivision and presented at the Annual “Vaporisation Decroissante en Progression Geom etrique,” b y PaulMeeting, Philadelphia, Pa., December 4-8, 1939, of T h e A m e r i c a n Havrez, Annales du Genie Civil, vol. 3, 1874, pp. 520-528 and 545—S o c ie t y o f M e c h a n i c a l E n g i n e e r s .564.N o t e : Statements and opinions advanced in papers are t o be understoodas individual expressions of their authors, and not those vol. 61, Oct., 1939, pp. 561-569. Discussion, pp. 569-576.4 “ Modern Boiler Furnaces,” by E . G. Bailey, Trans. A .S.M .E .,of the Society.‘ Reproduced from reference (3), by F. J. Rowan, Fig. 69.367
368 TRANSACTIONS OF THE A.S.M.E. JULY, 1940T A B L E 1T E S T D A T A O N F IV E S E C T IO N S O F F R E N C H L O C O M O T IV E B O IL E R1 T E S T jA - / # - Z A - 32 £30/1 £7* F t 2 6 3 0 0 1 6 4 9 0 3 6 8 5 0A m »» 3 3 9 5 0 2 0 8 5 0 4 7 6 0 04 3 V O L U M E O P E / V r/ P E UP/T - CO . F T . 3 2 0 3 2 0 3 2 04 4 / T E M 2 7 P/V/D ED B Y / TE P 7 A 3 - 3 .Z U . /CL/. F T .P P . 3 6 5 0 0 3 1 7 0 0 2/61004 5 TOTP9L O P P F T LO SS - IP C P E S O F H t P F E P 3 .9 4 3 .9 4 . 3 . 9 44 7 O FEPF9/.L. J F F F / C / E P C Y - 7 2 .2 *7 2 .3 -7 2 .$® rsr/ M A tr* o e y o p p o p - c p a *b u / t / O P p ?p p /l -F i g . 1 D i a g r a m m a t i c A r r a n g e m e n t o p L o c o m o t i v e B o i l e r( N o r t h e r n R a i l w a y o f F r a n c e ) , S h o w i n g D i v i s i o n s o f H e a t i n gS u r f a c e a n d R e l a t i v e E v a p o r a t i o n F r o m E a c h D i v i s i o nF i g . 2ACTUAL HEATING SURFACE, SQ FT CUMULATIVE (ITEM 41)H e a t A b s o r p t i o n i n F r e n c h L o c o m o t i v e B o i l e r P l o t t e dA g a i n s t A c t u a l H e a t i n g S u r f a c e(B oiler of F ig. 1 and T able 1; tests A -l, A -2, and A-3.)per cent higher rate on a basis of heat available per sq ft of activeheating surface. With the same draft the coke gave a lower rateof evaporation. The heat absorbed, expressed as a percentage ofthe heat available for absorption, item 35, Table 1, is plotted inFig. 2 against cumulative actual heat-absorbing surfaces, item 41.No useful comparison of these fuels and rates of output can bereadily obtained from this plot because there is no way in whichthe rate of heat available or rate of heat absorption can begraphically indicated.Tests B-l and B-2 from Table 2 were obtained from the pulverized-coal-firedboiler of Fig. 3, rated at 100,000 lb of steam per hr.These tests are plotted in Fig. 4, which repeats test A-l, but to ascale suitable for plotting the B series. In this boiler the ash isremoved in a dry form by blowing it from the flat water-cooledfloor to the hopper at the end away from the burners. A certainamount of dry sponge ash accumulates on the water-cooled furnacewalls and roof, which are not normally cleaned; the ashreaches an equilibrium by falling by its own wreight from time totime in small amounts. The heat absorptions in the furnace andthe different sections of the boiler tube banks, item 32, wereobtained by the “gas-temperature-weight” method previouslyreferred to, a brief detailed description of which may be in order.Test data are taken which include items 4 to 27, inclusive, ofTable 2, the principal purpose being to determine the total heatinput, item 24; the total heat available, item 27; and the totalgas weight, item 20.The total heat available, item 27, is the total heat from thefuel actually burned, plus the heat in the preheated air above 80F, minus the latent heat in the moisture from the fuel and fromthe burning of hydrogen. In other words, it is the sensible heatin the gases of combustion which is available for absorption by
BAILEY—STEAM-BOILER PERFORMANCE AND A METHOD OF COMPARISON 369radiation and convection by any heating surface over which itmay pass.Another very important determination is item 30, wherein theaverage true gas temperature is obtained at different points in thepath of gases by means of the high-velocity thermocouple.6From these temperatures and the gas weights, the total heatabsorbed in each section, item 32, is determined.Item 36, Btu absorption per sq ft per hr for the different sectionsis also very interesting. The actual furnace heating surfaceis taken as the projected area or envelope of all water-cooled furnaceareas, with no factors for cleanliness or different kinds ofcooling surfaces except in the case of spaced tubes with refractorybehind or between, where Hottel factors7 are applied. Boiler,superheater, economizer, and air-heater heating surfaces are takenas the full tube circumference, plus any other exposed surfacesin contact with the actively flowing gases of combustion. Nofactors for tube arrangement, spacing, or mass flow are usedbecause it is thought best to keep all units on an actual area andBtu available basis and to study the comparative results for theeffect actually resulting from different forms of surface, fuel andash characteristics, values of excess air and mass flow, etc., as determinedfrom test data.Many other data and calculations are included in the completetest, but only the essential ones pertinent to this paper are includedin Table 2.s “ The Accurate M easurem ent of High Gas Temperatures,” byH . F. M ullikin, Power, vol. 78, 1934, p. 565. This high-velocitythermocouple is inserted into the gas stream at any desired point inthe furnace and, by an aspirator, gas is drawn across a shielded thermocoupleat a sufficiently high velocity to bring the couple close tothe true gas temperature, free from surrounding radiating influences.7 “Radiant H eat Transmission Between Surfaces Separated byNonabsorbing M edia,” by H . C. H ottel, Trans. A .S.M .E ., vol. 53,1931, FSP-53-19b, pp. 265-271. Discussion, pp. 271-273.F i o . 4 H e a t A b s o r p t i o n i n F r e n c h L o c o m o t iv e B o i l e r a n d i nP u l v e r i z e d - C o a l - F i r e d B o i l e r P l o t t e d A g a i n s t A c t u a l H e a t i n g S u r f a c e(B oiler of F ig. 3 and T able 2; testa B -l and B -2, also com p arative p lot ofcurve A -l from F ig. 2.)During test B-l, the boiler produced 105,900 lb of steam per hrand, during test B-2, 83,300 lb per hr. The higher rating testshows a lower percentage of heat absorbed, but there is no indicationfrom the plots themselves, as given in Fig. 4, as to the relativerates of output or the relative performance. Test A-l plottedon the same scale of actual surface is still further from being onany useful basis of comparison with the other two curves in Fig. 4,and yet all three curves are plotted on basic units of great significance;viz., actual heating surface and per cent of availableheat absorbed. Neither does one obtain any really satisfactorycomparison of the relative results from these boilers at the differentrates of output by examining all test data relating to them inTables 1 and 2.F i g . 3P u l v e r i z e d - C o a l - F i k e d B o i l e r f o r S t a t io n a r y S e r v i c eW i t h I n t e g r a l W a t e r - C o o l e d F u r n a c e(D ata given in T able 2.)C o m p a r i s o n o n E q u i v a l e n t - S u r f a c e - A r e a B a s i sIn Fig. 5 the heat-absorption percentages of tests B-l and B-2are plotted to “equivalent surface area” instead of actual area.This simple expedient brings into the diagram a rate-of-inputfactor. The corresponding points of the lower-input test areplotted at higher scale values of equivalent surface areas in orderto maintain relationship with tests of greater heat input such thatall curve intersections with a given ordinate line shall have thesame actual Btu available per sq ft value.This equivalent surface area is given as item 42 in all tables.It is obtained by using the factor resulting from dividing 500,000,-000 by the total Btu available for absorption, item 27, on anytest regardless of the size of boiler unit or its rating, and thenmultiplying this factor by the actual area in sq ft of all cumulative
370TRANSACTIONS OF THE A.S.M.E. JULY, 1940T A B L E 2T E S T D A T A O N P U L V E R IZ E D -C O A L -F IR E D A N Dsurface, item 41, under consideration, including the water-cooledportion of the furnace, and each successive additional portion ofheating surface to include boiler tube bank, superheater, economizer,and air heater if present. Each cumulative actual area,item 41, should be multiplied by this factor and plotted as equivalentsurface area, item 42, against the total percentage of heatabsorbed, item 35, by the corresponding actual surface area.The arbitrary value of 500,000,000 Btu available per hr wastaken after much consideration. It is a nominal value correspondingto many central-station boiler units. Some are muchlarger and many are smaller. It really makes no essential differenceso long as the same unit is used as a standard for all boilers tobe compared. It is hoped that others applying this basis of comparisonwill use this same standard for the sake of uniformity. Aunit actually operating at 500,000,000 Btu available input per hrwill be plotted with the actual surfaces equal to the equivalentsurfaces because the factor is unity.When comparing tests at different ratings on the same boiler,or any tests on any boiler, it is apparent that all cases at a givenvalue of equivalent surface have identical Btu available per sq ftof the total surface up to that point. If the percentage of heatabsorbed is not the same, it may be due to the cleanliness oreffectiveness of the surfaces passed over, the temperature, luminosity,or mass flow of the gases or other factors, some of whichmay not be known or predictable without further study or tests.One may easily determine the Btu available and the Btu absorbed, , , . 500,000,000per sq ft per hr for any point on any curve, viz., ------------------Equiv surface= Btu available per sq ft per hr. This result multiplied by theper cent absorbed gives the average Btu absorbed per sq ft perhr for all surface cumulatively from the fuel bed or burner up tothe point selected on the curve. For illustration test B-l, Fig. 5,the entrance to the superheater lies on approximately 10,000equivalent surface, and therefore corresponds to 50,000 Btu availableper sq ft per hr. The percentage absorbed is plotted at 52.3,hence the average rate of heat absorption up to this point is
BAILEY—STEAM-BOILER PERFORMANCE AND A METHOD OF COMPARISON 371ON OIL-FIRED STATIONARY BOILERS26,150 Btu per sq ft per hr. The slope of the curve at any individualsection is a graphic index of the rate of heat absorptionin that section.In Fig. 5, test B-l shows 89.5 per cent of the available heat absorbedup to the outlet of the air heater which has an equivalentsurface area of 86,200 sq ft. Test B-2 shows only 86.8 per centheat absorbed at the same equivalent area; this corresponds to apoint including all surface of the unit up to the entranceof the air heater plus about 46 per cent of thearea of the air heater. However, as the gases passcompletely through the air heater, the heat absorbedincreases to 90.3 per cent, but the equivalent surfacearea is 112,600 sq ft, although the actual heatingsurface is the same as on the other test. At thesame actual stages in the boiler unit, test B-2 showshigher percentages of heat absorption than the higherrating test B-l. This difference increases from 1.4per cent leaving the furnace to 3.3 per cent enteringthe superheater and 4 per cent leaving the superheater,and then diminishes to 1.5 per cent enteringthe air heater and 0.8 per cent leaving the air heater.These are all taken from item 35 by subtracting thecorresponding percentages from the two tests. Thisindicates that the first boiler tube bank and thesuperheater are more responsive to increased heatabsorption due to increased heat input because ofthe temperature and mass-flow factors. The adiabaticor theoretical maximum combustion temperatureof test B-2 is higher than on test B-l, hencethis will account for some of the difference in heatabsorbed in the furnace.The total heat absorbed by the B-l and B-2 testsis about 90 per Cent and may seem unduly high, butit must be remembered that this is on a Btu availablebasis, which is more nearly like the net or lowheating value often used abroad. The over-all efficiencyof the unit by the A.S.M.E. method is shownas item 47 and plotted on the curves as a droppoint under the last point on the available basis.C o m p a r is o n o f R e s u l t s a n d B o il e b sThe French locomotive tests are plotted on theequivalent-surface-area basis in Fig. 6. One cannothelp but grasp immediately a realization of the differencebetween tests A-l and A-2 due to the higher mass flow and betterheat absorption resulting from plugging half of the tubes. Theremay also have been a lower excess air and higher adiabatic temperaturein the firebox of test A-l, as it indicates a higher percentageof heat absorbed in the furnace, contrary to the relationshipat the corresponding points of Fig. 5.F i g . 6H e a t A b s o r p t io n P l o t t e d A g a in s t E q u iv a l e n t S u r f a c eA r e a(Boiler of F ig. 1 and T able 1; testa A -l, A -2, and A-3.)F i g . 7 H e a t A b s o r p t i o n P l o t t e d A g a i n s t E q u i v a l e n t S u r f a c eA r e a ; O i l - F i r e d B o i l e r(B oiler sim ilar to Fig. 3, d ata given in T able 2; tests C -l and C -2. Forlegend see Fig. 10.)
372TRANSACTIONS OF THE A.S.M.E. JULY, 1940T A B L E 3D A T A F R O M E L E V E N B O IL E R T E S T S M A D E A C C O R D IN G TOF i g . 8S t o k e r - F i r e d M a b i n e B o i l e r(D a ta given in T ab le 3.)F i g . 9O i l - F i r e d M a r i n e B o i l e r(D ata given in T able 3.)
BAILEY—STEAM-BOILER PERFORMANCE AND A METHOD OF COMPARISON 373C O N V E N T IO N A L S T A N D A R D T E S T M E T H O D SIn comparing tests A-l and A-3, it is noted that, even thoughthe rate of heat available is lower on coke-burning test A-3, thepercentage of heat absorbed is less, while normally it would begreater. This again may be due to a lower adiabatic temperature,resulting from either higher excess air or perhaps unburned CO,which might have been very likely when burning coke. Anotherfactor is luminosity, as the coke would have been different fromthe briquettes. Many desirable data are lacking from these tests.Tests A-l and B-l are shown in Fig. 10 on the equivalent-surface-areabasis. It is noted how much more useful is such comparisonin contrast to that in Fig. 4, where they are both on theactual area basis.A boiler similar to that of Fig. 3, but fired with oil, was tested bythe gas-temperature-weight method and the essential data aregiven in Table 2 and plotted in Fig. 7. Characteristics similar tothe pulverized-coal-fired tests B-l and B-2 are noted, i.e., theheat absorbed at the lower rate of input tests C-2 are higher thanon C-l for corresponding locations, but lower on the same equivalent-surface-areabasis.The greater heat absorption in the oil-fired furnace, due largelyto cleaner furnace walls, is brought out in Fig. 10, where curvesB-l, coal-fired, and C-l, oil-fired, are plotted to the same equivalent-surface-areabasis. The greatest difference is shown in thefurnace, first boiler tube bank, and superheater. Beyond thesuperheater, the curves are substantially parallel, indicatingabout the same rates of heat transfer. The coal-fired boiler isoperating at a 14 per cent lower Btu available per sq ft of totalsurface, and is 0.8 per cent lower in the percentage of availableheat absorbed but is 0.3 per cent higher in over-all efficiency.The French locomotive test A-l follows the pulverized-coalfiredtest B-l very closely, until the superheater is reached on B-lwhere it has a steeper slope and higher percentage rate of heatabsorption between the 10,000 and 20,000 equivalent surface area.However, it loses out between the 20,000 and 32,000 equivalentsurface area, where evidently the mass flow in the boiler tubebank is not as good as in the last two sections of the French locomotive.It is also noted that the saturation temperature ofsteam in the French boiler is 324 F, while in B-l tests the saturationtemperature is 498 F, causing an appreciable difference inthe rate of heat absorption at these corresponding parts of theunits.The discussion so far has related to two kinds of boilers of threedifferent sizes and with three methods of firing, hand, pulverizedcoal, and oil. Data from two methods of determining rates ofheat absorption in different sections of the heating surface havebeen compared by a method which seems to have much value.Table 3 includes data from eleven additional tests, the databeing limited to the conventional standard test method. Certaindata from these tests are plotted in Fig. 10 to show the percentageof available heat absorbed by the boiler and also by the economizerand air heater separately, where installed, and plottedagainst equivalent surface areas for comparison with the more
374 TRANSACTIONS OF THE A.S.M.E. JULY, 1940complete tests of the A, B, and C series and with each other.This is done because it is believed to be the best known methodfor obtaining a comprehensive picture of the relative ratings andefficiencies of some representative units in the marine and stationaryfields.M a r i n e B o i l e r sA typical marine boiler with spreader stoker for coal firingis shown in Fig. 8. It has a rated capacity of 13,000 lb of steamper hr at 400 lb pressure and 750 F. Two tests are given inTable 3 as E-l and E-2 and are plotted in Fig. 10. While theboiler itself shows relatively low efficiency at lower rates of heatavailable than others plotted, it is designed with an economizerand air heater to give very good final efficiency.Tests D-l and D-2 are from an oil-fired marine boiler similarto Fig. 8, but of 22,000-lb capacity at 600-lb pressure and 850 Fsteam temperature. It is designed for high efficiency from theboiler itself and has an air heater also. It has less equivalentsurface, smaller cubical content, and operates at higher draft lossthan the stoker-fired marine boiler, and was operated at lowerexcess air.Another marine boiler for Navy use is shown in Fig. 9. Someof the data published by Brierly* are reproduced as tests F-l to F-4in Table 3. This boiler is rated at 67,000 lb of steam per hr at 600-lb pressure and 700 F, but the tests reported are at 300-lb pressureto be more nearly comparable with present locomotive practice.As no sectional heat absorptions were obtained, only the over-allabsorption by the boiler and superheater combined are plotted astriangles in Fig. 10. Even this serves well to show that this highdutyboiler has very good efficiency. It shows about 10 per centbetter absorption of available heat than does the French locomotiveboiler at the same high relative rating of about 15,000 Btuavailable per sq ft of total surface per hr. This is undoubtedlydue largely to the better arrangement of heating surface and gasmassflow as indicated by the higher draft loss. It is significantto note the uniformly high efficiency at the wide range of outputs.Tests on the boiler at 600-lb steam pressure show about IV2 percent lower efficiency than those given for 300 lb pressure, due tothe difference in the saturation temperature of the heat-receivingsurface.Tests G and H are presented as representative of small stokerfiredstationary boilers of different types, design not shown.Test G-l has an air heater which shows a comparable rate of heatabsorption with other air heaters within the same available heatraterange.C o m p a r i s o n o f S i z e , R a t i n g , a n d D r a f t L o s sSeveral items which may be of interest in comparison withlocomotive boilers or others are given in the tables but are notspecifically discussed in this paper. Coal burned per sq ft ofgrate is given and, in order to enable a comparison with oil andpulverized fuel to be drawn, the equivalent cross-sectional areasof the respective furnaces are given and also the lb fuel per hrdivided by this area.Btu per cu ft of furnace volume is also given, but it should beremembered that this is a very misleading factor when comparingfurnaces of widely different size, even when burning the same kindof fuel. The total cubical contents of the boiler, including theoutside dimensions of the casing, economizer, and air heater, maybe of interest to some.Higher draft loss results from higher gas velocities, which arenecessary if saving in space and the increasing of rates of heatabsorption by convection are to be attained. All arrangements8 “The Babcock & W ilcox High-Pressure Sectional Express B oiler,”by Lieut-Com. R . C. Brierly, U .S .N .R ., Journal of the AmericanSociety of Naval Engineers, vol. 43, no. 4, N ov., 1931, pp. 511-561.of heating surface are not equally effective, and no conclusions arenow attempted from the small amount of data given.S u m m a r y1 It is very desirable to know the actual rates of heat absorptionin different elements of a boiler unit for the purpose of comparingeffects of different rates of operation, different values ofexcess air, kinds of fuel, ash and slag behavior, and kinds of heatabsorbingsurface.2 The direct method of measuring heat absorption byevaporation calls for segregation of heat-absorbing surface whichis either very difficult or entirely impossible, due to boiler constructionand interference with circulation. The engineers of theNorthern Railway of France deserve great credit for having donea very good piece of test work which checks very well with laterwork by other methods. The heat absorbed in some parts of aboiler unit may readily be determined by the direct method, suchas in the case of superheaters, some economizers, and air heaters.3 A second method is possible, wherein the heat absorbed in asection of the boiler unit, such as the furnace or a tube bank,results from calculation using average gas temperatures and gasweights entering and leaving the section, the difference, allowingfor any combustion of fuel taking place within the zone beingmeasured, being the heat absorbed.4 Data obtained by either method is useful to engineers experiencedin calculating boiler performance, but others often findit difficult to grasp an accurate and complete realization of therelative importance and comparisons of different parts of a boilerunit or one with another. A simple method of comparison ispresented which consists of plotting a curve showing the relationbetween the heat absorbed, expressed in per cent of heat available,and the equivalent surface area wherein the heat wasabsorbed.5 The data presented have been restricted to relatively smallstationary boilers which would be comparable with representativemarine boilers, two of which are given, and modern locomotiveboilers, data from which are available from another paper.2These limited data are not sufficient to draw many conclusionsregarding the factors of heat transfer by radiation and convection;however, some well-known facts are clearly demonstratedas being of outstanding significance when presented in thisgraphic form:(а) Radiant heat produces high rates of heat transfer, asshown by the steep slope of the curve.(б) Excess air and adiabatic temperature affect radiant heatgreatly. This point is not fully brought out in this paper,because for the purpose of simplicity, furnace tests wereselected with reasonably uniform adiabatic temperatures.(c) High mass flow and high mean temperature difference increaserates of heat transfer. Draft loss, and fan poweror its equivalent, are necessary to produce high rates ofheat absorption by convection, and high efficiencies withlimited surface areas.(id) Surface is the principal requisite for heat absorption. Itshould be clean for high rates of heat absorption, butsometimes a covering of ash, slag, or other means is a desirableaid toward complete combustion and for protectionagainst too high a rate of heat absorption and to passhigher temperatures on to other surfaces such as superheaters,which will bring the total absorption to a moreeconomical result.(e) Terms like Btu per cu ft per hr of furnace volume, Btu perfront ft of furnace width, etc., should be used with caution,because they are not as fundamental in their importanceas are some other factors. Pounds of oil per sq ft of
BAILEY—STEAM-BOILER PERFORMANCE AND A METHOD OF COMPARISON 375boiler is a basically sound standard, much used in marineengineering, but it becomes less useful with the further useof furnace cooling, economizers, and air heaters. Btuavailable per sq ft per hr seems to be fundamentallysound, but it needs definition as to its application tofurnace alone or to the entire unit. Item 29, Table 2,gives this factor for each cumulative section of the boilerunit. It seems now that this value, including all surfaceup to the entrance of the superheater, is likely to becomemore used. It also is useful when applied to the furnacealone.6 Temperature of gases as measured at different points in thegas path is of great importance regardless of whether these temperaturesare used in conjunction with gas weights to obtain heatabsorption. A knowledge of temperatures at various points ofthe entire unit is essential in design and is useful in operation inconnection with the behavior of ash and slag. The gas temperaturemight well be plotted to the equivalent surface area for comparison,but the excess air and air leakage at different points interferewith the same usefulness as is obtained from the heatabsorbedbasis herein presented, hence in the interest of brevityfor this paper such plots are omitted. Gas temperatures aregiven in the tables as item 30, and the adiabatic temperature asitem 23. The adiabatic or theoretical temperature is useful asan index of the combined effect of excess air, moisture in fuel, andcompleteness of combustion.7 Heat absorbed and equivalent surface are undoubtedlythe most important basic factors for comparison in studyingboiler performance.A c k n o w l e d g m e n tAcknowledgment is made for valuable data and assistance fromstoker manufacturers and from the author’s associates.DiscussionJ. C. H o b b s .9 Mr. Bailey’s use of the French tests illustratesclearly the relations between cause and effect. Each part ofthe steam-generating equipment being set up independently, therecan be no question about the heat transfer and the work done.The curves show clearly not only the relationships indicated,but the slope of the curves, i.e., the increment heat absorbed bythe increment heating surface, shows the punishment, if youplease, being carried by the heating surfaces comprising differentparts of the equipment.The writer wishes to emphasize by brevity rather than byvoluminous discussion, the great value of a uniform distributionof energy absorption over the entire surfaces in so far as it is possible,so that the apparatus may be more reliable and in the longrun the operation more successful.R. S. Julsrud.10 It would appear from the writer’s personalexperience, that designers of steam-generating equipment, in theireffort to secure a high efficiency in restricted furnace cavities firedby pulverized coal, are apt to lose sight of the physical and chemicallimitations of the coal which makes available this heat.Most coals have certain limitations; these may include lowfusion temperature, generally resulting from high sulphur presentin the fuel. Again high volatile content may result in cokingand possible burning of the tips of pulverized-coal burners andextremely long flame travel with resultant high temperatures en9 Vice-President in Charge of M anufacturing, Diam ond AlkaliCompany, Painesville, Ohio. M em . A .S.M .E .10 Combustion Engineer, Consolidation Coal Com pany, N ew York,N . Y .tering the convection surfaces. Also, low-volatile coals presentthe problem of maintaining ignition at low heat-output rates.Our knowledge of heat-transfer rates to water-cooled surfaces,both bare and refractory-covered when relatively clean, is nowfairly well established. However, when such surfaces have becomecovered with slag, whether fluid, sticky, or spongy, the heatabsorption of the surfaces is considerably reduced, and instead ofthe predicted heat extraction taking place from the gases in thefurnace, they enter the convection surface at considerably highertemperatures which may exceed the fusion point of the ash particlespresent in the gases. The result is a tendency for thesesticky ash particles to build up at the heating surfaces. If thisoccurs on surfaces with restricted gas passages, the result is pluggingof the gas passages and eventual outage of the unit. Againthe presence of sulphur in coal, resulting in the formation of ferricsulphides when burned, may in furnaces operated at high heatliberation and temperatures result in a reducing atmosphere. Itis also possible, but has not as yet been established, that reducingaction of these pyrites results in attacking the surfaces exposed tothis action. In any event, under high heat liberations these surfacestend to wash and eventually fail. This action results inboiler outage and increased maintenance costs.To attempt to reduce these failures, the surfaces are often builtup to a greater thickness with a resultant lower heat-transfer rateand the possibility of high gas temperatures entering the generatingtubes, as mentioned. Thus in eliminating difficulty in thefurnace, it may be transferred to the convection surfaces.Until such time as we have a better knowledge of the heat absorptionof water-cooled surfaces when coated with ash in itsvarious forms, it would appear that a greater degree of conservatismshould be exercised in the design of these units.A reduction of 1 per cent in the CO2at the boiler outlet will resultin approximately 200 F drop in the furnace-gas temperatures.This may mean the difference between high furnace maintenanceand outage as against continuous performance with somewhatlower efficiency. Moreover, high heat releases per cubic foot offurnace volume, which is a measure of furnace temperatures developed,can well be reduced for the same reason.Such a design would make available to the consumer a widevariety of coals, attractively priced, now handicapped by theirphysical and chemical limitations.E. B. P o w e l l . 11 The author has made available an astonishinglysimple, logical, and direct method of graphic comparisonfor evaluating heating-surface effectiveness. The writer wouldurge that he eliminate at once the only suggestion of complexity,i.e., the factor 500,000,000. Steam boilers of 500,000,000Btu per hr input rate will soon be outmoded. The method ofheating-surface analysis in this paper will serve for years to come.With such repetitive use certainly ahead, why not immediatelyeliminate all unnecessary effort, even that of dividing by 2, andadopt a more rational, permanently acceptable multiplier, 108 or109. Also, to assure instantaneous interpretation of the chart,Fig. 10, the writer suggests that the term “equivalent surface”be defined merely as the square feet of surface per Btu of totalheat liberated or made available to the steam-generating unit,per hour, with a factor of 10® or 109 applied to the quotient tosecure a number of convenient size. Furthermore, it is suggestedthat this formula, abbreviated, should be consistently includedin the title of the abscissas.In the closing paragraph, the author, in mentioning a deficiencyof data for certain interpretative purposes, would seem to promisea subsequent paper discussing the influence of such factors asdraft loss and arrangement of heating surface upon heat-transfer11 Consulting Engineer, Stone & W ebster Engineering Corporation,B oston, Mass. M em . A .S.M .E .
376 TRANSACTIONS OF THE A.S.M.E. JULY, 1940effectiveness. The writer trusts he is correct in this inference.The author’s clarifying treatment of all factors in steam-generating-unitheat transfer would be a tremendous asset.In closing, it would be of interest to know whether correctionswere applied to observed temperatures in order to allow for possibleradiation error of the high-velocity thermocouple.R. A . S h e r m a n . 12 A knowledge of the performace of the varioussections of a steam generator is essential to intelligent designfor proper distribution of the heating surface to insure that thetemperatures in various sections are of the proper order. Therate of heat absorption in the furnace governs the temperature ofthe gases which, for coal-fired furnaces, fixes the degree of fusionof the ash and, therefore, the type of coal which can be burned ina given furnace or the maximum rate of burning, or minimum excessair that can be maintained with a given furnace.The Society is indebted to the author for the presentation ofthe data which he has obtained by gas-temperature measurements,as these permit an analysis of the performance of varioussections of a boiler which would otherwise be impossible.The writer wishes to emphasize the fact brought out by the authorthat the expression, “Btu per cu ft per hr” isof no significanceiki comparing the performance of various boilers or of furnace temperatures.Earlier in the year, at Battelle Memorial Institute,we conducted an investigation which indicated that the same expressionhad no significance in relation to the smoke emission.By a factual survey of 102 power and heating boilers burning upto 1200 lb of coal per hr, and in an experimental investigation of22 boilers of the same type, no relation was found between thesmoke emitted and the rate of heat liberation per cubic foot offurnace volume. Briefly, this may be explained by several facts:1 It is the time of travel of the gases from the fuel bed to theentrance to the heating surface which determines whether thecarbon will be burned before its temperature is lowered below itsignition temperature. Furnaces have volume because they havethree dimensions but it is the length of travel which is important.Further, a large part of the volume is frequently not utilized and alarge volume is not a definite assurance that the carbon will beburned.2 Combustion of volatile matter without the liberation of carbonis rapid if the required air is mixed with the volatile and, withgood mixing, little time or volume will be required for smokelesscombustion. Without good mixing an infinite volume or lengthof flame travel will not avoid smoke.3 Still other factors, in addition to the degree of mixing, suchas the type of coal, the uniformity of distribution of the coal onthe stoker, the excess air, the type of load, and the degree of intelligenceand the ability of the operator are of greater importancein the elimination of smoke than the rate of heat liberation.To return to the author’s data, a retabulation of a few of theitems given for boilers A, B, and C will emphasize the lack ofmeaning of the rate of heat liberation per cubic foot of furnacevolume. The tabulation is as follows:B o ile r .................................................. .. A B CT y p e ...............................................................L ocom otive C oal OilF u rnace volum e, cu f t ........................... 33 6030 7494F u rnace h eatin g surface, sq f t ............. 7 6 .8 1695 1633R atio, su r fa ce/v o lu m e........................... 2 .3 3 0 .2 8 0 .2 1H e a t release, B tu per cu ft per h r .. . . 354000 22500 27800H e a t release, B tu per sq ft per h r . . . . 152200 79900 127200H eat absorbed, B tu per sq ft per h r. 44900 33200 55400Judged from the relative rates of heat release per cubic foot offurnace volume in the locomotive and in the other two boilers, thetemperatures might have ,been thought excessive in the locomotiveboiler but, because of the high ratio of heating surface in the fur-12 Supervisor, Fuels D ivision, B attelle M emorial Institute, Columbus,Ohio. M em . A .S.M .E .nace walls to the total volume, the rate of heat absorption washigh and the temperatures were probably no higher than in theother boilers. On the basis of the rates of heat liberation persquare foot of furnace wall, the differences among the threeboilers were much less and the rates of heat absorption per squarefoot of furnace wall were also of much the same order.Basing the comparisons of boilers on the ratio of the heating surfaceto the heat available will bring various boilers more into linebut variations will be due, as the author points out, to cleanlinessof the surface and to the luminosity and emissivity of the flame.The emissivity of a flame increases as its depth increases owing togreater furnace dimensions, but the emission per square foot offlame surface cannot increase in the same order as the area decreaseswith respect to the volume.A spherical furnace would be the least desirable shape of furnacebecause this gives the lowest ratio of surface to volume. Thecubical box-like furnaces which we have in many present-day furnacesare also unfavorable for obtaining a large area of heat-absorbingsurface. High, narrow furnaces are more favorable inpresentation of surface; this principle can be extended by introductionof division walls of water tubes to obtain greater surfaceand lower the furnace temperature.The adoption of the author’s method of obtaining data on temperaturesand gas weights by many other w'orkers would be desirable.Further studies on the relation of the radiant emissionfrom the flame to the dimensions of the furnace would also bevaluable.The writer agrees with a previous suggestion that the term“equivalent surface area” be replaced by the expression, “ratio ofsurface area to heat available,” multiplied by a simple factor suchas 106 on the ground that this is a more accurate expression andless likely to introduce confusion. Let us hope that we can markthis day as that on which the interment of the term, “Btu per cuft of furnace volume,” was completed, never to rise again.J ohn Van Brunt.13 The method suggested by the author forcomparing performance of furnaces, boilers, superheaters, economizers,and air heaters, comprising a complete steam-generatingunit, is interesting and the selection of a unit of 500,000,000 Btuinput for such comparisons serves the purpose perhaps as well asany other arbitrary value.In the design of large steam-generating units it is necessary todetermine the amount of heat absorbed by each portion of theentire unit by using actual fluid quantities and heat-transfer rates,etc. After such a unit is in operation, it is customary to checkthe calculated performance, and the basic design rates used forits determination.The amount of heat to be absorbed by each division of the totalsurface is determined by the performance requirements and theconditions imposed by the purchaser and by the economic factorsof each case, plus limitations dictated by the fuel characteristicsand factors governing availability of the unit for continuous operation.Given two units, for example, of 100,000 and 300,000 lb capacity,the smaller for 300 lb per sq in. pressure and 750 F steamtemperature with 250 F feedwater, and the larger for 1200 lbpressure, 925 F steam temperature with 380 F feedwater temperature;there can be no purpose in comparing such units on thebasis of a 500,000,000-Btu unit, as suggested by the author.The per cent of heat absorbed in the furnaces in the varioustests given in the paper are low, in fact, considerably lower thanwould be expected in a modern furnace. In tests A-l, A-2, andA-3, the low rate of absorption is probably due to poor combustionconditions and can be compared only with locomotive boilers.13 V ice-President Engineering, Com bustion Engineering Com pany,Inc., N ew York, N . Y . M em . A .S.M .E .
BAILEY—STEAM-BOILER PERFORMANCE AND A METHOD OF COMPARISON 377F i g . 11 A p p r o x i m a t e R e l a t i o n o f H e a t R e l e a s e d t o H e a tA b s o r b e d i n a P u l v e r i z e d - C o a l W a t e r - C o o l e d F u r n a c eFig. 11 of this discussion reproduced from Fig. 9 of the writer’spaper,14 shows the ratio of heat absorbed to heat released, both inBtu and in per cent. The curves sloping upward from the lowerleft-hand corner are read in Btu per lb per sq ft, to the left, andthe curves sloping downward read percentage of heat absorbedor efficiency of furnace absorption, to the right.The points from the tests in the author’s paper are plottedagainst the percentage of heat absorbed. With the exception ofC-l and C-2, the points are well below the lower of the two efficiencycurves. In a modern oil-burning furnace, the points C-land C-2 would be expected to fall near the upper efficiency curve.For comparison, the two points R are plotted from test results ofa tangentially fired pulverized-coal slag-bottom furnace on a unitof 300,000 lb per hr capacity. The points T are from a 450,000lb per hr tangentially fired pulverized-coal slag-bottom furnaceand points jS are from a vertically fired slagging-bottom furnace,pulverized-coal-fired. In all of these units, the furnace walls arecomposed of bare fin tubes.The influence of both the amount and character of the ash andof the method of firing on the amount of heat absorbed is marked.It may be seen from the curves and from the points plotted fromthe tests that the per cent of heat absorbed in any furnace decreasesas the rate of release per square foot increases.Absorption below the lower curves would indicate inefficientuse of the furnace wall surface, poor combustion, or walls coveredwith an excessive amount of ash. Water wall tubes coveredwith refractory or refractory coatings will also fall below thelower curves.A u t h o r ' s C l o s u r eThe comments of Messrs. Hobbs, Powell, and Sherman arevery much appreciated as they fully grasped the importance andsignificance of this method of comparing the performance of furnacesand heat-absorbing surfaces in steam-boiler units. Mr.Powell has raised a question, in which Mr. Sherman concurs,i.e., whether the equivalent-surface area might be simplified to afactor of square feet of surface per Btu available. Mathematicallythis would seem to be simpler, but psychologically the authorfears it would be more confusing because the logic of the factor isnot quite so evident. For instance, assume a unit having 500,-000,000 Btu available and, at the point to be plotted 10,000 sq ftof actual surface have been passed over; this factor would be0.00002. The suggestion of multiplying this by 106 would leaveit 20. This seems like a very inadequate figure to plot when itactually represents 10,000 sq ft of surface. Even multiplyingthis by 109 or 1010 seems in the author’s opinion only to add to confusionrather than to simplify the method of comparison used inthe paper.There may well be some question concerning the choice of 500,-000,000 Btu when some boilers may go as high as 1,000,000,000and others may be only 1/ i or Vio this amount. The value ofthis entire method comes through standardization and while, asMr. Powell says, the 500,000,000 may be outmoded, it is greatlyto be doubted if the average boiler unit to be considered will varyso much from 500,000,000 Btu available that it cannot still beused as a perfectly logical standard. Certainly 100,000,000 Btuis not a satisfactory standard and 1,000,000,000 is applicable inonly a few cases. As a matter of fact, it is felt that the oddnumber of 500,000,000 has some real value in that it makes onestop to think what it really is, while otherwise it might be anabstract factor and not carry the significance to the mind of theuser, which condition now seems to prevail. Another point ofsignificance is that most coordinate papers bring out the valueson this basis very nicely, while figures l/ 6 or 2 times those usedwould not be as convenient to plot.Mr. Julsrud mentions several matters pertaining to furnacedesign and the characteristics of ash which are really outside thescope of the paper as presented, since the data given were limitedpurposely to a range of boiler operation permitting a comparisonwith the sizes prevailing in locomotive practice, and also to bringout the method of comparison rather than to go into the ma,nyphases of slag, heat absorption, etc. As indicated by Mr.Powell, there is great opportunity in the future for all thesematters to be studied through this method of comparison.As a matter of fact, Mr. Van Brunt in Fig. 11 of his discussionhas already compared some of the data on dry-ash coal-fired andoil-fired furnaces with data on slag-tap furnaces for which he hasinformation.Before replying to Mr. Van Brunt’s discussion, the authorchecked with him and was assured that his “heat release 1000Btu per sq ft projected area” is identical with the author’s “heatavailable.” It is significant to note that the lower curve of Mr.Van Brunt’s Fig. 11 on the percentage basis is substantiallyidentical W'ith Mr. Orrok’s curve, which the author reproduced ona similar basis and presented as Fig. 20 in his discussion16 of Mr.Brandt’s paper. We have found that not only do the points C-land C-2, which Mr. Van Brunt has plotted in his Fig. 11, fall onthis curve of Mr. Orrok’s, but they also are in close agreementwith many other data obtained on oil-fired boilers having normallyclean heat-absorbing surfaces and where the adiabatictemperature is close to 3600 F. Points B-l and B-2 for the pulverized-coal-firedfurnace with dry-ash removal are approximately20 per cent lower in rate of heat absorption than are those of theOrrok curve on which fall the oil-fired tests. This indicates acertain amount of ash accumulation on the surface of such furnace,which also has been substantiated with many other data.As noted in the author’s paper, all of these data, except thoseconcerning the French locomotive, are based upon tests withthe high-velocity thermocouple of the single-shield variety, andto answer Mr. Powell’s question no correction has been made. Itis now known, however, that many of these temperatures arelikely to be from 50 to 75 deg low. This would indicate that theactual rates of heat absorption are still lower than those indicatedby the B and C points and, therefore, closer to the French datawhich Mr. Van Brunt believes to be low. They are in the sameregion as Goss’s locomotive tests of 1912, where heat absorption14 “ D esign of H igh-C apacity Boiler,” by John Van Brunt, Trans. 16 “The Locom otive Boiler,” by C. A. W. Brandt, discussion b yA .S.M .E ., vol. 60, 1938, paper FSP-60-17, p. 487.E. G. Bailey, published on page 399 of this issue of the <strong>Transactions</strong>-
378 TRANSACTIONS OF THE A.S.M.E. JULY, 1940in the firebox alone was determined by direct evaporation withoutdepending upon any gas temperatures. These data fromGoss’s tests are also given in Fig. 20 of the author’s discussion15of Mr. Brandt’s paper. M ;Mr. Van Brunt has questioned why all of these rates of heatabsorption are so low in comparison with his points R, S, and T,taken in furnaces of the slag-tap type where the walls are apparentlycoated to some extent with slag. However, since Mr.Van Brunt does not give the fluid temperature of the ash or otherdata, it is beside the point to question them further than to statethat any inaccuracies in the measurement of gas temperatures inthese portions of boiler units may lead to very erroneous conclusions.Dr. Mullikin has presented papers16 before the American Instituteof Physics showing comparative results from bare thermocouplesof different sizes, single-shield high-velocity thermocouples,and multiple-shield high-velocity thermocouples. Agreat deal of field data were included. These data emphasizethe importance of further studies in gas-temperature measurement.Further evidence has been obtained showing that the multipleshieldedhigh-velocity thermocouple is more nearly correct thananything else that has yet been devised. In boiler installationswhere the heat absorbed in the air heater, economizer, and superle“Gas-Tempferature M easurem ent and the H igh-Velocity Thermocouple,!!:byH . F. M ullikin, Sympbsium on Temperature M easurement and Control, American Institute of Physics, N ew York, N . Y .,N ov. 2, 1939.“Accuracy T ests of the H igh-Velocity Thermocouple,” by H. F.Mullikin and W . J. Osborn, loc. cit.T hese papers were published in abstract form in Glass Industry,vol. 20, no. 12, December, 1939, pp. 141 44'J.heater can be determined separately, the gas temperatures enteringthe superheater may be determined by calculating back froman accurate measurement of the gas temperature leaving the airheater. Such data check very closely with the multiple-shieldedhigh-velocity thermocouple.Other confirmation on rates of heat absorption in furnaces hasbeen obtained by a thermal probe wherein the rate of heat absorptionhas been determined by the rate of flow of a fluid and itsrise in temperature through the element when inserted into differentparts of furnaces.Mr. Van Brunt states that there is no advantage gained incomparing a unit of 100,000 lb per hr output at 300 lb per sq in.pressure, 750 F steam temperature, and 250 F feedwater temperature,with a larger unit of 300,000 lb per hr output, 1200 lb per sqin. pressure, 925 F steam temperature, and 380 F feedwater temperature.If the fuel burned and furnace construction are thesame, a comparison of heat absorption up to the entrance of thesuperheater will be well worth-while, for the temperature gradientsare not sufficiently different to have any measurable effectupon the rate of heat absorbed up to that point. There will, ofcourse, be a justifiable difference in the shapes of the curvesthrough the superheater, later boiler bank or economizer, and theair heater. However, it is not beyond our experience to learn agreat deal from even these comparisons. Of course, the realadvantage comes in comparing units in which similar temperaturegradients exist, in order to detect the effect of excess air, differentkinds of fuel and ash, arrangement of surface, etc. The mainpurpose of the present paper was to show a simple method ofmaking these comparisons, leaving it to the judgment of thoseusing this method as to the value obtained by the variety of comparisonsthey might choose to make.
The Locom otive BoilerBy C. A. BRANDT,1 NEW YORK, N. Y.For m a n y years in creased traffic a n d th e d e m a n d for h ig ho p eratin g e c o n o m y o f th e railroads r esu lted in th e d e v elo p m en t o f lo c o m o tiv e s o f h ig h tr a ctiv e effort ca p a b le o fsta r tin g tr a in s c lo se t o th e lim it o f le n g th for p r a cticalh a n d lin g th r o u g h y a rd s a n d te r m in a ls. T h e ev er-p resen td em a n d for s till h ig h er tr a n sp o r ta tio n c a p a c ity o f th e r a ilroadsa n d c o m p e titio n have c o m p e lle d th e fu r th e r d e v elo p m en t o f lo c o m o tiv e s t o h a n d le th e s e lo n g a n d h eavytrain s a t h ig h sp eed s. T h is h a s m e a n t p rop o r tio n a te lylarger a n d m o re e ffic ie n t b o ilers. T h e a u th o r d isc u sse s inth is p ap er so m e o f th e p r o b le m s o f b o iler d e sig n s a n d p ropo rtio n s t h a t a ffect th e e fficien cy a n d c a p a c ity o f th e c o n v e n tio n a l lo co m o tiv e.THE PUBLIC, which is served by the railroads, is continuouslydemanding higher speeds for both freight and passengertrains and this, in conjunction with a more intensiveutilization of their motive power, is one of the many importantproblems confronting the managements of the American railroadstoday.Until recent years the steam locomotive had been the principalpower unit, but its supremacy is now being challenged by otherforms of motive power, particularly the electric- and Dieseldrivenlocomotives. To meet this challenge the designers ofsteam locomotives are constantly studying the problem of buildingboilers of greater steam-generating capacity within the permissiblelimits of size and providing engines of lowest possiblesteam consumption per unit of power.The fact that higher boiler capacity for minimum weight hasbeen an ever-present problem throughout the years of locomotivedevelopment in America can best be illustrated by citing theevolution of the eight-coupled locomotive. The first of this design,or the 2-8-0, utilized 90 per cent of the total locomotiveweight for adhesion. The demands for higher speeds, requiringgreater steam-making capacity, led to the addition of truck axlesto carry the heavier boilers, which resulted in the successive developmentof the 2-8-2, the 4-8-4, and last the 6-4-4^6 type highspeedlocomotive, exhibited at the New York World’s Fair thisyear.The total weight of an early-design 2-8-0 type locomotive with270,000 lb on the drivers and a tractive power of 67,500 lb wasonly 300,000 lb. To supply the steam for the high-speed 6-8-6type locomotive with the same weight on drivers and the sametractive power requires a boiler of such size as to double the totalweight of the locomotive to 600,000 lb, as is illustrated inFig. 1.As this and other modern locomotives are examples close tothe maximum practical size that can be built, the important questionis whether greater boiler efficiency is attainable, particularlyat high-capacity operation, and what can be done to accomplishthis.The question of reducing the steam consumption of the enginesis outside the scope of this paper, but the possibility of reducingthe average steam consumption per ihp from an average of 18 lb1 Chief Engineer, The Superheater Com pany. M em . A .S.M .E .Contributed by the Railroad D ivision and presented at theAnnual M eeting, Philadelphia, Pa.. D ecem ber 4 -8 , 1939, of T h eA m e r ic a n S o c ie t y o f M e c h a n ic a l E n g i n e e r s .N o t e : Statem ents and opinions advanced in papers are to beunderstood as individual expressions of their authors, and not thoseof the Society.to 13 lb is possible by the adoption of compound cylinders asreported from tests on French locomotives, as well as by the useof still higher superheat and valve gear adaptable for its utilization.The paper will be confined to a discussion of those problems ofdesign believed to be most essential in the advancement of theart. To enhance the value of this contribution, Tables 1 to 6are included which give the principal dimensions and boilerratios of representative locomotives of various types built inAmerica in recent years. Locomotive test curves are also presented.The subject matter will be centered on problems affecting thedesign of the conventional locomotive fire-tube boiler only, not becauseof any belief that this type of boiler is the final answerto the locomotive steam generator, but because at present most ofthe locomotives in the world are equipped with this type of boiler.The best solutions to some of the problems encountered in thedesign of large boilers have not yet been agreed upon principallybecause of the lack of reliable test data.A committee of the Association of American Railroads(A.A.R.) submitted a report this year recommending a conventionaltype of boiler for a proposed 6400-hp high-speed locomotive,which is an acknowledgment that the fundamental principles ofthis boiler design have proved practical and are the best availableat the present time.F i q . 1 I n c r e a s e i n T o t a l W e i g h t o f E i g h t - C o u p l e d L o c o m o t i v e s D u e t o L a r g e r B o i l e r C a p a c it yIt is unnecessary to recite in detail the advantages of the conventionalboiler; this has been done many times before. Thevirtues of the completely water-cooled radiant-heat-absorbingfurnace, high gas velocities over the convection heating surfaceswith forced draft, and high superheat, all originally inherent inthe locomotive boiler, are now being recognized as essentials toefficient steam generation in other fields and are being rapidlyadopted in stationary-power-plant boilers.Locomotive boilers of designs radically different from conventionalconstruction have been built in the past, but so farnone has proved sufficiently practical for general railroad service.There will soon be placed in service in America a different typeof steam generator for operation in conjunction with condensingsteam turbines, and still other types are under consideration.There has been a great increase in the size of locomotive boilersbuilt in recent years in America; many of these have proved veryefficient. However, much remains to be done to make possiblethe burning of more fuel per hour at higher combustion efficiency
380 TRANSACTIONS OF THE A.S.M.E JULY, 1940with lower draft loss, greater heat-absorption efficiency, andhigher superheat with less boiler weight per pound of steam produced.D e f i n i t i o n o f B o i l e r C a p a c i t y a n d E x i s t i n g F o r m u l a sIn designing a locomotive, the steam required for a given maximumhorsepower capacity can be determined quite accuratelyfrom existing knowledge of steam consumption per ihp-hr, wheninitial and final steam conditions are specified. To this must beadded the steam required for auxiliaries, train heating, air conditioning,and other uses. The boiler design must be such as to deliverthis maximum steam output at a superheat as high and aback pressure as low as that figured on, or else the steam consumptionper ihp will increase and the cylinder power fall belowthat required. To determine the excellence of a particular boilerdesign and compare it with others, it is necessary to have a standardmeasure of comparison.It would appear logical that the weight of steam produced perpound of total weight of the boiler in service should provide asatisfactory measure when a definite steam pressure, superheat,and draft loss are specified. It is obvious that such a yardstickis of no value, unless a standard method of predetermining themaximum evaporative capacity is found which will satisfy allconditions in a reasonable way.In reviewing the existing methods of calculating the maximumevaporating capacity of a locomotive boiler and the over-allboiler efficiency, the designer is confronted with the fact thatformulas now generally used are inadequate for predeterminingthe result with accuracy, particularly when large boilers are involved.In America the theory generally followed is that the steamgeneratingcapacity2 of a boiler is directly proportional to theamount of evaporating heating surface in square feet.A set of evaporative values, giving the maximum quantity ofsteam in pounds per square foot of heating surface per hour,generated by the firebox and flues, was prepared some years agoby F. J. Cole.3These values are generally used by the locomotive builders andrailroads today.2’3'4’5Any method of calculation that takes square feet of heatingsurface only into consideration must be inadequate. It is evidentthat the arrangement of the heating surfaces, their relationshipto the grate area, furnace volume, gas area, firebox heatingsurface, and hydraulic depth and length of the flues must be consideredto give approximately correct results. The reason is thatit is these relationships which determine the boiler efficiency, theback pressure required to produce the steam, and the superheat,all of which have a great influence on the efficiency and poweroutput of the cylinders.Strahl proposed a formula in 19136 which takes into considerationthe size of the grate area and its ratio to the evaporatingheating surface2 “ Locom otive D ata,” The Baldwin Locom otive Works, eleventhedition, Philadelphia, Pa., 1939, pp. 21-23.3 “ Locom otive H andbook,” American Locom otive Company,Schenectady, N . Y ., 1917, p. 58.4 “ Potential Horsepower Formula Agreed to by American Locomotive Builders,” R eport of Federal Co-Ordinator of Transportation,W ashington, D . C., N ov. 27, 1935, p. 48.6 “ Horsepower and Tractive Effort of the Steam L ocom otive,” byA. I. Lipetz, Trans. A .S.M .E ., vol. 55, paper R R -55-2, 1933, pp. 5-42.6 “ M ethod of Determ ining the Capacity of Steam Locomotives,” by Strahl, Zeit. V.D.I., vol. 57, 1913, pp. 251—257, 326-332,379-386, and 421-424.whereTF
BRANDT—THE LOCOMOTIVE BOILER 381sary data. The director of equipment research at that time,L. W. Wallace, made a report and recommended complete locomotivetests, but this program has never been carried out.Many tests have been made by the Pennsylvania and New YorkCentral railroads and the respective managements deserve thegreatest praise for their valuable contributions to the art. Mostof these tests, however, have been made on locomotives with relativelysmall grate areas and with approximately the same ratiosof grate areas, gas areas, firebox volumes, etc. There are few dataavailable on the effects of very large grates and large fireboxes.The tests recommended by the Research Division of the A.A.R.were complete and necessarily expensive. It is believed by theauthor that adequate information as to the efficiency and maximumcapacity of boilers with large grates and furnaces can be obtainedwith stationary blowdown tests of some three or fourboilers with widely different boiler ratios. Such tests should beconducted with oil fuel and also with several different grades ofcoal, sufficient to establish fundamental data now lacking. Withcomplete data on the quantities, qualities, etc., of the fuel, water,and air used, and the gases and steam produced, all losses couldbe segregated and closely determined.This would permit the determination of coefficients m and nin Fry’s formula. It is hoped that such a test program will bemade possible as this matter is not one merely of academic importance,but is a vital item of railroad economics. The methodof standing blowdown tests developed and used by the NewYork Central Railroad in recent years has proved very effective.Results of such tests are dependable since the boiler testing isseparated from and is independent of the locomotive-engine performance.This facilitates the adjustments for setting the requiredoperating conditions for each capacity test and the continuanceof each test run for a sufficiently long period of time atconstant rate, without interruption by locomotive- and testplantrunning conditions.The New York Central Railroad’s method of blowdown testis conducted so that the steam exhausted from the cylindersthrough the nozzle is desuperheated to a temperature closelyagreeing with that actually observed on road tests for equal capacities.The correctness of this test procedure has been provedby the fact that the front-end design and nozzle size establishedby such test have proved correct for best maximum performancein road service.G a s A r e a i n R e l a t i o n t o B o i l e r E f f i c i e n c y a n d C a p a c it yIt is well known that the efficiency of the boiler decreases withan increased firing rate. The rapid drop is mainly due to thehigh losses occurring in the form of unburned fuel escaping withthe flue gases. The problem of greater fuel-burning capacity athigher efficiency of combustion is, therefore, the first item whichshould be considered and involves the arrangement and relativesize of the gas area through the boiler, the grate area, combustionvolume of the furnace, and the firebox heating surface, also,stoker construction, arrangement of firebrick arches, amount ofair opening through the grates, and the introduction of secondaryair above the fire bed.In considering the matter of locomotive-boiler design, as in tfiecase of any other structure, it is well to establish a base from whichto start. This is difficult with a locomotive because the problemof its design involves a cycle of successive approximations to obtainmaximum power and efficiency within the weight limitations.In the past either the heating surface or the grate area has beenthe basis on which the size of the other component parts of theboiler has been determined. This is not the most logical procedureas the dimensions of these parts do not control the limit ofsize to which the boiler can be built, since they may be increasedwith the length of the boiler within considerable limits. The diameterand gas area through the boiler constitute the limiting factorsbecause the height, width, and weight are fixed and cannot beexceeded. It is, therefore, more logical that this factor be madethe basis on which the other parts are proportioned.The capacity of the locomotive boiler is limited by its diameterbecause this determines the gas area of the flues through which allthe gases of combustion must pass; in addition it must providespace for the superheater through which all the steam generatedmust flow. It determines the flue heating surface that can be installedper unit length of flue, the area of the steam-disengagingBOILER DIAMETER O.D. LARGE COURSE, IMS.F i g . 2 R e l a t i o n o f B o i l e r D i a m e t e r t o T o t a l W e i g h t o f L o c o m o t iv e p e r F o o t o f W h e e l B a s e a n d A l s o G a s A r e asurface, and the steam volume above the water level in the boiler.This last item is of the greatest importance and is, in reality, thelimiting factor in high-output operation, as evidenced by the seriousdifficulties experienced with water carry-over into the superheaterand cylinders in many boilers.Within the clearance, the maximum diameter of the boiler isdetermined by the weight limits. In order to analyze this problem,the proportions of 165 different designs of modern locomotiveshave been studied to ascertain the relationship betweenthe diameter of the boiler and the total weight of the locomotive.The curve, Fig. 2, shows this relationship. It is apparent that,while there are many factors which influence the weight, the boilerdiameter has been sacrificed for other features of design in manycases. If, as an example, the 104-in. boiler is noted, the totallocomotive weight per foot will vary from a minimum of 8400 lbto a maximum of 12,400 lb, or an increase in total locomotiveweight of nearly 50 per cent for the same boiler diameter. Thechart indicates that there is a uniform increase of 133 lb per ft oftotal locomotive weight for every 1-in. increase in the boilerdiameter. This curve may facilitate studies in efforts to obtain
382 TRANSACTIONS OF THE A.S.M.E. JULY, 1940the greatest possible diameter and gas area for allowable weights.A relatively large gas area through the boiler in relation to thegrate area and heating surface is not generally followed, as notedfrom a study of the ratios Nos. 30, 31, and 32, Tables 1 to 6.That the gas area through the boiler is one of the most importantitems affecting the boiler capacity is not generally appreciated,but may be better understood if actual test figures areanalyzed. From the test of the Pennsylvania Railroad, classMIA, locomotive No. 6706, column 10, Table 4, on whichsufficient data are available to permit determination of theweight of the gases passing through the boiler, the data shown inFig. 3 have been compiled. It is interesting to note that, at highfiring rates, the gas velocity through the tubes near the back tubesheet reaches the high figure of 204 miles per hour. The greatimportance of eliminating unnecessary restrictions in the gaspassages and the superheater units is apparent.As the gas area is increased, the velocity and frictional resistanceof the gases passing into and through the boiler flues arelowered. This will reduce the draft requirement and in turn thecylinder back pressure, enlarging the power output of the locomotivein direct proportion to the resultant increase in the mep.This is important when high power output is desired at high speedas the reduction of 1 lb of cylinder back pressure gives as muchincrease in power as a 4-lb gain in pressure on the steam inlet oradmission side.The importance of a large gas area through the boiler was recognizedyears ago. C. D. Young9 pointed out in 1915 that from hisexperience the maximum evaporative capacity of a boiler was indirect ratio to the total gas area through the flues and was apparentlylimited to an amount of 7000 lb actual or 9100 lb equivalentevaporation per hr per sq ft of gas area for the engines testedup to that time. This has been bettered considerably on modernlocomotives with type-E superheaters and more powerful draftarrangements to about 11,000 lb equivalent evaporation per sqft of gas area. The test results given in the following table confirmthis point:To illustrate the limiting effect that the gas area has upon theevaporative capacity of a locomotive boiler, the test results fromseveral locomotives have been plotted in Fig. 4. The relationbetween equivalent evaporation and back pressure is illustratedin Fig. 5.A study of the relationship between the gas area and the boilerdiameter of a number of modern boilers has been plotted in Fig.2; it will be noted that full advantage has not been taken in manycases in providing the largest possible gas area. For some boilerdiameters the gas area is as much as 3IV2per cent smaller thanthe maximum possible. This is perhaps due to a difference ofopinion as to the most suitable distance between the top of thecrown sheet and the inside of the boiler shell at the top; as to thewater space between the combustion chamber and boiler shell,or the clearance between tube holes and tube-sheet flanges; andas to tube spacing. The type of combustion chamber, the thicknessof the flues, and the superheater design also influence the gasarea. Offhand, it may seem that these details are not of greatconsequence, but really they are very important.The distance between the top of the crown sheet and the boilershell determines the steam space and steam disengaging surface.It is obvious that the smaller this distance is made the greater will* Test Bulletin, No. 28, Pennsylvania Railroad, 1915, p. 35.be the tube-sheet area. Information as to the most satisfactoryrelationship between the height of the crown sheet and other dimensionsof the boiler is lacking, but this question deserves mostcareful consideration.A slight increase in the water space between the combustionchamber and boiler shell decreases the available gas area considerably.On some boilers, this water space has been made aslarge as 8 in., while very many large boilers are operating successfullywith a water space of only 5 in., giving a large percentageincrease in gas area. It appears that the smaller water spaceimparts a higher velocity to the water circulation at this point,minimizing mud collection which the large water space was supposedto eliminate.The important influence that the superheater construction hasupon the gas area is apparent and will be discussed in more detailunder the subject of superheater design.F i r e b o x V o l u m e i n R e l a t i o n t o C o m b u s t i o n E f f i c i e n c yEarlier in this paper, it was pointed out that the firebox volumeis not subject to such limitations as the gas area. There arelimitations to the width and height of the firebox which are important,but the length of the grate and firebox may be extendedconsiderably beyond present general practice. This is fortunateas the most serious matter confronting locomotive designers todayis the problem of improving the efficiency of combustion in thefirebox, particularly at high-capacity operation. Incompletecombustion of fuel causes heavy losses in unburned fuel, highmaintenance cost due to cinder cutting of firebox sheets, stay-boltheads, tubes, and superheater. Damage due to fires along theright of way set by sparks, loss in good will to the general publicdue to smoke near railroad terminals, and loss of passenger trafficfor the same cause constitute a serious challenge to designers andoperators of steam locomotives.Improvement in the combustion process of the locomotive furnaceis a problem of primary importance and the proportions ofthe furnace should be such as not only to make possible completecombustion of the fuel with the elimination of smoke and cinders,but also to absorb sufficient radiant heat to cool the furnace gasesto a temperature low enough to prevent slagging at the flue sheetand on the superheater units.One would assume that sufficient data were available today todetermine the correct volume of the firebox in relation to the gratearea and heating surface. A study of Tables 1 to 6 indicates,however, that there is little agreement on this subject; greatvariations exist in these basic ratios. To cite an example: Theimportant ratio of firebox volume to grate area ranges from aminimum of 3.70 to a maximum of 8.28 cu ft per sq ft of grate
386 TRANSACTIONS OF THE A.S.M.E. JULY, 1940area. Compared on the basis of tractive power the furnace volumevaries from a minimum of 4.04 to a maximum of 11.67 cuft per 1000 lb of tractive power.The difference in opinion among locomotive designers as to thecorrect size of firebox and combustion chamber is due to the absenceof pertinent facts and test data to permit a scientific evaluationof the various factors. It is known that the first cost of theheating surfaces in the firebox and combustion chamber is veryhigh as is also the cost of the maintenance and inspection whencompared with the tube heating surface. What the relative costof firebox and tube maintenance amounts to is unknown. Littleinformation is available as to the cost of boiler maintenance,since few American railroads keep accounts to permit such astudy. In the report of the Federal Co-Ordinator of Transportation,November, 1935, the estimated average cost of boiler maintenanceis given as 30 per cent of the total cost of locomotiverepairs. The firebox maintenance is the greatest part of thiscost. As a large modern boiler will have from 5000 to 8000 staybolts in the firebox which must be tested at regular intervals, thesize of the firebox is a very important item when the question ofintensive utilization of the locomotive is considered.Against these items of cost should be balanced the great improvementsin boiler efficiency and capacity which are generallybelieved to be obtained by the use of large fireboxes. The heatabsorption of the firebox heating surfaces is from six to ten timesas great as the average tube heating surface. Another importantpoint not usually considered is that the radiant-heat absorptionby the firebox is accomplished without the expenditure of anyenergy, while the heat absorption by convection in the tubes consumesconsiderable power to create the high draft required. Theenergy required to move the gases increases with the fourthpower of the weight velocity. Only a few tests have been madewhich supply data permitting the calculation of combustion efficiency.These tests have been mainly on engines, the boilerratios of which are very much alike, and thus the effect of greatlydifferent boiler ratios is not clearly discernible from available data.To illustrate the effect which different boiler ratios have uponcombustion efficiency, the data from all tests available have beenplotted in Figs. 6 to 9. The combustion efficiency is plottedagainst various factors as follows:F ig. 6 . . . .H e a t in fu el fired per hrF ig. 7... .H e a t in fu el fired per hr per sq ft of grate areaF ig. 8 . . . .H e a t in fu el fired per cu ft firebox volu m e per hrF ig. 9 . . . .H e a t in fu el fired per sq ft firebox h eatin g surface per hrIt is, however, becoming more generally recognized that thelarger the furnace volume of a locomotive, the greater is the opportunityfor completing the processes of combustion. This istrue only if the larger furnace volume is obtained in conjunctionwith maximum boiler diameter, furnace width and depth, andnot by furnace length alone.An examination of a typical boiler diagram, Fig. 3, shows thegas velocities at several points in the firebox, an explanation beinggiven why the largest possible cross-sectional area through thefirebox is very important. The velocity of the furnace gases inthis case between the top of the arch and the crown sheet is ashigh as 260 miles per hour. It is remarkable that the small particlesof coal being blown by the stoker jets into the center of ahurricane of such velocity are able to settle on the grate or havetime to burn at all.A particle of fine coal caught in the gas stream will pass through
this furnace in 0.1 sec and this is one of the reasons for the greatloss of carbon at high-capacity operation. As a comparison, instationary practice the velocity of the gases just before enteringthe tube bank is about 10 miles per hour at a maximum. A studyof the designs of many recent boilers indicates that the width ofthe firebox, as well as the depth, could have been increased togive the advantage of a larger combustion volume under the firebrickarch, as well as a larger gas area between the top of the archand the crown sheet.A few modern boilers have been built with a firebox ring as lowas 53 in. from the rail which with a horizontal grate would givea good depth of the firebox at the rear. On many locomotiveswith the grate sloping up toward the back end, the distance fromthe rail to the firebox ring is 72 in., or more, and thus there is aloss of 18 in. in the depth of the firebox. The author has notbeen able to get a satisfactory reason why sloping grates are stillcontinued, especially since so many boilers have been built withhorizontal grates and have given satisfactory service.While discussing the subject of furnace volume, attention iscalled to the boiler-efficiency curves plotted in Fig. 10. Threeefficiency curves from oil-fired boilers are shown. Two are locomotiveboilers and one is a water-tube boiler, tested by the UnitedStates Navy.10The following table gives certain pertinent data on maximumcapacityoperation:U se r........................................................ Santa F e Southern Pacific U . S. N avyT y p e ....................................................... 4-8-4 A C4 M arineE n gin e n um b er.................................. 3766 4108 T yp e SXFurnace volum e, cu f t .................... 795 970 4 2 3 .6G as area through boiler at furnace,sq ft........................................ 1 0 .3 1 1 .9 8 3 0 .0 6M axim um oil burned, lb per hr. 7000 6800 5051M axim um oil burned per cu ftfurnace volu m e, lb per hr........ 8 .8 7 .0 1 1 .9M axim um oil burned per sq ftgas area............... . .......................... 680 558 168M axim um coal eq u ivalent, lb perh r......................................................... 10800 10500 7850It is interesting to note that it was possible to burn 35 per centmore oil per cu ft of furnace volume with 8 per cent higher boilerefficiency in the Navy boiler than was attainable in the locomotiveboiler. The gas area in the Navy boiler at the gas exit of thefurnace, however, was three times greater than on the locomotiveboiler, which again confirms the importance of gas area.A b s o r p t i o n E f f i c i e n c y o f t h e H e a t i n g S u r f a c e sThe absorption efficiency of the surfaces should be expressedas the total heat absorbed in per cent of the total heat availablefor absorption; that is, of the total heat drop from the furnacetemperature to the metal temperature of the flues and superheaterunits at the smokebox. This is termed the true efficiencyand is very high, about 90 per cent in a locomotive boiler, dueto high gas velocity and cooling of the gases to within 75 F ofthe temperature of the water at low rating, and 200 F at highcapacity.On locomotives with type E superheaters the smokebox gasesare from 100 to 150 deg lower than the steam temperature. Thelosses due to the sensible heat escaping in smokebox gases rangefrom 19 to 25 per cent of the heat in the coal fired, at high rating,and the only hope of reducing these is by a radical change in theboiler design whereby the average temperature head could be increasedby the use of a counterflow economizer. In this mannerthe smokebox gases could be lowered some 210 F which wouldgive a 7 per cent increase in the over-all boiler efficiency.The importance of an effective arrangement of the flue heatingsurfaces is most apparent at high capacity when 70 per cent of the10 “ The B& W High-Pressure Sectional Express Boiler,” b y R . C.Brierly, Journal of the Am erican Society of N aval Engineers, vol. 43,N ov., 1931, pp. 511-561.BRANDT—THE LOCOMOTIVE BOILER 387liberated heat is delivered to the flues. The ratio of the net gasarea of a flue to its gas-swept perimeter (sometimes calledhydraulic depth) determines the gas-carrying capacity of theflues. The larger this ratio becomes the more gas will flow forequal pressure drop. This has been labeled the “flue capacityfactor,” or F.C.F.The longer a flue of a given F.C.F. is made, the greater becomesits true efficiency and also its draft loss. Now if the length ofthe flue in inches is divided by the F.C.F. a value is obtainedwhich expresses the true efficiency of any diameter and length offlue. This factor has been termed the “flue efficiency factor” orF.E.F. The larger it becomes the more efficient a flue is.In Fig. 11 has been plotted a curve showing the true efficiencythat will be obtained on any size and length of flue with a givenflue efficiency factor, or F.E.F.; that is, the ratio of length tohydraulic depth.In Fig. 11 is also shown the true efficiency of several sizes of fluesfor different lengths. The F.E.F. for a 2-in. inside-diameterflue 18 ft long is 432 and gives a true efficiency of 88 per cent. Ifthis flue is made 25 ft long the F.E.F. becomes 600 and the trueefficiency is increased to 94.5 per cent, but the draft loss is increasedin the same ratio as the length. In America many boilershave been built with flues 22 ft to 25 ft long, but usually effortsare made to keep the flue lengths down by lengthening the combustionchamber where this can be done. It is evident from Fig.11 that a larger-diameter flue of a greater length can be used togive the same true efficiency as a smaller flue of shorter length.The heat-absorption efficiency of locomotive boilers increaseswith an increase in the flue efficiency factor of the tubes and fluesand ranges usually between 78 and 88 per cent. The absorptionefficiency of several boilers has been shown in Fig. 12; itis noted that there is a very small decrease in this efficiency asthe rate of firing is increased.The combined absorption and combustion efficiency gives theover-all efficiency of the boiler and superheater and these dataare shown in Fig. 10 for the engines previously cited. The generalproportions and boiler ratios of all the engines shown in thisand previous curves are given in Tables 1 to 6, as follows:P ennsylvania R .R .................................................... .... E 2A T able 5 C olum n 8P ennsylvania R .R .................................................... .....K 4S T able 5 C olum n 6P ennsylvan ia R .R .................................................... .... L IS T ab le 5 C olum n 7P ennsylvania R .R .................................................... .... I IS T ab le 2 C olum n 1P ennsylvan ia R .R .................................................... .... M l A T able 4 C olum n 10C hicago, Bur. & Q u in cy............................................ M 4 T able 2 C olum n 6M issouri Pacific R .R ................................................... 1699 T able 5 C olu m n 9B aldw in Loco. W ork s................................................. 60000 T able 2 C olum n 10N ew Y ork C en tral....................................................... J I B T able 1 C olum n 3A tchison, T op ek a & S anta F e ................................ 3766 T able 5 C olum n 4Southern P acific............................................................ A C7 T ab le 6 C olum n 10Heat balances showing the heat absorbed by the boiler andsuperheater together with the various heat losses for two modernlocomotives are shown in Figs. 13 and 14.Before leaving the subject of heat absorption, a few words maybe said as to the heat-absorbing capacity of the firebox. Coleproposed 55 lb of steam per sq ft as the maximum based on ProfessorGoss’s test at Coatesville,the only test made on a locomotivewhere the firebox evaporation was determined separately. Thisvalue of evaporation rate has continued to be used up to noweven though the size of the locomotive firebox has increased fiveto six times since the Coatesville tests. It is reasonable to supposethat the same evaporation rates cannot very well apply toa firebox with 800 sq ft of heating surface having siphons, circulators,etc., as to a firebox with only 150 sq ft.Since the adoption of waterwalls in stationary boilers, the heatabsorption due to radiant heat has received much attention andanalysis.The general behavior of radiant energy as expressed anddefined in Stefan-Boltzmann’s law, Prevost’s law, Kirchhoff’s
388 TRANSACTIONS OF THE A.S.M.E. JULY, 1940law, Planck’s formula, and studies by many other investigators,permits definition and determination of the coefficients of emission,absorption, reflection, and transmission of radiant heat. Toapply these laws to locomotive fireboxes, additional test data willbe required.The proportion of the total heat liberated in the furnace, whichis absorbed by the firebox heating surfaces has been termed “furnaceabsorption efficiency,” and this determines the temperatureof the combustion gases as they leave the firebox. An accurateknowledge of this temperature is important as it determines thedesign and performance of the superheater.In tests where complete gas analyses have been made to determinethe quantities of air used for combustion, it is possible tocalculate the per cent of fuel fired that is actually burned and thetotal heat liberated in the furnace. A fraction of the liberatedheat is absorbed by the firebox and the balance leaves as sensibleheat in the combustion gases which, with the total known weightof gases, determines the mean temperature of these gases leavingthe furnace. The furnace absorption efficiency can thus bestated in terms of the average temperature of the gases leaving thefurnace.Thus, if
BRANDT—THE LOCOMOTIVE BOILER 389ti = temperature of combustion gases leaving firebox, FCr = mean specific heat of combustion gases between t and60 FH T = total heat liberated in firebox per lb of combustion gasesIIc = heat in 1 lb of combustion gas leaving furnaceII r = heat absorbed in firebox in per cent of total liberatedThe relation between the percentage of heat absorbed by thefirebox and the temperature of gases leaving, depends upon theheat liberated per lb of combustion gas, which again dependsupon the excess air used for combustion. If, therefore, an accuratemeasure of the gas temperature leaving the firebox is obtainedwith a reliable pyrometer the furnace absorption efficiency canbe determined.It has been demonstrated that the radiation from the flames islargely due to incandescent particles of fuel and ash in the flame.The quantity and distribution of this radiating material in theflames, together with the amount of firebox heating surface, determinethe coefficient of emission or absorption. This explainswhy boilers fired with oil give higher superheat; the less luminousflames of the oil fire will give up a smaller percentage of heat tothe firebox by radiation, and the gases entering the flues are thereforehotter.Several formulas have been proposed for the determination ofthe furnace absorption efficiency. The author has checked anumber of the formulas proposed by Hudson, Broido, Wohlenberg,Orrok, Munzinger, Bottomly, and Adloff, but sufficient testdata are not available to confirm their methods closely enoughfor locomotive-firebox conditions. All formulas, however, showthat the fraction of the total heat liberated, which is absorbed asradiant heat by the furnace walls, decreases as the total heat liberationis increased. It will range from about 50 to 55 per centat low rating down to perhaps 25 to 30 per cent at high-capacityoperation.At low rating the heat absorption per square foot of fireboxheating surface will be near the figure commonly used, or 55 lbof water evaporated per sq ft but at high capacity the heat absorptionwill approach a figure of 125 lb of water per sq ft of heatingsurface. From the studies made of this problem, it is doubtfulif the percentage of heat absorption can be increased to muchmore than 50 to 55 per cent of the heat liberated, by increasingthe amount of firebox heating surface, because the amount ofradiant energy absorbed is limited by the effective surfaces of thefire bed and the luminosity of the flames.G r a t e A r e a i n R e l a t i o n t o E f f i c i e n c y a n d C a p a c it yThe size of the grate area should be in proportion to the maximumoutput expected of the boiler and the quality of the coal tobe burned. With the exception of the Dakota and Wyoming lig
390 TRANSACTIONS OF THE A.S.M.E. JULY, 1940DRV COAL FIRED PER SQ .FT. GRATE PER H O U R ,LB S .F i g . 15E q u i v a l e n t E v a p o r a t i o n V e r s u s C o a l F i r e d p e r S q u a r e F o o t o f G r a t e p e r H o u rnites, the average maximum variation in the heating value of thecoals mined east of the Mississippi is from 12,000 to 14,000 Btuper lb, and west of the Mississippi from 10,000 to 12,000 Btu perlb, or about 17 per cent for each class of coal.If the grate-area ratios of modem locomotives, however, arestudied it will be noted that they vary to a much greater extentthan the heating value of the fuel, as shown in the following table:/— •-----------R atio---------------sM inim um M axim umG rate area per 1000 lb tractiveeffort........................................................ 0 .7 8 2 .3 2G rate area per sq ft to ta l h eatin gsu rface.............................................. . . 0 .0 1 1 9 0 .0 2 6 2G rate area per sq ft firebox heatingsu rface.................................................... 0 .1 0 1 0 .3 5 3G rate area per sq ft n et gas area. . 7 . 1 1 3 .8R ange ofdifference,per cent1 :2 .9 71: 2 .201 :3 .5 01 :1 .9 4It would appear that much thought and study must be givento this subject as the proper size of grate area is important in obtaininghigh furnace efficiency and capacity. If too small a grateis selected, the firing rate will be too high at maximum-capacityoperation and, if too large, it is difficult to keep the grate coveredat low capacity, which results in bare spots, a high per cent of excessair, reduction of boiler efficiency, and superheat. The servicecondition and the profile of the road must be carefully analyzedfor best results.The question of the percentage of air openings through thegrates has been explored during the last few years. Recenttests on one railroad, where grates with air openings of 10, 24, and32 per cent were tried, indicated a very small variation in boilerefficiency between the various percentages of air openings, orless than V /t per cent above and below the mean percentage.The relation between equivalent evaporation per square footof grate area and coal fired per square foot of grate area per hourhas been plotted in Fig. 15.S e c o n d a r y A i r f o b C o m b u s t i o nThe length of the firebox and the combustion chamber is ofimportance, but there is a question whether the function of thelatter which gives it its name is operative, as there is no air admittedahead of the arch on most locomotives to permit the carbonto burn completely in its passage through the combustionchamber.Today, most modern locomotives in America are fired with astoker which distributes the crushed coal with steam jets throughthe boiler backhead. The coal is thus thrown into the fireboxthrough and against the gas stream at the point of its highestvelocity. The heaviest coal lumps fall on the grate, but many ofthe fine coal particles are caught in the high-velocity gas streamand partially burned in suspension while traveling at high speed.During the short time the coal particles pass through the furnace,they must be heated to ignition temperature, the moisture drivenoff, and the volatile gas distilled and burned before the solidcarbon is consumed. It is quite possible that most of the carbonnow escaping could be completely burned in the large fireboxesif sufficient oxygen were admitted into the firebox and combustionchamber as secondary air. The beneficial effect of admittingsecondary air above the fuel bed has been known for many yearsand recognized by authorities on combustion as very desirable,yet little has been done along this line.This subject was investigated by Henry Kreisinger11 as early11 "Com bustion of Coal and Design of Furnaces," by Henry Kreisinger,C. E . Augustine, and F. K . Ovitz, Bulletin N o. 135, UnitedStates Bureau of Mines, W ashington, D . C., 1917.
BRANDT—THE LOCOMOTIVE BOILER 391as 1917. In these tests it was proved that, with a firing rate upto 185 lb per sq ft of grate and with the thickness of fuel bedvarying from 6 to 12 in., all the oxygen in the air which enteredthrough the grate and fuel bed was consumed at the level of approximately4 in. above the grate.A sufficient quantity of secondary air admitted above the fuelbed in such a manner as to create a turbulence in the gases wouldpermit of an intimate mixing of the hydrocarbons thrown off bythe coal, and provide the necessary oxygen for the complete combustionof volatile gases and carbon. Another very importantresult from the use of a correct amount of secondary air is thatit will help to eliminate smoke which always has been a seriousnuisance in locomotive-boiler operation.Kreisinger states in his report,11 “the ratio between the weightof air supplied and the weight of fuel gasified remains practicallyconstant at about seven to one so that only about one halfof the fifteen pounds of air required to burn the fuel should besupplied through the fuel bed. In order to complete the combustionof all the fuel fed into the furnace, the balance of the airshould be admitted above the fuel bed to consume the volatile,as well as fixed carbon present in this zone, or it will escape unburned.”Any scheme to admit secondary air above the fire should bearranged so that the air is controlled in accordance with the demand,in order to keep the excess air at a minimum and not decreasethe fuel-burning capacity of the furnace or decrease theover-all boiler efficiency by too much excess air. Several schemeshave been prepared to admit secondary air above the fire. Thesimplest is that of applying air-inlet thimbles in the sides of thefirebox and the effectiveness of this should be fully explored.Some studies have been made of the introduction of preheated airby means of blowers. Actual tests have been conducted on onerailroad by using blowers without air preheating, but so far nodefinite advance has been made. It is possible that the cost ofsuch a scheme may be justified from the standpoint of smokeelimination alone.F r o n t - E n d D e s i g n a n d D r a f tBecause of the very high draft required in a locomotive boiler,the proportion of the draft-making equipment in the smokeboxhas received much attention in recent years and a great manytests have been conducted to discover the most efficient front-enddesign.It is well known that most of the large railroads in the UnitedStates have conducted many front-end tests in recent years.The best arrangements arrived at differ considerably in design.The important result, however, is that the efficiencies of the draftarrangements have been increased by handling greater quantitiesof gases with lower back pressure, and that it has been possibleto increase the diameter of the stack to a considerable extentwithout causing the trailing of smoke, which is undesirable fromthe standpoint of signal observation.Curves are given in Fig. 5, which show the equivalent evaporationplotted against back pressure. This curve, test ZM , showsthe improvements gained by the use of an improved front enddeveloped for the New York Central class JIB locomotives ascompared with the standard front end.S u p e r h e a t e rOf all the improvements made on the locomotive, since GeorgeStephenson invented the first one, the superheater holds the firstrank. Its great success has been due to the fact that it attacksthe heat cycle at a point where the losses are the greatest, i.e.,in the cylinders, by the elimination of cylinder condensation duringadmission and expansion and re-evaporation at exhaust.Of the many tests made that have proved the beneficial effectsof high superheat, those conducted by the Pennsylvania Railroadhave been the most complete and conclusive. In his report11 onthe performance of the superheated passenger locomotive E6s,C. D. Young presented a most thorough analysis of the beneficialeffects obtained by the use of superheated steam. The followingsummary is quoted therefrom:“The application of the superheater to this locomotive increasesits economy from a minimum of 23 per cent to a maximum of 46per cent, the economy increasing with the increased power requiredof the locomotive.“It was found that 30 per cent higher capacity was derivedfrom the E6s locomotive when using superheated steam than withthe same size and type of locomotive using saturated steam.”This result was obtained with a comparatively low superheat,of 200 to 225 F, as compared with present-day practice. Thisshowed an average increase in economy of 1.15 to 2 per cent foreach 10 F increase in superheat. Experience and tests haveshown that this rate of increase in economy holds good up to thelimits of present acceptable practice of 350 to 400 F superheat.That every effort must be made to maintain highest superheattemperature is apparent.This problem has become more and more difficult as the availableheat for superheating has been reduced because of the highheat absorption in the large fireboxes of modern locomotives. Tocompensate for this, much larger superheaters have been foundnecessary and the introduction of the type E superheater was anatural development. This type has been used on most modemlocomotives which have been built during the last fifteen yearsin America.Because of the great influence that the superheater design hasupon the efficiency and capacity of both the cylinders and theboilers, considerably more space could be devoted to the discussionof superheater design than is here available.A great deal of research work and testing have been done withmany different types of superheater units to discover the unitwhich will give the maximum superheat with the lowest possibledraft loss and steam pressure drop, which is at the same timepractical and keeps weight, first cost, and maintenance at a minimum.The improved type E superheater is a very excellent arrangementas it gives a combination of maximum evaporating andsuperheating surfaces coupled with the greatest possible gas aresthrough the boiler and steam area through the superheater.This assures high sustained superheat at low as well as high ratingwith minimum draft and pressure loss.F e e d w a t e r H e a t i n gA feature of great value in obtaining sustained capacity of theboiler, which may only be mentioned here, is the beneficial effectof feedwater heating. The increase in economy or power outputof a locomotive ranges from 8 to 14 per cent through the recoveryof the heat in the exhaust steam that otherwise would be wasted.The feedwater heater is now well recognized as necessary foreconomical locomotive operation.C o n c l u s i o nIn conclusion it may be said that the modern locomotive boileris a very effective steam generator. Boilers15 which can producehighly superheated steam at a rate of 1 lb equivalent evaporationper hr per 1.3 to 1.4 lb of total boiler weight, compare veryfavorably with stationary boilers of about the same capacitywhich weigh about four times as much, or 6 lb per lb of steamproduced not including stack, breeching, brickwork, or draft fans.” Test Bulletin No. 21, Nov. 4, 1912, pp. 82-89, 150-151.,s Class MIA, Pennsylvania Railroad; class J3, New York CentralRailroad.
392 TRANSACTIONS OF THE A.S.M.E. JULY, 1940The weight of the locomotive boiler cited includes the boilercomplete, superheater, smokebox, front end, stack, stoker, grate,and water.While continued efforts must be made further to improve theboiler, clearly, it is the engine which deserves the most attention,as its thermal efficiency is so low that even a slight improvement isimportant. This may mean less simple mechanical parts than inthe present reciprocating engine, but the mechanical-maintenanceforces of the American railroads have proved to their great creditthat very difficult mechanical problems, such as those connectedwith the maintenance of Diesel and electric locomotives, can behandled successfully.This gives hope that apparatus and equipment proposed for theimprovement of the steam locomotive will receive favorable considerationin the future, and that the hazards of added complicationswill not be considered as formidable as they onceseemed.A c k n o w l e d g m e n tThe author wishes to express his appreciation to F. W. Hankins,assistant vice-president, chief of motive power, PennsylvaniaRailroad; P. W. Kiefer, chief engineer, motive power androlling stock, The New York Central System; Frank Russell,mechanical engineer, Southern Pacific Railroad; and E. E.Chapman, mechanical assistant to vice-president, Atchison,Topeka, and Santa Fe Railroad, for their courtesy in supplyingthe test data used in plotting the curves and for permission to usethe data in this paper. Acknowledgment is also made for theassistance rendered by Charles Guarraia in preparation of thecurves.
BRANDT—THE LOCOMOTIVE BOILER393TABLE 1GENERAL DIMENSIONS AND BOILER RATIOS OF SIX-COUPLED LOCOMOTIVES
394 TRANSACTIONS OF THE A.S.M.E.JULY, 1940TABLE 2GENERAL DIMENSIONS AND BOILER RATIOS OF TEN-COUPLED LOCOMOTIVES
BRANDT—THE LOCOMOTIVE BOILER395TABLE 3GENERAL DIMENSIONS AND BOILER RATIOS OF EIGHT-COUPLED LOCOMOTIVES
396TRANSACTIONS OF THE A.S.M.E. JULY, 1940T A B L E 4G E N E R A L D IM E N S IO N S A N D B O IL E R R A T IO S O F E IG H T -C O U P L E D L O C O M O T IV E S
BRANDT—THE LOCOMOTIVE BOILER397TABLE 5GENERAL DIMENSIONS AND BOILER RATIOS OF EIGHT-COUPLED LOCOMOTIVES
398TRANSACTIONS OF THE A.S.M.E. JULY, 1940T A B L E 6 G E N E R A L D IM E N S IO N S A N D B O IL E R R A T IO S O F A R T IC U L A T E D L O C O M O T IV E S
BRANDT—THE LOCOMOTIVE BOILER 399DiscussionR. W. A n d e e s o n . 14 In his paper, the author clearly showsthe importance of locomotive design ratios and successfullypoints out the limitations of formulas advocated by variouslocomotive-boiler authorities. Such limitations are primarilydue to the lack of test data. For modern boilers, this in turnnecessitates yet further approximations in the present inadequateformulas which must be used as a basis of design. Locomotiveboilers are now being subjected to greater demands than everbefore and the performance required will certainly not be lessenedto ease the situation.Weight and clearance dimensions immediately fix limitationswhich cannot be exceeded and which have the definite effectof hindrance in the design from its inception. However, inspite of these limitations and with the admittedly inadequatedesign formulas, filled as they are with estimated coefficients,boilers have been and are being built which generate more thanthe calculated quantity of steam, although the ratios between thegrate areas, flue areas, firebox volumes, heating surfaces, etc., onsuccessful boilers, vary within wide limits from the steam-gen-erating viewpoint. However, when such boilers require morethan the usual amount of attention considered necessary to keepthem in proper condition, they can hardly be classified as beingsatisfactory for continuous operation.All these conditions certainly point to the necessity of a centraltesting plant for such jobs. The experiments on the designformulas and ratios would no doubt take several years. Independentinvestigations and tests are often unsatisfactory dueto lack of adherence to standard test codes and methods of collectinginformation.The high draft-tube readings which are obtained in front-endexperiments on some railroads lead others to try similar arrangementsonly to find that the new application could not survivetransplanting. It would have been much cheaper to borrow thedraft tubes, providing a standard measuring device for testing theexisting arrangement.If a series of boilers of various proportions were developed insuch fashion, the major problem,namely, availability, isthen only started. Modern locomotiveshave an exceptionallyhigh first cost. Underpresent demands, boilers requireconsiderably more thanthe usual amount of attentionin roundhouses and shops.The metallurgist is being drawnfurther into this problem and itis his responsibility to determinethe physical and chemicalproperties of the boiler steelswhich will be capable of withstandingpresent-day loads.He may be the one who will berequired to tell the manufacturersto set the side sheets ata certain slope in order to preventwarped plates and leakystay bolts. Continual fireboxrepairwork should not be anecessary evil attached to 300-lb-pressure boilers; to eliminatethis condition a thorough study should be made of variousfurnace designs and the proper materials to use in their construction.The engine portion of the locomotive has always received thegreatest amount of attention from the designer’s viewpoint.Consequently, the boiler is often changed to accommodate certainother parts which no doubt could have been altered to avoidaffecting the boiler design. For instance, the trailer-truck designlimits the grate and ashpan arrangement but, if the furnace designwere given the attention it should have on modern locomotivesand every effort made to have the trailer come withinthe limits specified, there would undoubtedly be a considerablesaving realized in firebox, grate, and ashpan maintenancecharges.The performance of high-speed engines on long runs has createdmany problems in regard to lubrication and materials which mustbe solved. It will take a lot of coordinating to accomplish this.E. G. B a i l e y . 16 The writer will confine his discussion to onephase of this paper, applying the data therein presented to themethod of comparison of steam-boiler performance, covered byhis paper16 on that subject.Throughout his paper the author has very properly mentionedthe question of absorption efficiency and combustionefficiency, or total boiler and superheater over-all efficiency, whichis in reality the product of the other two. The data given inhis Figs. 13 and 14 are sufficiently complete to show wherein thedifference lies between combustion efficiency and absorptionefficiency, both relating to coal-fired boilers. However, in Fig.10 he gives data of an oil-fired marine boiler which happens to bethe same as boiler F, Table 3, in the writer’s paper,16 and alsotwo oil-fired locomotive boilers, Southern Pacific AC4 and SantaFe 3766. The difference between the efficiencies of these and15 Vice-President, The Babcock & W ilcox Com pany, N ew York,N . Y . M em. A .S.M .E.16 “ Steam-Boiler Performance and a M ethod of Comparison,”by E . G. Bailey, Trans. A .S.M .E ., vol. 62, July, 1940, pp. 367-378.14 Superintendent of M otivePower, Chicago, Milwaukee, St.Paul & Pacific Railroad Company,M ilwaukee, W is.
400 TRANSACTIONS OF THE A.S.M.E. JULY, 1940TABLE 7the oil-fired marine boiler is outstanding, and further data as tothe breakdown of this efficiency difference would be interesting.Fig. 16 of this discussion includes a typical pulverized-coalfiredstationary boiler, as represented by test B-l, Table 2 of thepaper,16 and test F-l for an oil-fired marine boiler from Table 3of the same source. The latter has been calculated to show thepercentage of heat absorbed in the different sections of the unit,although the official efficiency tests cover only the over-allefficiency, as is plotted in Fig. 10.16 In addition to the datawhich were plotted from Pennsylvania Railroad class MIA, theauthor’s Fig. 13, and the New York Central class JIB, Fig. 14,the writer has also gone back to the data of Goss’s tests at Coatesvillein 1912 and selected the one with the most representativemaximum rating giving complete results on a coal-fired radial-F i q . 18P u l v e r i z e d - C o a l - F i r e d S t e a m o t iv e B o i l e r , S M 4 L
BRANDT—THE LOCOMOTIVE BOILER 401T A B L E 7 (C o n tin u e d )stay-bolt firebox, in which Dr. Goss determined the heat absorptionin the firebox separately. From Hitchcock,17 the writer hasalso selected two road tests on locomotives conducted in 1902,from which sufficient reliable data were obtained to plot the absorptionefficiency and the over-all efficiency, but without meas-17 “ Road T ests of Consolidation Freight Locom otives,” by E . A.Hitchcock, Trans. A .S.M .E., vol. 25, 1904, pp. 550-588.ured distribution between the firebox and the flues. Both theGoss and Hitchcock tests were without superheaters. Also fromthe paper,1* test A-2 of the French locomotive, with one half thetubes plugged, falls directly in line as to rate of output with thePennsylvania class MIA at 345 lb of coal fired per sq ft of grateper hr. The other point of Pennsylvania class MIA plotted istaken to duplicate exactly the equivalent-surface area of the New
402 TRANSACTIONS OF THE A.S.M.E. JULY, 1940York Central class JIB at its maximum rate. It is to be notedthat they come closely together and are quite consistent, whilethere is an indication that the tests on the French locomotivewith its small firebox showed somewhat less efficiencies.Superposed on these curves are also data from the oil-firedSteamotive boiler as tested at Schenectady and reported in apaper18 by E. G. Bailey, A. R. Smith, and P. S. Dickey; from theoil-fired Steamotive boiler on the Union Pacific steam turboelectriclocomotive which has been described18 recently; as well asfrom tests on pulverized-coal-fired Steamotive boiler, conductedat Erie, Pa., during 1939.The Steamotive generators are high-pressure high-temperatureunits, as indicated in Table 7 of this discussion, and the slopesof the curves after the gases enter the superheater and economizershow very high rates of heat absorption due largely to the highmass flow and the suitable arrangement of the tubes with respectto gas velocity and gas temperature. A cross section of theUnion Pacific oil-fired Steamotive boiler is shown in Fig. 17 andthe pulverized-coal-fired unit in Fig. 18.Fig. 19 gives data from most of the units listed in Table 7 onthe over-all efficiency basis. This includes boiler, superheater,economizer, and air heater.The pulverized-coal-fired stationary and Steamotive units,as well as the oil-fired marine and Steamotive units show onlythe normal difference between the absorption efficiency andthe total efficiency, but the coal-burning locomotives show amarked diminution in efficiency due largely to cinder loss, whichincreases in general with the increased rate of firing. However, itis noted that the New York Central at 157 lb of coal fired per sqft of grate per hr comes within the same range of over-all efficienciesas were obtained from Goss’s tests at 73 lb of coal persq ft, and the Hocking Valley tests at 85 and 95 lb, respectively.In the author’s Figs. 13 and 14, by means of dotted lines, heshows the heat absorbed in the firebox. His treatment of that18 “Steam otive,” by E. G. Bailey, A. R . Smith, and P. S. Diekey,Mechanical Engineering, vol. 58, December, 1936, pp. 771-780.18 “ Progress in R ailw ay M echanical Engineering, 1938-1939,"Report of Com m ittee R R6, Railroad Division, A .S.M .E ., MechanicalEngineering, vol. 62, December, 1939, pp. 863-875.subject in the text indicates definitely that he has the correctconception of the variation of this figure with rates of heat available,rather than the use of a constant figure of 55 lb of steamper sq ft of firebox per hr, which was evidently based on Goss’stests, as reproduced herewith. Fig. 20 expresses per cent of heatabsorbed in the firebox as a function of the Btu available persquare foot of actual heating surface. This gives data from Gossand the French locomotive tests as plotted points. It also givesa curve, calculated from the Hudson-Orrok formula20 for which abasis of 13,900 Btu of coal with 11.8 lb of air per lb of coal, hasbeen selected, which corresponds closely to 19 per cent excess airand 3600 F adiabatic temperature. Broido’s average curve alsois shown within the range in which it is given in his paper21 beforethe Society. It would seem from this that the author’s dottedlines of Figs. 13 and 14 may be somewhat high, and the curvesof Figs. 16 and 19 of this discussion are plotted on the basis ofbeing taken from the Orrok curve. One could readily plot in Fig.16 the curves from Brandt’s data as shown in Fig. 20. Thiswould indicate a relatively higher rate of heat absorption in thefirebox than seems to exist on other types of furnaces and, evenat the same rates of Btu available, they are markedly higher thanis indicated by Goss and the French locomotive, both of whichwere based upon actual weights of water evaporated by the fireboxsurface.It is doubtful if this question of distribution of heat absorptionbetween the firebox and the flues of a locomotive boiler can be accuratelydetermined by gas-temperature measurement. Thedifference in the size of the flues, the resistance, gas velocity, andstratification of both quality of gas and temperature make itdifficult, even though a device could be used which would getthe true gas temperature. The cold surroundings of the tubesheet and flues will influence any thermocouple readings, evenwith the high-velocity method, to the extent that the data wouldbe questioned. Therefore, it seems that the method used by20 “Estim ation of R adiant-H eat Exchange in Boiler Furnaces,”by G. A. Orrok and N . C. Artsay, Combustion, vol. 9, no. 10, April,1938, pp. 37—42.21 “ Radiation in Boiler Furnaces,” by B . N . Broido, <strong>Transactions</strong>A .S.M .E ., vol. 47, 1925, pp. 1123-1147.
BRANDT—THE LOCOMOTIVE BOILER 403Goss and the French locomotive may be the only one in whichsuch distribution can definitely be determined. Knowledge ofthis, however, only affects the detailed slope of the curve at thelower portion, when plotted on the equivalent-surface basis.The upper points on both the absorption-efficiency basis andover-all efficiency basis are equally reliable from well-conductedtests and show the important part of the over-all efficiency andthe rate of heat input.The author brings out clearly the limited area for gas flowentering the tubes and flues of the locomotive boiler. On a watertubearrangement of heating surface, such as used in the Steamotive,this area can be made anything desired within reasonablelimits. The designs now operating have more than twice thearea on a given capacity basis than is possible on the locomotiveunits as shown by the author.A further study of draft loss through the respective units is alsoof interest. The different tests in the writer’s paper16 give theover-all draft loss including the air heater, if any, burners, or fuelbed, draft loss through boiler settings, superheater, economizer,and air heaters, if any, as the total pressure drop. It would behelpful if in his closure the author could supply the data in a formwhich might be compared more readily than that as given inFig. 5, showing back pressure.J. M. D u n c a n . 22 The author reminds us that, in currentlocomotive practice, combustion rates and heat releases are farhigher than any realized commercially in stationary plants.If industrial and central-station heat-power engineers could approachthese rates, they would advance their art by materiallyreducing capital costs.Pennsylvania Railroad locomotive class MIA appears tobe designed for a heat liberation of 250,000 Btu per cu ft of furnacevolume per hr, burning 121 lb of coal per sq ft of grate areaper hr. Figs. 8 and 12 of the paper indicate that under theseconditions combustion is substantially complete, the dry flue-gasloss being moderate, but the unbumed-coal loss is 30 per cent.The furnace heat absorption is 41 per cent of the heat liberated,and the average heat absorption in the furnace is about 87,000Btu per sq ft of furnace walls per hr. Data on furnace temperaturesand excess air are not given. The writer calculates theexit furnace temperature at 1800 F and the excess air at 70 percent. These figures may be considerably in error as essentialdata are lacking. Unbumed-coal losses for other locomotivesare above and below this 30 per cent figure at the same heat-releaserate. At this rate, New York Central locomotive JIBhas a loss of 12 per cent.The author’s objective is to develop means for increasing locomotivecapacity and efficiency. Any increase in efficiency accomplishedwithin existing weight and space limitations will,if present fuel-burning ability is maintained, automatically increaselocomotive capacity. Two opportunities for increasedefficiency lie in reduction of dry-flue-gas loss and reduction ofunburned-coal loss. As pointed out by the author, convectionheattransfer is efficient. Improvements must be sought in furnaceconditions.If the underfeed or traveling-grate stoker can be adapted tolocomotive service, will not the unburned-coal loss be automaticallyalmost eliminated? The very fact that such large lossesare tolerated indicates that the sprinkler type is accepted as indispensablefor the large modern locomotive. But, if these othertypes can be adapted to this service, important advantages willbe realized in addition to reduction of unburned-coal loss. Thisis principally because with these other types furnace absorptionefficiency can be greatly increased.An increase in furnace-absorption efficiency would reduce dry-22 Petersburg, Va. M em. A .S.M .E.gas loss almost proportionally if excess air is unchanged. If theincrease is accomplished while reducing excess air, a further gainwill be made. The following relations are calculated for a NewRiver coal, assuming complete combustion with no air preheat:Furnace exit, -—Furnace absorption efficiency, per cent—>F20 per cent excess air 80 per cent excess air1500 .................................. 63 .............................. 462000.................................. 49 .............................. 262500.................................. 34 .............................. 4These figures indicate that excess air cannot be materiallyreduced without incurring slag accumulations in flues with manycoals which must be burned on railroads, unless furnace absorptionefficiency can be greatly improved. The writer believesthat the improvement must be brought about by a radical changein stoker design. This appears to be the author’s conclusionwhen he says:“From the studies made of this problem it is doubtful if thepercentage of heat absorption can be increased to much more than50 to 55 per cent of the heat liberated, by increasing the amountof firebox heating surface, because the amount of radiant energyabsorbed is limited by the effective surface of the fire bed andthe luminosity of the flames.”In regard to the effect of smoky flames the author says:“It has been demonstrated that the radiation from the flamesis largely due to incandescent particles of fuel and ash in theflame. The quantity and distribution of this radiating materialin the flames, together with the amount of firebox heating surface,determine the coefficient of emission or absorption. Thisexplains why boilers fired with oil give higher superheat; theless luminous flames of the oil fire will give up a smaller percentageof heat to the firebox by radiation, and the gases enteringthe flues are therefore hotter.”These remarks doubtless apply to a comparison of pulverized-coal and oil flames. But the facts cited tend to divert our attentionfrom the controlling influence of luminous flames in reducingover-all radiant-heat absorption in stoker-fired furnaces whereverthe grate is not obscured by an arch. The luminous flame will,it is true, lose more heat than the nonluminous flame (if highturbulence is maintained) but it will at the same time hide theincandescent and much hotter stoker fire from the heat-absorbingwalls to a great extent. The author’s remarks do apply to thestoker-fired-locomotive furnace shown in Fig. 3, where the luminousflames created by the sprinkler-type stoker are of advantagebecause that stoker requires an arch to reduce the unburned-coalloss. In such a furnace clear flames would be a disadvantage.Data of Fig. 3 do in fact indicate the presence of highly luminousflames. The velocity at section C is materially lower than atsection B although the gas areas are practically equal. If flameswere completely transparent, temperatures would be nearly equalthroughout this section of the furnace.The importance of clear furnace atmospheres in underfeedstoker-firedfurnaces was forcefully impressed upon the writerwhen observing some tests using a high-volatile coal. Operatorshad been unable to obtain smokeless combustion at moderatelyhigh rates. Boiler exit temperatures were higher than theyshould have been although excess air was less than guaranteed.A test operator then took charge for higher rate tests. Whilemaintaining the same percentage excess air as before, he produceda transparent furnace atmosphere at considerably highercombustion rates and the excess boiler-exit temperatures werereduced. It was obvious that a large increase in the percentageof furnace heat absorption had been obtained. This must havebeen due to the removal of smoke and luminosity from theflames, thus allowing the fuel bed to “see” the furnace waterwallsand roof.
404 TRANSACTIONS OF THE A.S.M.E. JULY, 1940During those tests it occurred to the writer that furnace heatabsorption and over-all boiler performance could have been increasedin spite of smoky furnace atmosphere if the “hydraulicmean radius” of the furnace were reduced by installing tubesspaced, say, on three- or four-foot centers throughout the upperportion of the furnace. (The vertical screen used to divide manymodern powdered-coal furnaces, e.g., Fisk Street, appears to be adevelopment of this sort, perhaps made more necessary by theessentially opaque nature of the flames in such furnaces.) Thedegree to which this could be carried out without prejudice to thefurnace function depends upon the effect upon combustion. Hasthe author data upon the relation between furnace temperatureand completeness of combustion—of carbon and hydrocarbons aswell as of CO?The sprinkler-type stoker seems inherently incapable of realizinghigh radiant-heat absorption. Its fuel bed is probably lowerin surface temperature than that of the underfeed or travelinggratetype. Heating of green coal should not be spread over thefuel bed if a hot surface and a smokeless furnace atmosphere aredesired. The other types of stokers confine the distillation ofgreen coal to a small section of the fuel bed and so leave a largearea of highly incandescent coke to radiate to the furnace walls;they also produce less smoke and consume it more rapidly. Suchstokers do not require the arch shown in Fig. 3, which completelyobscures the fuel bed from most of the furnace walls even ifsmoke is not produced.Fumace-gas turbulence has been recognized as desirable toassist in attaining complete combustion. The writer believes itshould be sought also in order to insure maximum radiant heattransfer at all times that an absolutely clear furnace atmosphereis not maintained. Evidently the gas velocities shown in Fig. 3bring a high degree of turbulence. The temperature drop indicatedby velocity drop is several times what could be caused byconvection heat transfer. Smoky flames require high turbulencesuccessively to turn new envelopes toward cold furnace walls ifhigh radiant heat transfer is to be realized. The importance ofturbulence therefore is great even if combustion (of CO) is completewithout it, and especially where small excess-air ratios tendto cause hazy or smoky conditions in the furnace. But thesprinkler type of stoker has some critical rate of furnace-gas turbulenceabove which unburned-coal losses become prohibitive.Turbulence in furnace gases would not adversely affect the underfeedor traveling-grate stoker in this respect.Thus the underfeed and traveling-grate stoker appear to becapable of increasing locomotive efficiency, and therefore capacity,by increasing furnace-absorption efficiency and reducing unburned-coalloss. Stationary-plant experience does not yetextend economical coal-burning capacities to the rates evidentfrom an inspection of the author’s Tables 1 to 6. However, asthe author has noted, furnace-wall area is not the controlling factorin radiant heat transfer. The controlling factor is the areaof the hot body, and even more, its temperature. Thus a largergrate area could with advantage be adopted, sacrificing furnacewallarea as necessary to obtain it, provided the furnace wallcould see the fuel bed so installed. This larger grate area wouldalso be helpful in reducing such slight tendency as there would be(slight, that is, compared to unburned losses now accepted inlocomotive operation) for fuel to blow off the grate. In this connection,it would be interesting to know whether the higher combustionefficiency shown in Fig. 8 for locomotive NYC-J1B is dueto the lower rate of coal combustion per square foot of gratearea, which is inferred from the data given in Table 1.It is suggested that a design for high efficiency and capacityshould aim at:1 Feeding coal in such manner as to throw no fines up into thefurnace atmosphere2 Confining distillation of volatile constituents to a smallarea of the fuel bed.3 Maintaining a large incandescent coke area within full viewof the furnace walls.4 Operating at high rates with about 20 per cent excess air,with little or no smoke and a nearly nonluminous flame.5 High turbulence in the furnace, with furnace designed forsmallest practicable volume-area ratio to increase furnace heatabsorption if smoky flames cannot be avoided.Such a design should operate with little or no unburned-coalloss and with very low dry-flue-gas loss. If applied to locomotivePRR-M1A a reduction in fuel consumption of over 30 per centshould be realized. Designed capacity would in that event berealized with a fuel-burning rate of about 80 lb per sq ft of gratearea per hr. Reduction to this moderate rate would, as shown bythe author’s data, considerably reduce engine back pressure, stillfurther increasing efficiency and capacity. These possibilitiesare undoubtedly known to locomotive designers. The writerwould appreciate knowing the principal difficulties which havestood in the way of their realization so far.The author’s paper suggests that there is a great opportunityfor the application of rational design methods to locomotive-boiler practice. It is evident that a large amount of data awaitssystematic analysis, following which the several combinationsof furnace, stoker, and boiler indicated by that analysis asworthy, could be tested at moderate cost to achieve a fine commercialdesign.R. E k s e r g i a n . 23 Not only has the author given a comprehensivecontribution on locomotive-boiler characteristics and limitations,but he has pointed out some pertinent factors which havenot been clearly recognized before. One outstanding factor isthe tremendous influence of increased gas area through the boileron evaporation capacity and its tendency to sustain fair efficienciesthrough a wide range of firing rates. The slope of theboiler efficiency against firing rate is particularly significant asto the maximum evaporation capacity. On the basis of a linearvariation of boiler efficiency against firing rate, we must necessarilyhave a parabolic evaporation curve against firing rate.The maximum evaporation occurs, then, at a firing rate at whichthe boiler efficiency is just one half the efficiency at zero firingrate. This means that, to obtain high firing rates at maximumevaporation, the slope of the efficiency curve against firing ratemust be flat. Pennsylvania Railroad locomotive MIA showsthis to a predominant degree and, with this characteristic, wenote the corresponding large gas area through the boiler as comparedwith some other types.One major feature of the advantage of the steam locomotiveover all other types of motive-power units is its considerableoverload capacity. Locomotives under normal operation do notperform at firing rates corresponding to their maximum evaporativecapacity. The normal rating may either be limited to adefinite over-all efficiency or to a firing rate corresponding to somepercentage of the firing rate at maximum evaporation. In a welldesignedboiler, both aspects are compatible. Mr. Fry7 assumesthe boiler efficiency to vary as a straight line against firing rateand arrives at a parabolic curve for the evaporative capacityagainst firing rate. This assumption is well borne out in thispaper, Figs. 4 and 10. On this basis if F is the over-all boilerefficiency and x the firing rate in pounds of fuel per hourF = m — nxand, if H is the heating value per pound of fuel, the total evaporationis83 Consulting Engineer, Edward G. Budd M anufacturing Company,Philadelphia, Pa. Fellow A .S.M .E.
BRANDT—THE LOCOMOTIVE BOILER 405If the normal firing rate is taken at some percentage k of thekm , .maximum firing rate then x = kxm -- — and, since the ratio271of normal to maximum firing rate isE _ mx — Tix2£max TO2/4n2? = (2 — k)kEm*xWith k = 0.5 then E = 0.75 i?max. If fc = 0.66, then E =0.89 i?max. This shows that firing rates exceeding 50 per centof the firing rate, corresponding to maximum evaporation, rapidlyapproach the maximum capacity of the boiler.Another limitation of firing rates is dependent upon maintaininga fair over-all boiler efficiency F. In fact, if we limit thisover-all efficiency to Fo, thenwhich gives the per cent firing rate relative to that at maximumevaporation corresponding to the limited efficiency F0.For example referring to the author’s Figs. 4 and 10, theK4S locomotive, which is representative of good average performanceand, with a boiler efficiency limited to 65 per cent, thecorresponding firing rate is roughly 50 per cent of the maximum.Considering this as a normal firing rate, the maximum evaporativecapacity is roughly 33 per cent greater. But with this overloadthe boiler efficiency rapidly falls.With Pennsylvania Railroad locomotive MIA, the relativelysmall slope permits a large overload capacity but at the expenseof relatively poor efficiencies at the lower firing rates when comparedwith the K4S, and similar types.It would seem, therefore, that boiler proportions which permithigher over-all efficiencies than are found in the MIA, butwith less slope of the efficiency-firing-rate curve as with theK4S type, are more desirable, thus giving higher efficiencies atnormal firing rates with greater overload evaporative capacity.It is of interest to note that, in normal locomotive operation,the heat in fuel fired per cubic foot of firebox volume is in theorder of 250,000 Btu per hr. In the MIA this reaches over650,000 Btu per hr at a combustion efficiency of 50 per cent. TheVelox boiler attains the latter value at a combustion efficiencyaround 90 per cent, by means of injecting the combustion airunder pressure. The pressure in the firebox is in the order of30 lb per sq in., effected through a compressor driven by an ex-haust-gas turbine. It appears that, in the orthodox locomotiveboiler, greater combustion efficiency can be obtained throughturbulence of the injection air above the grate as suggested by theauthor.In the conclusion to the paper, he cites that it is the enginewhich deserves the most attention as its thermal efficiency is solow that even a slight improvement is important. This is truefrom two aspects, engines can work on improved cycles, i.e., withhigher pressures and corresponding temperatures, providedthrottling losses can be reduced by more efficient cylinder design,and by improved cylinder performance at high speeds.On the other hand, it is important to point out that, based onthe availability of steam supplied to the engine at orthodoxboiler pressures, engine efficiencies are remarkably high. Thefollowing analysis of cylinder performance with orthodox boilerpressureand temperature limitations is of interest. The datarelate to a 4-6-2 type locomotive with cutoff at 25.5 per cent.The steam conditions are given in the following table:Thus, the cylinder efficiency based on the available energy175supplied is, E c = = 80 per cent; the cylinder losses amountto 20 per cent of the available energy across the engine. However,these losses have a much smaller ratio, when consideringthe availability of the power plant as a whole, based on the availabilityof the combustion gases. The largest loss from anavailability aspect occurs in the locomotive boiler itself due tothe large differences in flame and gas temperatures and steamtemperatures in orthodox locomotives. The largest increase ofthe unavailable energy components is due to heat transfer. Raisingthe boiler pressure and thereby the steam temperature topressures exceeding 600 to 700 lb per sq in. reduces this loss, andresults in marked improvement in over-all thermal efficiencies.Thus, cutting down the unavailable heat-transfer losses in theboiler really amounts to increasing the Rankine efficiency of theengine by operating on a higher pressure-temperature cycle. Toaccomplish this in any marked degree requires a radical change inboiler design and cylinder design as well, such as including compoundingand other features, resulting in a greatly modified typeof locomotive.Another opportunity for increasing the over-all availability isin lowering the back pressures at the entrance to the exhaust.The author has pointed out the significance of this feature in connectionwith the boiler design.J . R. J a c k s o n . 24 The performances of the steam boiler asdescribed by the author are predicated on the evaporation ofwater into steam and involve the factors of fuel and water. Inlocomotive practice, the control of the grades of fuel supplied isfairly well in hand on most railroads, but the supply of water,as regards the foaming characteristics, is largely as nature suppliesit. While it is common practice to treat locomotive-boilerwaters chemically to reduce scale and corrosion within theboilers, no practicable method of treatment for the control offoaming within the boiler is known. So-called antifoam compoundsaid somewhat in foam control with certain waters, andit is common practice to control foaming by blowing boilers atterminals and on the line. However, in territory west of the MississippiRiver, we experience a seasonal foaming condition of thesurface boiler-water supply which constitutes a serious operatingproblem.14 Engineer of Tests, Missouri Pacific Railroad Company, St.Louis, M o. M em . A .S.M .E.
406 TRANSACTIONS OF THE A.S.M.E. JULY, 1940It was for the purpose of making some studies of the actualconditions of foaming within a locomotive boiler that the MissouriPacific Railroad in collaboration with the Electro-ChemicalEngineering Corporation undertook a series of tests and observationsat St. Louis, in August, 1939. For these tests a locomotiveboiler was fitted with bull’s-eye sight glasses in the domecover and the interior of the boiler was illuminated with special1000-w electric lamps to permit making observations and takingmotion pictures of the interior of the boiler within and immediatelyunder the dome. A series of standing locomotive testswith different arrangements of steam driers and foam-controllingdevices was carried out. The motion-picture record disclosedthe following:(а) The relatively rapid movement of the surface water in theboiler in a forward direction, the rate of movement being moreor less proportional to the rate of evaporation.(б) The swelling of the surface water with the opening of themain throttle.(c) The development of a spongy or bubbly condition orstate of the surface water accompanied progressively by a decreasein the steam space under the roof sheet at the dome entrance;the increase in the velocity of steam movement fromthe firebox end of the boiler toward the dome; the picking offof the expanded or frothy surface water at the dome restriction;the actual splashing of the water particles and foam carried bythe high-velocity steam against the dry-pipe extension and upinto the dome against the dome cover; and finally the actualcarry-over of water and foam into the dry pipe.(d) The instantaneous subsidence of the expanded and foamysurface water within the boiler with the closure of the mainthrottle.(e) The control of foaming and prevention of carry-overthrough the medium of overflow into a foam-collapsing trough,located within the boiler at the surface of the water immediatelyunder the dome and extending along the center line of the boilertoward the rear, and discharge from the trough through an electromaticblowoff connection to the outside of the boiler.The standing tests were later supplemented by road testsbetween St. Louis and Kansas City during which additionalmotion pictures were taken of the interior of the boiler.L. B. J o n e s .“ As a matter of interest, the writer will reviewthe history of the development of the boiler referred to in thepaper as the Pennsylvania MIA, which is shown to have exceptionallyhigh evaporation capacity.The first of these boilers to be built was not successful, so muchwater being carried over with the steam that no superheat wasobtained. After some experiments, it was found that the performancewas considerably improved by lowering the waterlevel, the indications being that, if the steam space could be increasedsufficiently, the trouble would be overcome. The boilerwas accordingly redesigned, with a lower crown sheet and thedome barrel course raised slightly. The steam space was increasedfrom 150 cu ft to 199 cu ft which, expressed in per centof the total cubical content of the boiler, amounted to an increasefrom 16.5 to 21 per cent. The total evaporative heating surfacewas reduced from 4499 sq ft to 4319 sq ft, and the superheatingsurface was reduced from 2283 sq ft to 2052 sq ft. In spite ofthese reductions in surface area, the evaporative capacity of theboiler was increased, and a steam temperature of 730 F wasmaintained at very high rates of evaporation.The author’s comments on the necessity for liberal fire-tubearea are deserving of special attention. It is pointed out thatthe energy required to move the furnace gases through the fluesincreases with the fourth power of the weight velocity, which!S Engineer Tests, Pennsylvania R .R ., Altoona, Pa. M em. A .S.M .E .involves the expenditure of power in the shape of cylinder backpressure at the exhaust nozzle. It is also pointed out that areduction of 1 lb back pressure is equivalent to an increase of4 lb in steam-chest pressure for average rates of working. Whenwe consider the relatively low value of tube heating surface ascompared with firebox heating surface, it becomes evident thatthe locomotive as a whole can be materially benefited by anattack on the space between the front and back flue sheets, in away which will provide greatly increased flue-gas area, with apossible accompanying increase in superheat area, without doingany damage because of reduced tube evaporating surface, whichis not needed.We are inclined to take issue with the author on one point,namely, that the gas area can be increased at the expense of waterspace in the water legs of the firebox. While many boilers areoperating with water space as low as 5 in., we believe that boilermaintenanceexperience, compared with boilers having moreliberal water legs, will eloquently support the wider space, withits accompanying longer stay bolts and reduced angularity offlexure. Important as flue-gas area is conceded to be, it shouldbe obtained in other ways than by sacrificing water space alongthe sides of the firebox.In Figs. 6 to 10, inclusive, the author has tabulated some interestingdata on boiler and combustion efficiencies. Considerabledanger is involved in comparing boiler efficiencies from testsmade at different times and places, and with different fuels, especiallyat the high rates of combustion necessary in a locomotiveboiler. This is particularly true of the various Pennsylvanialocomotives reported. The test data for all these locomotiveswere obtained at the locomotive test plant, but the tests weremade at different times, using different methods of firing, andsomewhat different fuels, with the result that the relative boilerefficiencies plotted in the diagrams do not faithfully reflect thetrue characteristics of the boilers. We have found that, whenit is desired to compare conditions involving boiler efficiency, itis necessary to confine the source of fuel to one mine room orentry, and otherwise safeguard the handling of the fuel fromthe mine to the locomotive firebox. Two fuels of equivalentBtu content may show widely different boiler efficiencies in thesame boiler because of texture and friability, as well as othervariables.W. G. K n i g h t . 26 The author’s deductions as to the limitationof existing methods for calculating boiler efficiency are certainlycorrect. The writer feels that Mr. Fry’s formula7 would nodoubt be adequate if more data were available for the value ofthe constants involved.We have run standing tests on the Bangor and AroostookRailroad which would bear out the New York Central contentionthat front-end design and nozzle size can be tested in this mannerand properly adjusted for road service.The curve in Fig. 2 of the paper is interesting and has specialvalue due to its being drawn from data concerning so manyengines. Boiler diameter and gas area, of new power especially,could be more clearly considered after a study of data of this kind.When considering the distance from the top of the crown sheetto the boiler shell, it is advisable to do everything possible to increaseheating surface in order to produce maximum boilercapacity and keep within the weight limitations. However,because of the general tendency of engineers to carry high waterrather than low, it is the writer’s belief that too high a crownsheet will decrease dryness of the steam, lower the superheat, andotherwise affect lubrication and general performance.We have found on the Bangor and Aroostook that a ratio of26 M echanical Superintendent, Bangor and Aroostook RailroadCompany, Derby, Me.
from 5 to 6, firebox volume to grate area, is decidedly advantageousas the road characteristics demand high boiler capacitiesfor freight service. It is also possible with large fireboxes toadjust the arch to decrease the high velocity of gases at pointA in Fig. 3 and bring them down to a value equal to or belowthe velocity in the tubes near the back tube sheet.During the last 5 years, we have tried several designs and anumber of different percentages of air openings in grates, ourlatest experiment being made on an application with 60 percent free air opening. As yet, we have not definitely proved itsadvantage since we are still changing the draft appliances andashpan arrangement to achieve better combustion efficiency.We feel that a gain will result from using this large percentageopening.Much has been said in the last year or so on the subject ofsecondary air for combustion. Whether it would aid the olderlocomotives without considerable change in their design is aquestion. It would seem at present that equal efficiency can beobtained by an increased grate area and proper changes in draftappliances.The general trend of all roads recently has been toward muchmore efficient draft appliances. We have tried to keep pace withthe ever-increasing demand for more horsepower by improvingfront-end design and decreasing back pressure. The improvementsmade along these lines have produced satisfactory results.A. I. L i p e t z . 27 The locomotive boiler as part of the steamlocomotive has the value advantage of automatic self-regulation;in other words, to a certain limit it adjusts its evaporation to thedemand of steam. This automatic feature is actuated bythe back pressure from the engine. For a given back pressure theamount of steam exhausted by the engine through the nozzle andthe draft of the boiler is fixed. A certain proportion of the combustiongases is then pushed through the flues and tubes of theboiler from the firebox into the front smokebox. This evaporatesa certain amount of steam, which in turn is exhausted by the engine.Thus the cycle is completed and then repeated. If thespeed and cutoff of the engine are varied, in accordance with thedemand upon the locomotive, the back pressure and the evaporationare varied—this is the automatic self-regulation feature.By assuming a certain back pressure and the resulting draft, andfiguring the amount of fuel burned in the firebox, it would bepossible to calculate the amount of heat which is thus generated.Being familiar with the laws of heat transmission, and dependingupon the gas velocities through the various sections as explainedby the author, it would be equally possible to evaluate the amountof steam evaporation. For another back pressure and anotherfire rate, a different amount of steam evaporation would follow;thus the curve of steam evaporation, as a function of coal firingand back pressure, could be established.It is evident that this way of figuring, although logical in itself,would involve a great many calculations on the basis of laws ofnatural phenomena, which are not always known. It is thereforesimpler and more reliable to establish these curves by testswith locomotive boilers and to plot the curves, as has been doneby the author in Figs. 4 and 5 of the paper. Likewise fromtests, the combustion efficiencies can be plotted, the boiler andsuperheater over-all efficiencies can be figured, and, for furtherstudy, depending upon the length of tubes, mean hydraulicdepth, etc., the heat absorption and various other factors can beestablished.The value of this paper consists of giving us concisely a completeseries of curves from reliable tests as material for study.The author did not attempt to draw any conclusions except to27 Chief Consulting Engineer, in charge of Research, AmericanLocomotive Company, Schenectady, N . Y . Fellow A .S.M .E .BRANDT—THE LOCOMOTIVE BOILER 407say that the present locomotive boiler is a very efficient steamgenerator, when compared to stationary boilers, especially takinginto consideration its simplicity and weight.However, the writer would like to call attention to the possibilitiesobtainable from a proper review of the author’s curves.From the foregoing statement of the automatic regulation of theboiler cycle, it is obvious that, in application to a locomotiveboiler with the same principal fundamentals of design, the efficiencyand production of the boiler should be more or lessuniform, depending upon certain ratios. These can be establishedfrom tests. In analyzing Figs. 7, 9, and 10, especially thelatter, it is evident that the efficiency curves are straight lines,as is well known from the investigations of Professor Goss andMr. Fry.7 Fig. 12 is still more interesting because it narrows thesystem of straight lines for a great variety of locomotive boilerstested in Altoona and in actual service on different roads. Italso brings out the fact that the Pennsylvania MIA locomotiveseems to be represented by a line about the average of all others.This, together with Tables 1 to 6 given in the paper, permitsmaking a comparison of the various ratios tabulated therein.Thus it can be seen that item 31, which is the gas area per squarefoot of grate, varies for these locomotives and for these locomotivesonly, between narrow limits of 1.14 and 1.41 (columns 3 and4 in Table 1; columns 1, 6, and 10 in Table 2; column 10 in Table4; columns 6, 7, and 9 in Table 5). For the class MIA locomotiveit is 1.39. Further, the ratios of firebox heating surface tothe total evaporating heating surface (item 40), of the totalevaporating heating surface in relation to the grate area (item42), and of the superheater heating surface in relation to thetotal evaporating heating surface (item 43), vary also betweenlimits which represent the best results of American practice.That these ratios are important and essential has been knownfor a long time by a great many investigators of American andEuropean locomotives.3’28’29 They are usually included in articlesdescribing new locomotives. This paper provides an opportunityto study these figures and to establish such ratios aswe might consider to be essential. Tables 1 to 6 will permitestablishing rules at least for the following boiler ratios: Theratio of the gas area through the boiler to the grate area; thefirebox heating surface to the total evaporating heating surface;the total evaporating heating surface to the grate area; thesuperheater heating surface to total evaporating heating surface.Of course, variations in these ratios are always necessary,depending upon the grade of fuel and local conditions. However,the writer does not believe that the difference in local conditionsjustifies the great variations in locomotive design whichprevail. Certainly, a certain degree of standardization can beintroduced for locomotives on American railroads.T. C. McBride.30 This paper indicates the inconsistenciesin the proportions of existing boilers and demonstrates the needfor further tests to establish the best proportions. The Colemethod3 for determining the evaporation to be expected fromlocomotive boilers, having the evaporation values based only onheating surface, is condemned as inadequate. Nevertheless, it isstated that “today these values are generally used by the locomotivebuilders and railroads.” With no comparable substitutemethod in sight, an effort should be made to adapt the old andalmost universally used method to present conditions.28 “D ie Eisenbahntechnik der Gegenwart,” by E . Briickmann,Berlin, 1920, Appendix.28 “ Handbuch des Dam pflokom otivbaues,” by Prof. Dr. Igel,Berlin, 1923, pp. 73-86.30 Consulting Engineer, R ailw ay Division, W orthington Pump &Machinery Corporation, Harrison, N . J. M em. A .S.M .E .
408 TRANSACTIONS OF THE A.S.M.E. JULY, 1940It is necessary to reach an understanding of the various termsused throughout the paper to indicate capacity, evaporation, etc.Referring to the first table of the paper, the Strahl formula neednot be considered because it is not used in this country. The“Cole evaporation” of this table might be defined as Cole’s conceptionof the maximum evaporation which boilers of about theyear 1910 could be depended upon to develop when in operationon the road. Dr. Lipetz, in his 1932 paper6 on locomotive ratios,endorsed such a definition but applied it to boilers built 20 yearslater. It is generally conceded now that this evaporation presumedby Cole was very high for the boilers of about 1910 and wasnot realized until some years later with boilers of better proportions;but today that is immaterial if proper coefficients are applied.The “actual test evaporation” of this table is the ultimateevaporation possible of attainment under the favorable conditionsof a standing test of short duration, after elaborate preparationshad been made. Often a number of attempts have beenmade in an endeavor to obtain the highest possible figure. Thesecould not be depended upon for road operation. The Coleevaporation should therefore be lower than the actual test evaporation;the fact that it is lower does not indicate inadequacy butrather confirms its adequacy for the purpose for which it wasintended.The Cole evaporation of the Pennsylvania Railroad K4Slocomotive is stated in this table to be 52,150 lb per hr. Theactual test evaporation of 65,400 lb given in Table 5, column 6for the K4S of 1914 should be compared to the Cole value. Thiswas only 25 per cent greater than the Cole, certainly not toogreat a margin for dependable operation on the road, as impliedin the definition of Cole evaporation. The much higher actualtest evaporation stated in the table for the Pennsylvania RailroadK4S; the actual test for the Pennsylvania Railroad MIA, 46per cent higher than the Cole; and the actual test for the NewYork Central J3A, 45 per cent higher than the Cole, all followdevelopments and improvements which place these boilers in alater class than was contemplated by Cole. They require theapplication to Cole evaporation values of a coefficient, such asthe “evaporation coefficient” /3, of Dr. Lipetz’ paper.5However, the maximum evaporation of the greatest importance,is that now demanded from modern boilers in operation onthe road. A fairly accurate estimate of this evaporation may beobtained by using the pumps of the Worthington heaters aswater meters. The pump speed, noted when the locomotive isoperating at the highest power output likely to be demanded ofit, indicates demands for water up to 115 per cent of the Coleevaporation, that is, an evaporation coefficient of 1.15 for coalburners, with a still higher demand for oil burners.Twenty years ago, injectors having a capacity 75 per cent ofthe Cole evaporation were quite usual, at least in the eastern partof the United States. At that time, one 75 per cent injector suppliedenough water for most of the operation. Coal burners inthe West were operated at a higher evaporation, and oil burnersat a still higher rate, but even then the latter did not attain theCole evaporation. The increase in the evaporation coefficientfrom not much over 0.75 to 1.15 and the higher pressure andtemperature of superheated steam are measures of the progressmade in 20 years in feedwater heaters, stokers, better proportionsof boilers, and front ends.Returning to the first table of the paper and applying anevaporation coefficient of about 1.15 to the Cole evaporation ofthe modern or modernized boilers, it is noted that the Colevalue, as modernized by the coefficient, takes its proper positionin relation to the actual test evaporation of the table.While only the proportions of the boiler, principally the fireboxproportion, had to be considered, it was not difficult to followthe increasing evaporation coefficient and to predict the evaporationto be expected and the amount of water the boiler wouldrequire. But, with the appearance of much more efficient frontends, an additional coefficient, presumably a draft coefficient, isneeded.The author rightly urges more tests to aid in the determinationof the best proportions for the boilers of locomotives. However,it is possible that much useful information could be obtained fromdata of tests already available, if curves were to be drawn showingthe relation between boiler efficiency and percentage of Coleevaporation. The boiler showing the highest efficiency at theCole evaporation would then represent the best proportions, atleast as a first approximation. Corrections for differences indraft and other items might be necessary. Comparison of theheight and slope of the efficiency curves would indicate whichboiler proportion gave the highest efficiency at the higher capacitiesand therefore promised the highest practical capacity; thatis the information desired.Existing conditions are forcing rapid developments in theboilers of locomotives, especially in capacity. Prompt collectionand analysis of all available data are urgently needed. Inthe writer’s opinion useful conclusions can be reached in theshortest time by the determination of the coefficients and themethods reviewed in this discussion.C. L. M e i s t e r . 31 Railroad mechanical officials know that inthese days of faster train speeds their locomotives must haveample steam capacity to take care of, not only the long-sustainedruns, but all the auxiliary demands requiring steam; and carefuldesign of the boiler is the first essential.This paper gives many timely suggestions: Ample combustionspace; reduction at the vital points of the gas flow and thenecessity of large gas areas; the relation of boiler diameter tototal weight; grate area; flue efficiency factor; front-enddesign; and others.A copy of this paper should be in the files of every railroadmechanical officer, and studied not only by the chief, but by hisdraftsmen as well. It should be carefully studied by locomotivebuilders, who so often are prone to copy and perpetuate olderdesigns with slight improvements here and there, based on roadperformanceexperience in lieu of scientifically conducted tests.Although the author has correctly stated: “The superheaterholds first rank of all the improvements made on the locomotivesince George Stephenson’s time,” he has refrained from goinginto detail on this phase of the subject. The writer would like tohave further information on the following matters:1 What is the practical limit to superheat temperatures onthe present type of reciprocating locomotive, and what effect hassuperheat as high as 350 to 400 F, as used in Europe, on theeconomy and maintenance of locomotives?2 What are the important problems affecting the designand materials of boilers and superheaters in connection with highsteam temperatures?3 On the basis of final economy would the greatest advantagebe obtained by the use of higher boiler pressures or higher superheat,or is there a combination of pressures and superheats whichwould give the best ultimate economy?4 In Table 5, column 5, relating to the Pennsylvania Railroadclass SI locomotive, it is noted that this engine is equippedwith a type “A” superheater having a large steam area as comparedwith other types. Is this a special type which permitssuch a great increase in the steam area, and what should be theadvantage, if any, of using such a design?5 The author points out the desirability and effectiveness oftype “E” superheater design in modern boilers, and a review of31 M echanical Engineer, A tlantic Coast Line Railroad Company,W ilmington, N . C.
BRANDT—THE LOCOMOTIVE BOILER 409the tables indicates that this type of superheater has generallybeen applied. It would be interesting to have a concise statementof the principal differences in the various superheater designsand the improvements which can be obtained by the use of thetype “E” superheater.6 Other features on which further enlightenment would beadvantageous are the problem of unburned coal, due to large gasvelocities, and the location of the stoker. Would not locating thestoker at the front, instead of back, of the firebox be an advantageeven if it meant reducing the coal sizes so as to be moreeasily handled? Would the problem of high gas velocities andresultant losses caused by unburned coal be improved by the useof pulverized coal?7 In the paper and conclusion, the author refers to the competitivecondition of Diesel and electric locomotives. Has a realeconomic analysis been made of the comparative economics ofthe modern steam locomotive with that of the Diesel or electricoperation, both as to availability, first cost, operating cost, andmaintenance?R. M. O s t e r m a n n . 32 The author’s wide experience in designingsuperheaters for locomotives, and proportioning them properlyfor best over-all performance, has perhaps suggested to himthat it might be superfluous to discuss the limitations of locomotive-superheaterdesign in a more detailed manner; hisdiscussion on superheaters is brief indeed. And yet, it would seem,since the superheater is such an integral part of the locomotiveboiler, and its design is so bound up with the design and performanceof the boiler itself, that locomotive designers as well asthe users thereof would have been interested in a more thoroughexposition of the various factors which not only determine boilercapacity and boiler efficiency, but also the capacity and efficiencyof the superheater, the steam pressure loss which it creates, andthe added draft requirement which is the result of its installation.The practice of locating the superheater heating surfaces withinthe flues has evolved from several past trials of other arrangements,and now can be considered a virtual standard whereversteam locomotives are used. The practice has become standardbecause superheating the steam either in the smokebox or in thefirebox was found to be impractical for a number of reasons.Thus, one is confronted with one general limitation of the locomotivesuperheater in that it is heated by gases, the temperatureof which is that available within the locomotive-boiler flues.Such temperatures generally range between 600 and 2000 F.The author discusses at length the factors which affect the heatabsorption of the evaporative heating surfaces of the boilerbarrel when in contact with gases of such temperature. Thesesame factors, of course, also influence the superheating capacitybecause the latter depends upon the mass velocity of the gasesflowing over the superheater units, and the temperature differencebetween the gases and the steam to be superheated, from pointto point in the steam path.There is, however, one essential difference between the mechanicsof heat transfer, as between the gases and the water, andas between the gases and steam. The speed of water circulationalong the flues does not affect the total heat-transfer resistanceon the water side of the flue nearly as much as the speedof the steam moving within the superheater-unit pipes affects theheat transfer between it and the gas. Experiments, coveringsuch heat transfer, are on record and reveal that the specific heattransferresistance from the superheater tube to the steam variesinversely with the 0.75 power of the steam velocity. Wheneverthe velocity of the steam flow is reduced in the presence of anundiminished heating effect of the gases, heat is impounded in38 Vice-President, The Superheater Com pany, Chicago, 111. Mem.A.S.M .E.the metal of the pipe and its temperature is raised until theadverse effect of the lowered steam velocity upon the heat transferbetween the pipe and the steam is compensated by a largertemperature difference between the two. On the other hand, therise of the metal temperature causes a smaller temperature headbetween the gas and the metal, and a lessened heat transfer persquare foot of superheater heating surface takes place unlesscompensation is made through a greater mass velocity of the gasflow. This eases up the specific heat transfer from the gas to themetal but, incidentally, also increases the draft loss.Quite naturally it would be desirable to build superheaters inlocomotives which cause as little pressure drop of the steam aspossible, for obvious reasons. However, if the physical laws ofheat transfer are kept clearly in mind it is recognized that thesuperheater capacity, the evaporative capacity of the boilerbarrel, the draft loss through the boiler barrel, the heat-absorptionefficiency, and the pressure loss in the superheater are allinterlinked with the size of the available tube-sheet area.Locomotive superheaters may well be designed for special lowpressure drops, but superheating capacity or draft loss or evaporativecapacity have to be sacrificed, and such sacrifices may affectthe maximum power output of the locomotive more than thepressure drop through the superheater, which, after all, is not athermal loss. This emphasizes the author’s statement that reductionof back pressure is relatively far more essential than areduction of superheater pressure drop, pound for pound. Resortmay be had to the so-called single-loop superheater which halvesthe steam velocity, and the tubes may be made of special alloysteel so as to operate them safely enough with the resulting highermetal temperature. However, this would result in a loweredsuperheating capacity. The steam velocity and pressure dropmay also be reduced by increasing the diameter of the superheater-unitpipes but, in that event, either evaporative heatingsurface must be sacrificed or the net gas area through the boilerreduced. Such limitations do not exist in other types of boilersin which the superheater may be placed at will into the gas streamwhere it is of a higher temperature than the one prevailing in theflues of a locomotive boiler, and, therefore, where the length ofthe steam path can be correspondingly shortened. At such apoint in the gas path, it may also be possible to dimension thenet gas area more liberally and without creating any undue draftloss. In such boilers, low-pressure-drop superheaters can thenbe more easily provided for than in locomotive boilers.The superheater research to which the author refers, actuallyproduced several types of superheater units usable with 5V2-in.flues, which are fundamentally different from the well-knowndouble-loop unit, and which, by reason of this difference, arecapable of producing, with the maximum gas load through theflue, a superheating effect which is about 20 per cent greater thanwith the double-loop design of unit. Unfortunately, however,this type of unit is sufficiently more complex in its structure andsufficiently heavier than the double-loop unit as to make it relativelyimpractical for the highest boiler pressures which are nowused on steam locomotives. It is, nevertheless, interesting tomention briefly that the substantially increased heat transfer tothe superheater heating surface of the unit mentioned was onlypartially obtained at the expense of the evaporating capacity ofthe flue. In other words, in spite of an increased heat transfer tothe superheater heating surface, the total heat absorption of theflue-unit combination could be improved; the draft loss was nogreater than it had been through the flue with the double-loopunit. This rather gratifying result was obtained by utilizingcounterflow between the steam and the gases to a greater extentthan is possible with the double-loop-unit construction, and alsoby special means designed to prevent the temperature of the gasesin contact with the superheater heating surface from dropping as
410 TRANSACTIONS OF THE A.S.M.E. JULY, 1940much as the temperature of the gases in touch with the watercooledsurface of the flue.With respect to the draft loss through the barrel of the boiler,it should be remembered that it is only a part of the total draftloss through the furnace and boiler as a whole. Thus it must bedecided from case to case how much justification there is to decreasethe hydraulic depth of the boiler barrel as a whole withoutrunning the risk of overloading the draft-making front-endarrangement, and thereby unduly increasing the back pressureof the locomotive. Due to the interaction of the superheaterproportions with those of the front end, of the boiler barrel, andof the furnace arrangement—not to speak of differences in fuel—it is impossible to expect that a given standard of superheater designperform in exactly the same manner in locomotives with awide variety of boiler proportions and operating conditions.Yet, in the interests of maintenance, it is imperative that certainstandards of superheater design be adhered to, and it is thisphase of the author’s subject which the writer particularly wishedto bring out.N. A. P ownall.33 There is no doubt but that present formulasare inadequate for determining the probable maximum powerof a modern locomotive. This is particularly true since the adventof such capacity- and efficiency-increasing appliances as thesuperheater, feedwater heater, siphon, etc., as well as the effects ofvariations in exhaust-tip size, stack diameter, front-end appliances,air openings through grates, and various features of boilerdesign mentioned in the paper. It will be of considerable value ifa formula can be developed which will make it possible with fairaccuracy to predict the power of a certain design of boiler. It isto be hoped that, by means of the increasingly used standingtestmethod, such a formula may ultimately be developed, at thesame time establishing the best method of boiler design as regardsfurnace volume, lower gas velocity, greater steam space, etc., asdiscussed by the author. Research work of this nature will benecessary, for there are certain changes, which are even now beingmade, that thus far have produced unpredictable effects.For example, opening up the exhaust tip is desirable from thestandpoint of reducing energy wasted in back pressure and yet,if this is carried too far, though the engine may still steam well,temperatures may have been lowered so as to affect adversely thesuperheat, with a ‘•resulting negative economy. Any drop intemperature of the superheated steam is attended by a positiverise in fuel consumption.The steam space above the water level is certainly important.Treated water is now considered a necessity for locomotiveboilers, and any antiscale treatment will necessarily increase thefoaming tendency of the water, resulting in a greater volume ofwater bubbles in the steam space, which, because of space limitation,is relatively small for the tremendous steam-producing rateof a modem locomotive. Careful study of the boiler design, inorder to increase steam-liberating surface and, by gaining a littlehere and a little there, to increase steam space above normal waterlevel, will be of considerable value in reducing water carry-over.It is noted that experiments are now under way with a troughor box directly under the dome which increases the steam spaceat the main-throttle location and offers promise of some relief.It is astounding to learn that the velocity of gases through theback of flues exceeds 200 mph, and over the arch 260 mph.Therefore, it is not difficult to realize why losses in unburned fueland stack losses are so high, why stay-bolt heads are cut by cinders,and why there is excessive slagging of flue sheets when the boileris worked at high rates. As a result, ample gas area is very important,though here again space limitation interferes. Ad-83 A ssistant to Superintendent of M otive Power, W abash RailwayCompany, Decatur, 111.vantage must be taken of small gains here and there; such as,decreasing the space between the combustion chamber and theboiler shell. If water is kept fully treated, and the boiler systematicallyblown out in service and given thorough washings,this decrease may be made with no bad results.The cost of boiler maintenance is stated to be 30 per cent of thetotal cost of locomotive repairs. This is too high. Years ago,the writer had occasion to keep records of the repair costs,divided between the boiler and items not pertaining to the boiler,and found the percentage of boiler repairs to vary from 9 percent on the best treated water division to 38 per cent on theworst untreated water division. With proper water treatment(and it is prehistoric for any railroad to be without it), this percentageshould be kept below 15.As the author states, at the high combustion rates it is quiteimportant to have maximum possible firebox heating surface andfurnace volume, thus reducing the loss of sensible heat up thestack by reducing front-end temperatures; a 210 deg decrease infront-end temperature causes a 7 per cent fuel saving. However,this must not be carried to the point of causing reduction in thetemperature of superheat.Few people realize the high horsepower obtained from thisboiler plant on wheels, many 4-8-2 and 4t-8-4 type locomotivesbeing capable of developing from 4000 to 5000 hp. We must alsopay a tribute to the feedwater heater which beats the water forthis 5000 hp up to 210 or 220 F with apparatus of a size that canhardly be seen on the locomotive. Yet under the restricted conditions,we are still striving by intelligent and seemingly insignificantchanges in design to develop this high power at evengreater efficiency.Unfortunately trains have to run light, and the engine andboiler do not perform as well as under a heavier loading. Thelocomotive must be so designed as to operate reliably under allconditions occurring on the territory to which it is assigned. Itis preferable and desirable to have a locomotive of general utilitybut, in view of the many factors entering into the economicaldevelopment of maximum power, it may be advisable, where itcan be done, to adapt design to specific operating conditions.Our experience bears out the author’s remarks concerningfront-end design and draft. In this connection, it may be ofinterest to describe some changes that were made on 4-8-2 classfreight locomotives. These engines have 27 X 32-in. cylinders,245 lb per sq in. boiler pressure, 70-in. drivers, 69,400 lb tractivepower, total heating surface 4620 sq ft, grate area 84.2 sq ft, and areequipped with type “E” superheaters, firebox siphons, and feedwaterheaters. According to Cole’s ratios, their normal expectedhorsepower was 3214. When received, they developed 3650 ihp,illustrating the inadequacy of this formula for ordinary moderndesign.The grates were a finger-bar type with 43 per cent air opening,master mechanic’s front end with 6 1/ a - i n - d i a m round tip, and19-in-diam stack, and these were changed to 14.9 per cent airopening tuyfere-type grates, a Kiesel front end with six-opening53-in. star-shaped tip, and a 25V2-in-diam stack. Combustionwas better, excess air was considerably reduced which entails afuel saving, back pressure was reduced, draft was noticeablyimproved by reason of less impedance to flow of gas in the frontend, and the larger stack evidently contributed considerably togreater power. The locomotive developed consistently over4900 ihp, which confirms the author’s feeling that a new formula isneeded to measure the power of modern locomotives and theeffect of changes in the important parts of the boiler.We have built locomotives, making use (possibly inadvertently)of correct principles which have resulted in unexpectedlyhigh power; yet now and then we overlook some unrecognized,important feature and are disappointed in the result.
Mr. Brandt’s paper is very comprehensive, should give designersplenty of food for thought, and the writer feels that inthe foregoing he has added little, but has tried to confirm Mr.Brandt’s reasoning and conclusions.F. P. R o e s c h . 34 The writer prefers to leave questions of locomotivedesign and construction details to those better qualified,and confine his comments to accessories which are not consideredas a part of the boiler proper but, nevertheless, have a materialeffect upon both boiler and locomotive performance.The Ashpan. During Federal Administration of railroads,a committee from Section 3, Mechanical, American RailwayAssociation (A.R.A.), among other suggestions tending towardfuel economy, reported^ as follows:“Many of the older engines are still equipped with ashpanshaving insufficient air openings, a defect readily detected with aU-tube draft gage. There should be no indication of vacuum inthe ashpan. Correction of this condition recently permittedan increase of 1/ t in. in the nozzle diam of several locomotivesand not only effected a substantial saving in fuel, but greatlyincreased the efficiency of the locomotives.”Prior to that time, tests indicated the desirability of free airopenings into the ashpan, having a combined clear opening ofnot less than 14 per cent of the total grate area. This was basedon the total air openings through the grates and its relation tototal tube area. But apparently these recommendations, aswell as those of the American Railway Association committeehave either been forgotten or are disregarded for items of presumablygreater importance.Perhaps it may be well to check into the matter to decide thepoint. A definite amount of air is always required in the combustionof various kinds of coal, as pointed out by the author.Where the area of the supply ports for such air is restricted belowrequirements, the velocity of supply must be increased. Toobtain this velocity we must increase the intensity of the draft.This is usually done by reducing the area of the exhaust-nozzleopening, thereby increasing the cylinder back pressure, so whenthe cycle is completed, we find that what should be free air hasbeen obtained at the expense of cylinder horsepower.At this point the writer wishes to make it clear that we arenot speaking of test-plant methods in this discussion, but ofconditions and methods obtaining in general road service, wherea reported engine failure through any cause is a serious matterand any course is often thought justified which will eliminatesuch reports. At any rate, an engine failure is something realthat everybody hears about, while decreased locomotive efficiencyis only revealed by the indicator.However, decreased locomotive efficiency is not the only evilresulting from a restricted air supply. On the contrary, manyothers such as decreased combustion efficiency, increased stackloss, cinder cutting, etc., all follow in its wake, as will be shownlater.Locomotive Grates. During Federal control a Fuel ConservationDepartment was organized. One of its aims was to check andreduce waste. In connection with that job, it was noticed whenthe fire was laid preparatory to firing up a locomotive, that from500 to 2000 lb of the smaller-sized coals fell through the openingsin the grates into the pit over which the locomotive stood. Assuch coal was afterward covered with ashes falling through thesame grate openings, recovery of the unburned coal presentedsome difficulty and, therefore, was seldom salvaged. To over-14 Vice-President, The Standard Stoker Company, Chicago, 111.Mem. A.S.M .E.3S “ Ash Pans,” Report of Com mittee on Fuel Econom y, Proceedings,Section 3, Mechanical, American R ailw ay Association, 1919,p. 481.BRANDT—THE LOCOMOTIVE BOILER 411come this waste, it was recommended that the grates be coveredwith perforated sheets of heavy paper before the coal was introduced.This fuel loss received wide publicity. Therefore, whenthe railroads were returned to corporate operation, many of themapplied the logical remedy, where conditions warranted, namely,better-fitted grates with smaller openings.But little is known of the physicomechanical reactions or behaviorof the fuel bed in a locomotive firebox at relatively highrates of combustion. So little in fact, that many of our theoriesas to what takes place are based on such an insecure foundationthat conclusions reached are questionable. The chemical reactionsare known and serve as a guide toward improving the combustionof such coal as is actually burned, but this is not what weare concerned about at present. What we need is more definiteinformation covering stack loss, draft currents, both as to directionand velocity, between the fuel bed and the underside of thearch, etc., conditions which can only be observed through smallopenings cut through the sides, or larger openings in the back-head, covered with some transparent substance. We recommendthe latter, as the range of vision through the sides is toolimited, although their addition to backhead windows will behelpful.It has been the writer’s privilege to observe some of the physicomechanicalbehavior of the fuel bed through side holes duringtests on a test plant, and later through a large covered openingthrough the backhead. In the latter case, however, the locomotivewas equipped with forced draft. Nevertheless, the behaviorof the fire in both instances was quite similar, at leastenough so to enable us to set up certain theories, which laterpractice proved to be sound.These observations indicated that, while the gases moved inthe direction as generally pictured, viz., from front to rear, theirvelocity above the surface of the fire bed was relatively low untilthey reached a zone immediately under the rear end of the arch.Here the movement of the particles of coal entrained in the gascurrents indicated a point of excessive turbulence and high upwardvelocity, Fig. 3 of the paper.This was quite interesting, but the most interesting phenomenonwas the behavior of the small lumps of coal lifted abovethe fire bed by the action of the air jets passing upward throughthe fire. It was particularly noticeable that in many instancesone lump of coal was projected high and far enough to enter thezone of high turbulence, where it disappeared, while anotherlump of apparently the same size and rising from the fuel bedwithin 6 or 8 in. from the first one, was only lifted about 1 ft or soand then fell back and was burned. As both were presumablysubject to the same pressure or velocity influence, the questionexcited much interest. Further observations indicated that thesame phenomenon occurred at other points. In fact, the fuelbed had the appearance of a group of miniature volcanoes spoutingfire and ashes, some far up and others only high enough tooverflow the rim.After the fires were dumped, the reason for all this becameclear, viz., difference in size of air openings through the grates.On this observation was based the theory that the lifting actionof air jets passing upward through the fire bed was in proportionto the squares of their areas. This theory has been proved andthe foregoing observations are largely responsible for the presentgeneral use of what are called restricted grates. In these it isnot so much a question of the ratio of air openings to total gratearea, as a question of the size of the openings, their spacing, andthe fit of the bars against each other and against the side andcenter carrier bars. We do feel, however, that the total air openingsneed not be much in excess of the total tube area. Or to putit another way, knowing how much air is required to burn 1 lb ofcoal, air openings can be proportioned accordingly, thus mechani
412 TRANSACTIONS OF THE A.S.M.E. JULY, 1940cally restricting the supply needed, instead of leaving the matterto the judgment, or lack of judgment, on the part of the fireman.Needless to say, the general adoption of restricted grates washailed by locomotive-stoker manufacturers, as it fully supportedtheir contention that stack loss was not a question of coal sizeas fired, but rather one of air openings through grates and draftinfluence. Furthermore, stack loss far antedated mechanicalstokers and, according to a University of Illinois bulletin,36 lumpcoal breaks down during the process of combustion (naturally)and thus accounts for the excess in cinders collected above theamount of fines in the coal as fired. As a matter of fact, a higherheat release is obtained from small-sized coal as fired, other conditionsbeing right, than from lump coal which must be brokendown during its combustion.36Draft Streams. In a preceding paragraph, the statement wasmade that the velocity of the gas streams, moving from theforward part of the firebox to the rear, was relatively slow. Insupport of this statement, we offer the fact that while the locomotiveis in operation it requires a greater distributor-jet pressureto blow a lump of coal from the front of the firebox and presumablywith the draft, than it does to blow an equal lump fromthe rear to the front, and again presumably against the draft.This fact came to light only recently with the introduction of theso-called front-delivery stoker as developed by the Baltimore &Ohio Railroad. However, an approach to the problem with anopen mind and no fixed convictions as to what really happens ina locomotive firebox when coal is being burned at relatively highrates, enables one to arrive at a logical solution, namely, themomentum imparted to any mass, in this instance a lump of coal,is proportionate to the velocity or force of the steam jet impingingagainst it. This should hold true regardless of whether the massis projected from the rear to the front or from the front to therear of the firebox. The velocity of the jet is as the pressure.Therefore, it follows, if higher jet pressures are required to blowthe coal rearwardly and presumably with the draft stream, itmust be subject to other resistance than that of gravity.This we find the author has clearly indicated in Fig. 3 andsubsequent analysis. Reasoning along these indicated lines, wedraw the conclusion that the initial momentum is graduallyreduced and, when the mass reaches the zone of greatest turbulenceand high velocity, it no longer has sufficient momentum tocarry it through that zone unless the initial velocity is increasedthrough higher jet pressures. On the other hand, where the coalis introduced at the rear of the firebox and blown forward, theintroduction takes place within the high-velocity zone, thereforethe mass even at a lower initial velocity still has sufficientmomentum to carry it through this zone and deliver it to theforward part of the fire bed.This theory if accepted, raises another interesting problem.Tests on the Baltimore & Ohio Railroad have definitely shown theadvantage of the front-delivery stoker; for instance, a 50 percent decrease in stack loss, 15.9 per cent reduction in fuel per 1000gross-ton-miles, and 15.5 per cent increased evaporation perlb of coal, together with the practical elimination of smoke.There is no question as to the correctness of the published data,as the reason for this improved performance is self-evident.However, as the comparisons were made between the frontdeliverystoker, which delivers the coal at a point about 14 in.above the normal grate level, and one effecting delivery at a muchhigher level, there is the possibility that the same performancedifferences may not obtain where the coal is introduced with a3S1‘Com parative Teats of Six Sizes of Illinois Coal in a MikadoLocom otive,” by E. C. Schmidt, J. M . Snodgrass, and O. S. Beyer,Jr., University of Illinois Engineering Experim ent Station, BulletinN o. 101, Sept., 1917.rear-delivery stoker, firing from a level corresponding to that ofthe front-delivery stoker, for the following reasons:The statement has been made that the lifting action of the airjets passing upward through the fire bed was as the square oftheir areas, the velocity remaining the same. In the following,it must be understood that the figures are not at all accuratesince, owing to the resistance and varying thicknesses of the fuelbed, accuracy is out of the question, but the comparisons cannevertheless be accepted as valid.Assuming the author’s data as given in Fig. 3 to be based on agrate having an area of 100 sq ft, we find from established teststhat an approximate draft equal to 21/ t in. of water is required toburn coal at the rate of 90 lb per sq ft of grate per hr,37 and this,neglecting fuel-bed resistance, results in a velocity efflux of103.30 ft per sec.38 In contrast, at the higher rates, viz., 236 lbper sq ft of grate, we must have a draft equal to 4 in.,37 with acorresponding velocity of approximately 130.43 ft per sec.38However, in the first instance, due to the expansion of gases, thevelocity is increased to 198 ft, and in the second to 386 ft wherethe gas stream passes over the arch.8 Therefore, where the fuel isintroduced at the lower levels, a lesser amount is caught up bythe higher-velocity streams.Since the velocity of the gas stream, where it passes over thearch, is proportionate to the volume to be moved and the area ofthe opening between the top of the arch and the crown sheet, itwould appear that any increase in this area would decrease correspondinglythe velocity at that point. This brings us to aconsideration of the setting of the arch.The Brick Arch. The value of the brick arch is well known andrequires no further discussion. Recommended practice39 suggestsa gas area over the arch equal to from 110 to 120 per cent ofthe minimum net tube and flue area. This is to increase thelength of flame travel and reduce the stack loss. However,according to the author, this results in a gas velocity at thatpoint of 198 ft per sec at low rates, and 386 ft at high rates of combustion,while the corresponding velocity through the tubes andflues is 157 and 300 ft per sec, respectively.The writer believes in a long arch but, as has been shown, theentrainment of the smaller particles of coal is influenced by thevelocity of the gas streams. Theoretically, any reduction insuch velocity should in turn affect entrainment and, whiletheory does not always check with practice, it does appearreasonable to assume that some modification in arch applicationwhich would tend to equalize gas velocities might be worth ourconsideration. As a suggestion based on tests conducted by thewriter, we propose, beginning at the rear, longitudinal rectangularopenings between the arch and both side sheets about 4 in.wide and 36 in. long, leaving the center of the arch to the recommendedlength. With such an arrangement much of the finesentrained in the gas streams would come directly in contact withthe water-cooled firebox sheets, cooling such particles and preventingtheir adherence to the tube sheet in the form of honeycomb.We feel this discussion would not be complete without furtherreference to the mechanical locomotive stoker, as it is onlythrough mechanical firing that the full rating of modern locomotiveboilers can be obtained. This being the case, would itnot be well when designing such boilers, to give consideration tostoker requirements as to ready and appropriate application?37 “A Study of the Locom otive Front End, Including T ests ofFront-End M odel,” by E . G. Young, University of Illinois EngineeringExperim ent Station, Bulletin N o. 256, M ay, 1933.38 “ Mechanical D raft,” by W . B . Snow, B . F. Sturtevant Company,B oston, M ass., 1910.3* Report of Com m ittee on Locomotive Construction, Proceedings,American Association of Railroads, 1936, pp. 277-436.
We refer particularly to the type and design as developed by theBaltimore & Ohio Railroad, a type which may tend to revolutionizemechanical firing. This design and its prototype which,however, fires from the rear are the only mechanical stokerssatisfying the requirements as to secondary air as discussed bythe author under “secondary air for combustion.”No doubt this has escaped general notice, but an examinationof either type will reveal this fact. While the method used ismore in the nature of a heat exchanger, yet it does supply preheated“top air” and always in direct proportion to combustionrequirements. Gas analyses verify this statement. The apparatussimply consists of a vertical grate surrounding that part ofthe stoker-delivery member extending upward through thelocomotive grates.These vertical grates, termed “protecting grates,” extendabove the fuel bed and absorb heat from it. This heat is in turnabsorbed by the free air contacting the inner surfaces, and is inturn drawn into the firebox and over the fuel bed by the draftthrough Vi-in. holes drilled radially and spaced so as to giveperfect diffusion. The number of drilled holes is always proportionalto the total grate area and to the volume of air suppliedthrough the fuel bed, thereby maintaining a fairly evenbalance. There can be no question but that this supplementaryair so admitted contributes materially to the splendid resultsobtained on the Baltimore & Ohio as reflected in the boiler andfuel performance.We have so little factual knowledge of what actually transpiresin a locomotive firebox at moderate or high rates of combustion,that, in view of the importance of the subject, it would appearthat almost any expenditure for tests would be warranted. Suchtests, however, should be made on a plant where road conditionscould be simulated. While tests*8 conducted by the Universityof Illinois indicated no material difference as between constantflowand pulsating draft, many engineers feel that these are inconclusive,hence the suggestion to simulate road conditions.So unless tests are made, and such tests duplicate as far as possibleactual road conditions, we will still find ourselves where westarted.To show to what extent the modern locomotive boiler dependsupon the mechanical stoker, we might refer to the large simple“Mallets” built for the Northern Pacific some few years ago. Theselocomotives burn a subbituminous coal and therefore require arelatively large grate. The proportions as to grate area desiredand steam output of the boiler were worked out by the engineeringdepartment of the Northern Pacific in collaboration with thelocomotive builder. The latter, however, would not agree to conformto the dimensions requested (referring to grate area) untilthe stoker company agreed to build a stoker with sufficientcapacity to meet maximum requirements, and would guaranteeto distribute the amount of coal fired evenly over the grate.The maximum requirements were estimated at 45,000 lb of coalper hr. While this rate has never been required, neverthelessthere are times when a rate of 30,000 lb of coal per hr is actuallyreached. The firebox first laid down was 20 ft long and 9Vs ftwide, or a grate of 190 sq ft. This was later reduced to about184 sq ft. Needless to say, the requirements were met by thestoker company, otherwise the locomotives would never have beenbuilt.L. A. Shipman." In comparing steam-boiler performance onan efficiency basis, we have two vital factors to consider (1)water and (2) coal.In the case of locomotive MIA tested by the PennsylvaniaRailroad, referred to in the paper, wherein burning rates of 34510 Combustion Engineer, Southern Coal & Coke Com pany, Inc.,Knoxville, Tenn. M em . A .S.M .E.BRANDT—THE LOCOMOTIVE BOILER 413lb of coal per sq ft of grate area per hr were obtained, one of themain fuel problems, as indicated by the 50 per cent stack waste,was keeping the fuel on the grate until it was burned. Thisproblem can be solved at least partially by fuel selection andsizing.In connection with the matter of water circulation and foaming,the importance of the water conditions as they affect theefficiencies of the different tests should receive special attention.While it has been mentioned that forced circulation of waterwas used in the Steamotive tests, the fact that practically distilledwater was used in both Steamotive tests and in the Navytest, as against the regular water-tank water as used in the NewYork Central and Pennsylvania Railroad tests, was not mentioned.While this fact certainly affects the efficiencies of the test, it alsosingles out those who have developed the equipment and itsmethods of operation so that distilled water is economicallypossible for special distinction.Because of the fact that there was a difference in the water, inthe water circulation, natural against forced, and in the factthat there was a difference in the percentages of the total fuelconsumed because of the high stack loss of the conventionallocomotive at high burning rates, the performances are not onan equivalent basis for comparison although the facts presenteddefinitely point out the tremendous improvements possible infuel economies for which those contributing to the new designsshould be highly complimented.L. K. Sillcox.41 The locomotive boiler and its operation canscarcely be discussed without referring to the fact that only alimited number of test data are available. The author is fortunatein having access to new information which heretofore hasnot been reported. Nevertheless he still is compelled to callattention to the need for vastly more information which canonly be derived through further boiler research.No entirely satisfactory method of defining locomotive capacityhas yet been derived which will establish its capacity as limitedby the features of furnace, boiler, engines, and rail, acting individually.Boiler calculations are the least exact of all the elementsinvolved, although the investigations of Cole, Fry, Strahl,and others have all contributed in important measure to our totalknowledge of the subject.The author presents a table which shows the failure of Strahland Cole to estimate the actual evaporative capacity of threelocomotive types. In the case of the Pennsylvania Railroadclass MIA, Strahl estimates capacity at 54 per cent of testvalues, Cole at 68 per cent. Perhaps, in justice to Strahl andCole, it should be pointed out that, when evaporating 99,095 lbof water per hr, the locomotive was fired at the rate of 337 lbof coal per hr per sq ft of grate. No such overload is contemplatedin the application of the formulas. At this high coal rate, anefficiency of boiler and furnace of but 37.5 per cent was obtained.Yet the absorption efficiency of the boiler was over 80 per cent.This is illustrative of the mass of operating details which must beexplained in every case if test conclusions are to bear all theirpossible significance.It has been remarked that, even with the stated excessive anduneconomical firing rate, absorption efficiency did not suffergreatly. This would indicate that high gas velocities may notalways be objectionable, in so far as boiler performance is concerned.In fact, whereas a gas velocity of 204 mph in the tubesis quoted as very high, velocities of 445 mph are sought in theVelox steam generator, and blowers are introduced to attain thisend. There is a vast difference in function and design, of course,but the Velox generator, one of which is now installed in a loco-41 Vice-President, The N ew York Air Brake Company, W atertown,N . Y . M em. A .S.M .E.
414 TRANSACTIONS OF THE A.S.M.E. JULY, 1940motive of the Paris, Lyons and Mediterranfe Railway inFrance, occupies much less space and represents much less weightthan a conventional locomotive boiler of the same capacity.While we are continuing improvements in the conventionalfiretube locomotive boiler, which no doubt will remain thestandard type for general service for many years to come, wecannot afford to confine our attention to this construction to theextent that we are blind to possibilities originating in otherfields. Concentration of more boiler capacity within less spaceand providing this with considerably reduced weight, offersattractive possibilities for investigation by locomotive builders,with available fuel types ever in mind.It is the limitations imposed by compliance with familiar andproved proportioning of locomotive parts and strict adherence toconventional practices that renders difficult the fitting of requiredpower into the loading restrictions and clearance limitsof American railways and calls for a firing rate such as that proprosedby the A.A.R. committee appointed to investigate therequirements in a locomotive capable of hauling 1000-ton trainsat 100 mph, namely, 152 lb of coal per sq ft of grate per hr undernormal conditions. Combustion efficiency would be higher if theunit firing rate were lower, yet weight limitations govern thepermissible size of grate which may be practicably employed;approximately 128 sq ft in this case.The coal-fired steam-locomotive boiler has advanced rapidlyand far. It compares phenomenally with central-station boilersin capacity per unit of weight. Present railway-operating practiceshave taxed its capacity in all practicable sizes yet the demandsare unchecked. Perhaps we must search out new approachesto an old problem, replacing well-thumbed pages of pastoperating manuals and removing the inherent difficulties whichhave retarded progress in the use of such promising expedients aspulverized coal and the water-tube boiler.L. W . W a l l a c e . 42 At the outset of this paper, a statement ismade to the effect that the public is continually demandinghigher speeds for both freight and passenger trains. It may bethat such an apparent demand is being taken too literally. Is ithigher speed, in terms of miles per hour, that the public wants oris it a reduction in the total elapsed time required to travel betweentwo points? There is a real and significant difference betweenspeed in miles per hour and total elapsed time. The totalelapsed time experienced on many rims may be reduced materiallywithout increasing significantly the sustained speed in miles perhour for any major portion of the run. This may be done byreducing the waiting time at stations and elsewhere through moreexpeditious servicing and handling of trains. It is the waitingperiod at terminals and elsewhere which causes the largestamount of restlessness and complaint on the part of the travelingpublic. It would appear that this phase of train operations hasnot been given the analytical attention which its importancewarrants.The difference between high speeds in miles per hour and areduction in total elapsed time between two points, realizedthrough more expeditious train servicing and handling, maymake a major difference in locomotive design, its first cost, andthe cost of maintenance and operation. What this may mean isreflected by the comparison of the 2-8-0 and 6-8-6 locomotivetypes. This comparison discloses that the weight of the locomotivehad to be doubled in order to obtain sufficient boiler capacity.All of which raises the question, “What price is paid forhigh speeds in miles per hour as contrasted with the price whichmay be paid for a reduction in total elapsed time?”The comparison of the locomotives referred to adds emphasis to42 Director, D ivision of Engineering and Research, Crane Company,Chicago, 111. M em. A .S.M .E .this significant statement made by the author, “. . . the importantquestion is whether greater boiler efficiency is attainable, particularlyat high-capacity operation, and what can be done toaccomplish this.”The following pertinent comment also appears in the paper:“The subject matter will be centered on problems affecting thedesign of the conventional locomotive fire-tube boiler only,not because of any belief that this type of boiler is the final answerto the locomotive steam generator.. . . ”The writer was delighted that the author disavowed any beliefthat the typical locomotive boiler is the final answer. In myjudgment it is not. It may well be that if a broadly conceivedand executed line of creative research were undertaken, the finalresult would be some form of boiler closely akin to the flash type.It seems evident that something different from the present typicallocomotive boiler must come, as it is not sound economics todouble the weight of a locomotive in order to obtain adequatesteam capacity.Again to quote: “However, much remains to be done to makepossible the burning of more fuel per hour at higher combustionefficiency with lower draft loss, greater heat-absorption efficiency,and higher superheat with less boiler weight per pound of steamproduced.” This is a farseeing, correct, and timely statement ofthe problem confronting the railroad industry. It is fairly obviousthat one approach to relieving the present situation is to supplythe steam required for auxiliaries, train heating, air conditioning,and for other purposes through a steam-generating unit otherthan the locomotive boiler. However, this alone will not give thefinal answer.The author states: “The method of standing blowdown testsdeveloped and used by the New York Central Railroad in recentyears has proved very effective.” This is undoubtedly true.Moreover, it is the writer’s thought that considerable valuablework in certain directions can be accomplished by the use ofscale models. This means the application of the law of similitudewhich has been so successfully used in connection with researchprograms covering a wide range of difficult technical problems.There is no apparent reason why the method cannot be appliedsuccessfully to the solution of many railroad problems. Themethod has the advantage of affording a more definite control oftest conditions than for full-scale operations and, furthermore, amaterial reduction in cost of experimental work may be realized.The locomotive boiler presents a difficult problem. A comprehensiveapproach to its solution has been too long delayed.The solution lies in the direction of broadly conceived fines ofresearch coupled with a daring and courageous attitude.A u t h o r ’s C l o s u r eIt is an honor for the author to have the privilege of replyingto the many valuable contributions made to his paper, “TheLocomotive Boiler.”The interest that this subject has aroused among those responsiblefor the design and operation of steam locomotives testifiesto the importance of further improvements to the coal-burningsteam locomotive.Since the preparation of this paper the European war hasstarted, reminding us that the development of the steam locomotivemust not be neglected, and it is pertinent that this subjectbe again emphasized.It is often heard today that the railroads, and particularlythe coal-burning steam locomotive, are out of date, and will bereplaced by airplanes and oil-driven power units on railroads andhighways.Such opinion, if shared by responsible men in government andbusiness, may have a paralyzing effect upon efforts to improvethe steam locomotive. Those who are able to see beyond the
BRANDT—THE LOCOMOTIVE BOILER 415present phase in the development of transportation, and aredevoting efforts and thought to the perfection of the coal-burningsteam locomotive should be encouraged in their efforts.The struggle now raging in Europe is being fought on land, air,and water with engines of war driven by gasoline and oil power,and one of the major problems of this war is the control of adequatesupply of petroleum.That the world’s supply of oil is definitely limited is believedto be true by many eminent authorities. A late estimate of theavailable oil supply in continental United States, prepared bythe Committee on Petroleum Reserve, of the American PetroleumInstitute, gives the total available supply as 17,348,146,000barrels in 1939. The annual production in 1938 was 1,213,186,000barrels per year which would indicate that our petroleum supplyin the United States may approach exhaustion in fourteen years.That this definitely limited supply of petroleum, absolutelynecessary for operation of naval vessels, airplanes, tanks, andtrucks, will have to be conserved for our national defense in thefuture appears reasonable.The use of oil for the production of power, in places where coal,abundantly available, can be utilized to good advantage, appearsunwise from the viewpoint of future national welfare.The coal-burning steam locomotive has hauled the bulk of thecountry’s traffic in the past. Its gradual replacement now takingplace, at a rapidly accelerating pace, with oil-using Diesellocomotives and gasoline power units on highways and in theair, may find this country only a few years hence in a position ofhaving a transportation machine that has cost billions of dollars,but without suitable, or too costly fuel to drive it.A review of the many discussions reveals a general agreementwith the author’s thesis, that there is room for improvement andnecessity for coordination and clarification of principles withfurther research and tests.The opportunity to present a paper on the same occasion as Mr.Bailey is an honor that is very much appreciated by the author.Mr. Bailey’s paper on steam-boiler performance16 is of greatfundamental value, and the discussion that he presented on thesubject of locomotive boilers is an expression of his theory on“methods of comparison of boiler performance.” His discussion,read in conjunction with his own paper just referred to, is so verycomplete that there is little that can be added for further clarification.The author in his paper referred to a new type of locomotiveboiler soon to be tried out. The boiler referred to is that illustratedand analyzed by Mr. Bailey in his discussion. The resultsobtained with this boiler, as to efficiency, capacity, andweight, may point the way to further developments on coalburningsteam locomotives.The author regrets his inability to supply more detailed informationon the oil-fired tests of the Southern Pacific, as requested,as these data are not obtainable.Mr. Bailey suggests that the author supply additional data onthe subject of draft loss through various portions of locomotiveboilers under different ratings so that the relationship betweenoutput and efficiency versus draft loss could be analyzed. It isregretted that sufficient data are not available at the present timeto furnish this information.Mr. Duncan’s discussion reveals his interest and insight intothe problems under consideration, and deserves a more detailedanswer than space will permit at this time. He suggests that ifan underfeed or traveling stoker could be adapted to locomotiveservice a great improvement would result in furnace efficiency.It may be noted here that several designs of both of these typesof stokers have been made.The Crawford underfeed mechanical stoker was built and testedout quite extensively on the Pennsylvania Railroad in 1913 and1914, and many engines were so equipped. It is believed thatthere are no underfeed stokers on locomotives now in service.The author has no knowledge of any traveling-grate stokersactually tested, although at least one design was made.During some thirty years of experiments with different typesof stokers the sprinkler type, due to its simplicity and reliability,is the only one that has survived the test of service.The reason that underfeed and traveling-grate stokers havenot been perfected and adapted for locomotive service is due tothe fact that they require more room, and weigh more than theexisting locomotive limitations permit.Mr. Eksergian’s discussion has amplified and supported theauthor in several important observations made and it would besuperfluous to add anything further to the points touched uponby him, except to express appreciation for his carefully thoughtout comments.Any contribution made by Mr. Jones, engineer of test and chiefof the locomotive test plant, Pennsylvania Railroad, where mostof the tests quoted by the author were made, is of real interest toall. He is eminently qualified to discuss this subject, and hisreference to the MIA locomotive with enlarged steam space,emphasizing the improvement possible even with a small changein design, is valued highly.While on this subject it should be noted that most of the testplanttests are run with particular attention to keeping the waterlevel below a full glass, or three gages of water, and also withoutfoaming condition of the water. In road service it is known thatmany times the water level is carried above the highest gage cockand badly foaming water is encountered.In some cases, on large and long boilers, it has been found thatthe distance from the water level to the top of the boiler barrelat the dome is as small as ten inches with the water level at thetop gage cock. When ascending a heavy grade, say 2 per cent,with engine working at maximum capacity, the water level isusually carried to a full glass of water. When engine is tippingover the grade the water level near the dome will rise as much as8 in., thus reducing the steam space to nearly zero.This condition indicates the importance of the use of steamseparators in the dome.The carefully conducted tests of locomotive performance thatare frequently being made by Mr. Knight on his railroad are anexample of the alertness with which present-day railroad managementexplores every avenue to improve railway efficiency. Hiscomments based on actual experiences are, therefore, of muchinterest.The information pertaining to fuel tests with different gradesof coal, furnished by Mr. Knight and quoted elsewhere in thissummary, is very valuable. His reference to tests made withdifferent percentages of air openings through the grates is mostinteresting, particularly the trial with grates having 60 per centfree air opening. Further information on these tests will be ofinterest.Mr. Lipetz’ contribution is of particular value because of histhorough knowledge of the fundamentals involved. He callsattention to the possibilities obtainable from the proper study ofthe curves of the test data presented in conjunction with theboiler ratios given in the table.The data shown represent the results of all the pertinent andcomplete tests made. Many road tests have been analyzed bythe author, but most of them usually lack sufficient test data topermit an accurate analysis of the performance of the locomotiveunder different conditions of load and speed.Some road tests analyzed have accurate data on the cylinderperformance, drawbar pull, and horsepower, but lack data on thefuel and water consumption or general boiler performance. Othertests have been made with accurate data on coal and water con
416 TRANSACTIONS OF THE A.S.M.E. JULY, 1940sumption, but without dynamometer or indicator cards to measurethe work performed.The reason for the many incomplete tests run in the past isdue to the desire to get a quick picture of the general performancerather than a critical analysis of design; also, the question of thecost of tests is important, particularly when one railroad mustbear such cost alone.The advantage of coordinated research is appreciated by allconcerned, and perhaps some day this may be brought about.Mr. McBride suggests that a prompt collection and analysisof allavailable data are urgently needed in connection with the problemof proportioning locomotives. The author agrees with thisand it was the primary purpose of his paper to make available allthe pertinent and accurate test data available just for suchanalysis and study.However, the author disagrees with Mr. McBride as to theaccuracy of methods suggested by him as they use arbitrarilydetermined coefficients which apply to empirical formulas, thefundamental sufficiency of which is in question.We need not be concerned here with a rule-of-thumb methodfor determining the approximate maximum evaporation of a boilerfor the purpose of setting the size of the stoker, injector, etc., butrather a critical analysis of the effect that definite changes inthe proportions of various component parts of the boiler haveupon boiler efficiency, capacity, first cost, and cost of maintenance.When this is determined, accurate formulas for calculating thecapacity and efficiency of the boiler will follow.The several questions raised by Mr. Meister, regarding theinfluence of superheater design upon locomotive economy, areimportant, and the author will endeavor to answer them.The first question pertains to the practical limit of steamtemperatures on present type of reciprocating steam locomotive;also, its effect on economy and maintenance.Modern locomotives in the United States, Canada, and Europeoperate with steam temperatures of 750 F, and on many locomotivestotal steam temperature of 800 F, at maximum rate, is notuncommon. With 250 lb boiler pressure this total temperatureis equal to a superheat of 350 to 400 deg.This steam temperature will give a metal temperature of thesuperheater units of from 875 to 900 F, and units made of openhearth,low-carbon steel have proved satisfactory for thesetemperatures. Heat-resisting low-alloy steels are also availableto give additional life if desired.The foregoing statement is predicated on the basis that theunits are kept clean from scale on the inside, as it is well knownthat even a thin layer of scale will decrease the heat transfer frommetal to steam and raise the metal temperature.As far as other parts of the locomotive in contact with superheatedsteam are concerned the problem of high steam temperatureshas been successfully solved by the use of cast steel forthe superheater header, throttle, steam pipes, and cylinders.The single-seated multiple-disk valve throttle has proved successfulfor this service. The lubrication problem has also been satisfactorilysolved by the use of the modern high-temperature lubricatingoils and forced-feed lubricators.The question of economy gained by the use of high superheat isanswered on page 391 of the author’s paper. A reduction of asmuch as 46 per cent in steam consumption was gained with superheatup to 225 F as compared with saturated-steam operation.It has been definitely shown on many tests that for each 10 F increasein superheat there would be a reduction in steam consumptionof not less than 1 per cent up to the limit of the presentpractice of 800 F total temperature. This is due to the raising ofthe total heat content of the steam at admission, and increasingthe total heat drop, or the Rankine-cycle efficiency.The second question raised is a rather broad one and is perhapsbest answered by the replies to the other more detailed questionsin Mr. Meister’s discussion.The third question, inquiring as to what combination ofpressures and superheat will give the best ultimate economy, canbest be answered by stating that from a thermal standpoint thehigher the pressure and superheat become, the greater will be theRankine-cycle efficiency of the prime mover. From a practicalstandpoint it appears that 300 lb gage is the highest to which theconventional stayed locomotive boiler should be built consideringmaterial and practice of today. An increase above this pressurewould not be of any advantage from an economy standpointwhen used in a single-expansion reciprocating noncondensingengine with dimensions of present-day locomotives equippedwith piston valves and Walschaerts or similar type of valve gears.With water-tube boilers of types now on the horizon it appearsentirely practical to raise the boiler pressure considerably above300 lb per sq in. and maintain up to 800 F steam temperature.With the advent of a practical cylinder design having poppetvalves and cam-operated valve gear, like the Franklin gear, referredto by Mr. Jones in his remarks at this meeting, it appearsthat a reciprocating engine has arrived that is not only wellsuited for handling high pressure and superheat from a practicalpoint of view, but also capable of utilizing the increased amount ofenergy supplied with each pound of steam with greater efficiency.The superheater on the 4-4-4-4 type locomotive, referred to inquestion 4 of Mr. Meister’s discussion, is a large-flue superheaterwith the same size of superheater flue and arrangement as thetype “A.” The only difference is that each unit consists of twosingle loops joined to one set of header connections instead of onedouble-loop unit as with the type “A.”The heating surface of the flue, and superheater, and gas area ineach flue, is the same as the type “A,” but the steam area througheach unit is twice as large. This results in a reduction of the steamvelocity in the unit to one half of that of the double loop for anygiven rating. The pressure drop through the superheater is reducedthereby, but because the lower steam velocity reduces therate of heat transfer the superheat will also be less.In the early days of the development of the locomotive fire-tubesuperheater in the United States, some thirty years ago, a numberof locomotives were equipped with single-loop superheatershaving two single loops of i y 2 m- pipe in 5'A in. flue.In view of the desire to keep pressure drop down to a minimuminterest in single-loop superheaters has been renewed.The problem to be solved with the single-loop superheater isthe relatively greater differential expansion of the pipes—this isreceiving careful study.On the basis of an increase of 350 deg in the steam temperaturefrom the inlet side of the superheater unit to the outlet side therewould be a difference in the average temperature of the metal inthe pipes of each unit loop of 175 F.As the two ends of each unit loop are fixed the large differencein the expansion of the unit pipes sets up a heavy strain on theunit joints that may cause them to leak and filially break.The Superheater Company has experimented and tested manydifferent types of single-loop superheater units, most of thembased upon the principle of placing the bulk of the superheatingsurface of the unit so that the steam flows in counterflow withthe gases, and only one pipe is used for the return of the steamto the front end in uniflow with the gases.Example of such units are the “H” type, 5P, 6P, and 7P units.All of these types of units are subjected to the same differentialtemperature stresses. In the “HA” type unit this has beencompensated by the use of a short section of double-loop pipewhich acts like an expansion joint thus taking care of the differentialexpansion.
BRANDT—THE LOCOMOTIVE BOILER 417In the standard double-loop superheaters, both type “A” andtype “E,” there is sufficient flexibility to distribute and absorbthis differential expansion without setting up undue stressesthat cause trouble.In view of the desirability of improving the tractive power ofsteam locomotives at high speeds the question of low pressuredrop is important, and careful attention is given to the designof superheater, dry pipes, throttles, steam pipes, and cylindersto gain this end.The question of reducing the pressure drop through the drypipe, superheater header, throttle, steam pipe, and valves presentsno difficulty from the standpoint of design as these steampassages can be increased considerably above present practicewithout interfering with the fundamental design of the locomotive,or reducing the useful life of these parts.An undue increase in the steam area through the superheaterunits, however, may under some conditions adversely affectthe power output of the locomotive as well as the life of theunits.To reduce pressure drop to a minimum and at the same timemaintain high superheat for maximum economy in the use ofsteam involves not only the steam passages from the boilerthrough the superheater to the steam chest, the valves, and exhaustpassages but also the correct proportions of the cylindersto the weight on drivers.Experience with superheater engines during the last thirtyyears has shown that a factor of adhesion of 4 is about the minimumfor satisfactory locomotive operation with superheaters ofnormal pressure drop, and it is only under difficult rail conditionsthat such locomotives have been found to slip at high speeds.If locomotives with factor of adhesion near the lower limithave the superheater changed to single loop, cutting the pressuredrop in half, and thereby raising the mean effective pressure athigh speed, such engines might prove very slippery at high speedswhen using ordinary valve gears.Under such conditions the engine must be throttled, the cylinderdiameters reduced, or the initial boiler pressure cut, and thiswill cancel the improvement that was originally sought to begained by the lower pressure drop at high output, and one isback where he started.For locomotives that are undercylindered, and have a factorof adhesion larger than 4, a considerable improvement may begained in decreased pressure drop through the use of the singleloopsuperheater.Engines designed fifteen or more years ago were usuallyequipped with superheaters smaller than is present practice.Many of these older locomotives have been rebuilt andequipped with more efficient and powerful front ends, stokers,better grates, and valve gears. This has permitted such modernizedengines to be forced to much higher rates of evaporationthan originally possible and, logically, the superheater shouldbe enlarged correspondingly both as to surface and steam area.The greatest gain in increased boiler efficiency, higher superheatand low pressure will be obtained by installing type “E”superheaters. Whenever this is not expedient a good improvementcan be obtained by the installation of a superheater unitlike the “HA,” which gives some 50 F higher superheat, withoutany increase in the pressure drop.Another solution may be that of using a single-loop type “A”superheater. This would give less superheat, but only onethird of the pressure drop of the double-loop type “A” withthe same number of units.In his fifth question Mr. Meister observes that the majorityof modern locomotives have been designed with type “E” superheaters,and inquires regarding the improvements that will resultfrom the use of this design as compared with the older type“A” superheater, or other types of superheater and boiler designs.The type “E” superheater is a fire-tube superheater with aheader in the front end of the same general design as the type“A.” The difference lies in the arrangement, also the size of thesuperheater flues and units. The superheater flues in the type“E” superheater may vary in size from 3V4 in. OD to 4 in. ODdepending upon the length of the flues. The size of the flue is selectedso as to give the maximum efficiency with minimum draftloss.Each unit is a double loop with one loop of superheater pipe ineach of two superheater flues. The unit pipes are of such size asto give the highest superheat with the lowest pressure drop anddraft loss. There are a number of open small tubes that do notcontain superheater units.Due to the use of the smaller size of superheater flues in thetype “E” superheater as compared with the larger flues used inthe type “A” it is possible to gain from 8 to 10 per cent in thetotal flue evaporating heating surface of the boiler for the samelength of flues; this in addition to a gain of from 3 to 6 per cent inthe total free gas area through the boiler.The heating surface of the type “E” superheater is increasedfrom 35 to 50 per cent over the type “A” superheater thus givingfrom 60 to 80 degrees higher superheat at maximum capacity forequal conditions of operation, and an even higher difference atthe lower rates of working because of the greater surface and themore efficient disposition of same.The steam area through the superheater is usually greater thanthe type “A,” and is ample for normal low pressure drop.The foregoing physical improvements in the amount and effectivenessof the heating surfaces result in a decided improvementin boiler efficiency and superheat with a resultant improvementin the over-all efficiency and capacity of the locomotive of upwardof 15 per cent as compared with an old-style large-flue superheater.With a properly proportioned grate and firebox the type “E”superheater-equipped locomotive boiler represents the mostefficient concentration of boiler power that has so far been proposedfor use in the conventional boiler and has proved practicalin every respect.In addition to the improvements in efficiency and capacityresulting from the use of the type “E” design there are severalother practical advantages, such as a reduction in the number ofunit header connecting joints to keep tight, and easier locomotiveto draft because of the more even distribution of the samesize of flues over the tube sheets, a larger space between the fluesat the back tube sheet providing more water space and bettercirculation, which is of considerable importance in flue and tubesheetmaintenance.The relative small-diameter flues permit the use of thinnerflues as compared with the large flue superheater. This, togetherwith the uniform size and thickness of the flues, equalizes the expansionstrains reducing flue leakage and flue-sheet cracking.Regarding Mr. Meister’s sixth question, whether better resultswould be obtained with the stoker located in the front of thefirebox. This question is very completely answered by Mr.Roesch’s discussion on this paper; and the question of burningpulverized coal is touched upon in another place.Mr. Meister’s seventh question is of great interest to railwaymanagement. Many studies have been made on this subject, butit is apparent that sufficient experience has not yet been had topermit an accurate analysis, as suggested by Mr. Meister, fromwhich definite conclusions could be made. This subject is of suchlarge scope that it alone would require a separate treatise.Mr. Ostermann’s discussion on the high economy that resultsfrom the use of high superheat is valuable, and brings out the
418 TRANSACTIONS OF THE A.S.M.E. JULY, 1940great importance that correct principles of superheater designhave upon the satisfactory operation of locomotives.The record of locomotive construction throughout the world,during the last thirty years, amply sustains the conclusion thatthe fire-tube superheater has proved the only practical design forthe conventional locomotive boiler so far devised to obtain highsuperheat. Many other types have been tried, but without success.This record, however, although gratifying, has not stopped theresearch work of The Superheater Company as they for manyyears have been engaged in a systematic and complete programof superheater design.Every practical form of superheater unit so far conceived hasbeen tested by The Superheater Company to determine the formof unit that would give the maximum superheat and highest evaporation,combined with minimum draft loss, minimum pressuredrop through the superheater, low weight and cost, and, at thesame time, be easy to maintain.The author’s replies to several of the questions raised by Mr.Meister in his discussion will answer some of the points raisedby Mr. Ostermann.Mr. Pownall adds a valuable contribution. Based on years ofexperience in this field he has confirmed the importance of testing,also modification of designs to meet specific operating conditions.His work in the development and improvement of the locomotivefront-end construction is well known.Mr. Pownall suggests that the cost of boiler repairs, stated bythe author to be about 30 per cent of the total cost of repairs,should not exceed 15 per cent.The 30 per cent figure was quoted from the report of the FederalCo-Ordinator of Transportation on comparative cost of steamlocomotiverepairs, dated November 7, 1935, page 82, and beingof great interest is quoted below:Boiler Repair CostsIn response to the question: “Do you have data separated soas to show what proportion of the total costs of repairs is properlychargeable to locomotive boilers? If the answer is ‘yes’ statethe percentage,” eight roads stated that they kept the data separatedand showed it varied from 19.2 to 37.4 per cent of the totalcost of locomotive repairs; one hundred and ten roads did nothave the separation, and ninety seven made estimates that ranfrom one to sixtv-five per cent. A summarization of their estimatesshowed:E stim ated proportionof to ta l cost of locomotive repairs d ue toN um ber of roadsboilers, per cent1 7 ...............................................................................................251 5 ...............................................................................................201 3 ...............................................................................................308 ...............................................................................................156 ...............................................................................................355 ...............................................................................................405 ...............................................................................................293 ...............................................................................................103 ...............................................................................................193 ...............................................................................................602 ...............................................................................................182 .............................................................................................. 272 .............................................................................................. 312 ...............................................................................................651 ............................................................................................... 11 ............................................................................................... 61 ...............................................................................................121 ...............................................................................................1 3 .51 ...............................................................................................161 ...............................................................................................221 ...............................................................................................261 ...............................................................................................331 ...............................................................................................441 ...............................................................................................491 ...............................................................................................6297Of the roads making an estimate, 68 of them, aggregating70 per cent of their estimates, ranged from 20 to 40 per cent, soit is probably fair to assume that a mean between these extremes,or 30 per cent, would be a fair general approximation. An effortwas made to develop to what extent the treatment of water hadaffected the cost of locomotive repairs. However, since there issuch a limited knowledge with respect to what the boiler repairscost, it was found impracticable to get much of value in this connection.From the foregoing it will be noted that only five class 1 railroadsout of 165 reporting had a boiler cost below 15 per centof the total cost.Mr. Roesch has submitted an interesting discussion on thesubject of the great importance to locomotive-boiler operation ofthe problems and phenomenon of burning fuel in firebox. In thepast this subject has been given much thought and study, andthere is no question but that further research is necessary, also,that available test data should be published and interpreted.There is one point in Mr. Roesch’s discussion upon which furtherthought may be given. He states, “Needless to say, thegeneral adoption of restricted grates was hailed by locomotivestokermanufacturers as it fully supported their contention thatstack loss was not a question of coal size as fired but rather one ofair openings through the grates and draft influence.”The author feels that this statement cannot be accepted as itstands without further explanations and qualifications as it iscontrary to his own experience as to the effect that the size or percent of fineness of coal has upon stack loss or unbumed fuel loss.The author has personally conducted many fuel tests whichshowed that the greater the percentage of fineness in the coal asfired, the greater the stack loss, based on exactly identical locomotives,heating value of fuel, and method of firing. Many testsconducted, some within recent years, have proved this to be so.With the permission of W. G. Knight, mechanical superintendent,Bangor and Aroostook Railroad Company, the followingabstract is quoted from the test report of a recent test mostcarefully conducted on this road.“ In 1939 a thorough investigation was made on the Bangor andAroostook in connection with noted increase in coal consumption.“E very cargo of coal that this Com pany buys is analyzed, and acareful study made indicated that the chemical composition of thecoal was good, and it was, therefore, necessary to look elsewhere forthe cause.“Stack losses were known to be excessive and tests with dynamometercars were made under the following conditions:“Two carloads of coal of approximately 80 tons were screened andthe amount of fines removed from the coal would be everythingbelow the Vs" screen mesh. This coal was run through the stokerand rescreened again. From this test approximately 28 per centfines would pass through the V: in. screen.“Two engines, identically of the same construction, one beinghand-fired, and the other stoker-fired, were used for the test.“A coal car was used behind the locom otive to catch all cindersthat could be obtained for the purpose of getting samples to analyzetheir heat value.“The results showed among other things that by using screenedcoal containing 1.24 per cent slack the saving obtained when comparedwith the same coal having different percentage of slack wasfound to be as follows:Slack,per cent12.023.828.0F uel saving lb perM .G .T .M . in per cent812.216.0The conditions of the locom otive and test were identical in all comparisons.“It was further found from these experiments that the differencefrom the coal consumption of run-of-mine coal having 25 per cent to30 per cent fines as compared with the 15 per cent fines amounted toapproximately 10 per cent.“Results from operation extending over a year on coal having 15per cent or less slack have even shown on average operation slightlybetter than 10 per cent saving.”The foregoing quoted test results on the Bangor and Aroostook
BRANDT—THE LOCOMOTIVE BOILER 419are confirmed by recently conducted fuel tests on the New YorkCentral Railroad.These tests were run for the specific purpose of determining thequalities of different grades of fuel, under identical conditions, ofa modern 4-6-4 type locomotive, on standing blowdown tests.Permission has been granted to quote the following conclusionsrelating to the subject of the effect of fineness and slack in fuel.“Preliminary results of tests on fuel from six different m ines inwhich the percentage of slack in the coal varied from straight eggcoal with no slack (w hat is com monly known as 100 per cent egg) to40 per cent egg with 60 per cent screenings or 60 per cent slack.“The test showed that where the slack content has been increasedthe coal rate was correspondingly increased for identical rates ofevaporation for practically all the fuel fired.“Coals of practically the same chemical composition and someslight difference in the B .t.u. value will result in an inferior boilerperformance as the use and percentage of screenings is increased.“The use of increased percentage of screenings, resulting in a lowerboiler evaporative capacity, will affect the locom otive performance.This decrease in the boiler performance m ay be of sufficient m agnitudeto reduce the locom otive performance required for heavy trainson fast schedules 10 per cent.”From the foregoing it would appear that this question is ofgreat importance and is worthy of the very careful study that itis now receiving at the hands of the various railway administrations.Mr. Sillcox’s comments are of great value because of theprominent part that he has taken in the development of the steamlocomotive. His reference to a new approach to the use of pulverizedcoal and water-tube boilers is particularly timely.Many studies have been made of this, and different types ofwater-tube boilers have been built in this country and in Europe.So far only a few locomotive tube boilers have operated successfully.These have been confined to good feedwater territories.For high availability, that is, long periods of continuous servicethat we strive for today, it is necessary, no matter what theconstruction of the water-tube boiler may be, to use only fullytreated water; or in conjunction with condensing operation of theengine when pure scale-free boiler feedwater will be assured.Mr. Sillcox’s reference to the use of pulverized fuel is also important.Based on various tests with burning pulverized fuel itappears practical to design a locomotive firebox for the conventionalstandard boiler, or water-tube boiler, in such a manner asto satisfactorily burn pulverized coal at rates that will satisfyand exceed any demands so far placed on the modern locomotive.To do so it will necessitate pulverizing the coal very finely asthis will increase the speed of the combustion process by a morerapid contact between the molecules of carbon and oxygen.At maximum rate it should appear possible to obtain a combustionefficiency of 95 instead of 60 per cent, or less, with thepresent standard method of firing. This increase in the combustionefficiency, in addition to the other advantages that willaccrue from burning of pulverized fuel, must pay for the totalcost of pulverizing the coal.The discussion by Mr. Wallace is welcomed indeed in view ofthe intimate knowledge which he has had of research problemsaffecting locomotives and railway operation. His comments onthe necessity of reducing the delay at terminals are pertinent asevery minute saved on stops and slow orders will decrease theelapsed time between terminals.Mr. Wallace again stresses the necessity of a coordinated programof test and research for the further improvement of thesteam locomotive, and that the development of a more efficientand lighter boiler must go hand in hand with the development ofthe prime mover as the steam consumption of the engine mustbe reduced substantially below the present practice.Whether this new prime mover will take the form of a reciprocatingor rotating steam engine, or turbine, can only beanswered by future developments, but, in any case, it is apparentthat condensing operation is a very desirable thing not only toreduce the specific steam consumption of the prime mover, butalso to furnish pure condensate for the boiler feedwater.The most recent practical development now in sight is theperfection of the Franklin improved cylinder arrangement withpoppet-type steam and exhaust valves driven with a cam valvegear.Such an arrangement is now being successfully used in theUnited States, and has shown a remarkable improvement inpower development at high speeds.
Design Factors Controlling the Dynam icPerform ance of Instrum entsB y C. S. DRAPER,1 CAMBRIDGE, MASS.,T h is paper p r e se n ts a g e n era lized tr e a tm e n t o f in s t r u m e n ts w h ic h h ave a sin g le m o v a b le in d ex , c o n tr o lled byth e m a g n itu d e o f a sin g le a c tu a tin g q u a n tity . S u ch a nin str u m e n t a c ts a s a sy s te m w ith o n e degree o f freed o ma n d is stu d ie d b y th e w e ll-k n o w n m e th o d s d evelop ed forsu ch sy ste m s. In s tr u m e n ts w h ic h in c lu d e se rvom ech a n ism s c a n n o t b e tr ea te d a s s y s te m s w ith o n e d egree o ffr ee d o m a n d are th erefo re e x clu d ed fr o m c o n sid e r a tio n .F rom th e sta n d p o in t o f sta tic in d ic a tio n s, it is sh o w n th a tth e e sse n tia l p ro p erties o f a n in str u m e n t c a n be sp ecifiedin te r m s o f range, scale se n sitiv ity , c a lib r a tio n error, e n v iro n m en ta l error, a n d u n c e r ta in ty . T h e d e fin itio n a n du se o f e a ch o f th e se q u a n titie s is d iscu ssed .It is sh o w n th a t th e resp o n se o f a n in s tr u m e n t to rapidc h a n g e s in th e a c tu a tin g q u a n tity c a n be c a lc u la te d i ftw o p a ram eters c a lled in s tr u m e n t c h a r a c te r istic s arek n o w n . O ne o f th e se p a ram eters h a s th e d im e n sio n o ftim e a n d is called th e c h a r a cte ristic tim e . T h e secondparam eter is n o n d im e n sio n a l a n d is called th e d a m p in gra tio . N o n d im e n sio n a l cu rves, sh o w in g in s tr u m e n t respo n ses to th r e e ty p ic a l v a r ia tio n s in th e a c tu a tin g q u a n tity , are p lo tte d for a series o f v a lu es o f th e d a m p in g ra tio .T h ese curves are u sed in a n illu str a tiv e exam p le to sh o whow th e v a lu es o f th e in str u m e n t c h a r a c te r istic s, req u iredto k eep d y n a m ic errors b elow a giv en lim it, c a n be d e te r m in e d in a p r a ctical case.INSTRUMENTS must be designed to meet many types ofservice. Although individual instances will often presentproblems which call for particular construction detailsor special materials, certain aspects of instrumentation can begeneralized to include the requirements of many practical cases.Such generalizations are useful not only in writing specificationsfor equipment but also in the analysis and discussion of instrumentproblems. The system which is outlined herewith hasbeen developed for teaching and design purposes at the MassachusettsInstitute of Technology. Emphasis is placed on thepoints of similarity between instrument problems rather thanon the differences which appear when a comprehensive schemeof terminology is applied. For a classification of instrumentsfrom the standpoint of their use in industry the reader is referredto the works of Behar (l),3 and Smith and Fairchild (2, 3).Reduced to the simplest terms, an instrument is so often anarrangement in which the position of a pointer or index is controlledby some physical quantity, that instruments of othertypes may be considered as special cases. In the operating rangeof an instrument, it is usually intended that a continuous motionof the index will follow a continuous change in the actuating1 Professor of Aeronautical Engineering, M assachusetts Instituteof Technology. M em. A .S.M .E.1 Consulting Engineer, W altham W atch Company.3 Numbers in parentheses refer to the Bibliography.Contributed by the M achine Design Com mittee of the M achineShop Practice D ivision and presented at the Annual M eeting Philadelphia,Pa., December 4-8 , 1939, of T h e A m e r i c a n S o c i e t y o fM e c h a n i c a l E n g i n e e r s .N o t e : Statem ents and opinions advanced in papers are to beunderstood as individual expressions of their authors, and not thoseof the Society.a n d G. P. BENTLEY,2 WALTHAM, MASS.quantity which controls the instrument. A device in whichthis result has been achieved by design falls into the categoryof systems with 1 deg of freedom and will be called an “elementaryinstrument.” Unless otherwise specified, the term “instrument”will always refer to an elementary instrument. One ofthe authors and G. V. Schliestett (4) have discussed in generalizedform the mathematical analysis of elementary instruments.The analysis divides naturally into two cases, depending uponthe way in which the actuating quantity changes. If theactuating quantity is constant, the index will become stationaryand the instrument subjected to “static conditions.” On theother hand, if the actuating quantity is varying so rapidly thatthe index does not follow the changes exactly, the instrument isoperating under “dynamic conditions.” Practical problemsdeal with the properties required in an instrument to meet certainstatic requirements and to perform satisfactorily undergiven dynamic conditions. The present paper suggests amethod of specifying the essential features of an instrument interms of characteristics which can be conveniently applied eitherfor design purposes or for determining the suitability of aninstrument for use in a given situation.S t a t i c C h a r a c t e r i s t i c sThe essential external features of an elementary instrumentare shown in Fig. 1. From the standpoint of performance, theq - ACTUATING OUANTITYq j - INDEX POSITIONq 3- SCALE READING IN TERMS OF ACTUATING OUANTITYFio. 1 E s s e n t i a l F e a t u r e s o f a n E l e m e n t a r y I n s t r u m e n tmechanical details inside the case of an instrument are unimportant.It is sufficient to know that the instrument containsa mechanism of some sort which produces a change in an indexwhen a change occurs in the actuating quantity. If the instrumentbelongs to the general class called “meters,” a scale isattached to the structure which directly associates each positionof the index with some measure of the actuating quantity.Other instruments may not include a scale and so would bedisqualified as meters. However, there is always the possibilityof interpreting index positions in terms of the actuating quantityby means of tables or calibration curves. For purposes of discussion,any means capable of performing the function of identifyingsome state of the actuating quantity with each position ofthe index will be called a “scale.”The general nature of an instrument mechanism is determinedwhen the actuating quantity is given. The requirementsof static performance for the mechanism and the scale may bespecified in terms of the range and the scale sensitivity. Rangeis the difference between the highest and lowest magnitudes ofthe actuating quantity which the instrument is to measure.
422 TRANSACTIONS OF THE A.S.M.E. JULY, 1940Scale sensitivity is the ratio of a small change in scale reading tothe corresponding small change in index position, i.e.Scale sensitivity = S, = dqjdq4...................... [1]In general S, may be different for different parts of the scale orit may be constant throughout the range. A vapor-pressurethermometer, using a pressure gage of uniform sensitivity as theindicating system, will have a temperature scale of varyingscale sensitivity.For static conditions, an instrument with a scale perfectlysuited to the mechanism, with no friction or hysteresis in themechanism and not affected by changes in physical quantitiesother than the actuating quantity, would be completely specifiedby the range and scale sensitivity. Such an instrument wouldbe perfectly accurate in the sense that the scale reading wouldalways be equal to the actual value of the actuating quantity.This condition may not be fulfilled but, in any case, a smallchange in the scale reading may be related to a small change inthe actuating quantity by the equationdq, = Cdq.........................................[2]where C is the calibration coefficient. Obviously the conditionfor an ideal direct-reading instrument is for the calibrationcoefficient to be unity. Keeping in mind that C may vary overthe range in practical cases, the scale reading corresponding toa given magnitude of q can be found by integrating Equation[2] to obtainQ. = Cq + K ...................................... [3]where K is the constant of integration and C is a proper averagevalue of the calibration coefficient. If the zero adjustment ofthe instrument is set so that the scale reading is correct (q, = q)at some part of the scale, the constant of integration can beeliminated from Equation [3]. The actual instrument performancecan then be expressed by means of a plot ofC = q ./q...........................................[4]as a function of the scale reading.In practice the variations of the calibration coefficient overthe range of an instrument are so small that a plot of staticcorrections is more convenient for studying performance than aplot of the calibration coefficient itself. If the static correctionis defined as the difference between the actual magnitude of theactuating quantity and the scale reading, Equation [3] gives( \ __q \Static correction = qCOrr = q — q, = q, I —= — J ........[51or, expressed in terms of the fractional static correctionFractional static correction = qmrr/q, = (1 — C )/C .......[6]The fractional static correction expressed as a percentage is ameasure of the inaccuracy of the scale reading in any particularcase, but it is inconvenient for generalized discussions, since itvaries with both the correction and the scale reading. Forspecification purposes, it is better to express the correction as apercentage of the highest reading on the scale. In this formthe correction will be called the full-scale fractional static correctionand will be given the symbol Aqs} where— qoorc/Qs.................................. [7]and Q3 is the difference between highest and lowest scale readingsor total scale range.A n a l y s i s o f S t a t i c C o r r e c t i o n sMany instrument mechanisms are affected to some extentby changes in physical quantities other than the actuatingquantity. These physical quantities together make up theenvironment of an instrument. The process of marking off thescale to read directly in terms of the actuating quantity is calledcalibration and must be carried out under some particular stateof the environment which establishes the calibration conditions.Static corrections can be broken down on the basis of thesource responsible for each component. These componentsand a corresponding symbol in terms of full-scale fractional staticcorrection are as follows:1 Calibration error (Aqc) is due to improper fitting of thescale to the instrument under calibration conditons.2 Environmental error ( Aq,) is due to variations of the environmentfrom calibration conditions.3 Uncertainty ( Aqu) is due to imperfections in the instrumentmechanism such as rubbing friction between solid parts, hysteresisin elastic members, etc.Calibration errors often appear when instrument mechanismsare attached to independently graduated scales without specialadjustments. The slow changes due to wear and aging effectsmay also produce calibration errors. Such errors may be foundby experiments carried out under calibration conditions. Environmentalerror can sometimes be calculated but can alwaysbe determined by experiment. For any particular reading ofa given instrument, the calibration error and the environmentalerror can be combined into a correction which removes boththese errors when applied to the reading. In addition to themethod of correction, environmental errors can be eliminatedby designing the instrument mechanism to be unaffected bychanges in the environment. An instrument constructed inthis fashion is said to be compensated.Uncertainties differ from the errors just considered in thatthey cannot be exactly determined for a particular scale readingand applied as a correction. Uncertainty appears when a scalereading is made from a pointer of finite width. Rubbing frictionbetween solid parts in the mechanism is a second typical causeof uncertainty. Due to this friction, some finite change in theactuating quantity must occur before a detectable motion ofthe index appears. From this standpoint, uncertainty, as theword is used here, is similar to ultimate sensitivity as this termis accepted by Behar (1).In general, it is only possible to set an upper limit for theuncertainty associated with a particular scale reading. Smith(3) has applied the term “dead zone” to a similar concept. Accordingto Smith: “The dead zone is the extreme range of valuesof the variable possible without moving the indicator from agiven position, in the absence of abnormal vibration; the deadzone is ordinarily twice the frictional error.” Actually the uncertaintyin any particular scale reading may be anything fromzero to a maximum value determined by friction or the pointerwidth. The exact value of the uncertainty in a given instancewill depend upon the previous history of the scale reading,condition of the instrument mechanism, vibration, etc. Althoughit might be possible to estimate the uncertainty in particularcases, the usual procedure is to accept the maximum uncertaintyas a fundamental limitation on the accuracy of aninstrument.D y n a m i c E r r o r sRapid changes in the actuating quantity are accompanied bydifferences between instantaneous scale readings and the truevalues of the actuating quantity which occur at the same time.For any particular case, the static correction may be responsiblefor part of such differences but there will, in general, be anothercomponent peculiarly due to the fact that the actuating quantity
DRAPER, BENTLEY—DESIGN FACTORS IN DYNAMIC PERFORMANCE OF INSTRUMENTS 423is changing. This latter component will be called the “dynamicerror.” Fig. 2 graphically illustrates the concepts of dynamicerror and the corresponding time lag for a case with negligiblestatic corrections. From Fig. 2, dynamic error is the differencebetween q and q, at a given instant, while time lag is the timeinterval between the instant the actuating quantity passesthrough a certain value and the instant at which the scale readingreaches this value.Many authors have studied the problem of dynamic errors.In the field of industrial instruments, Behar (1), and Smith andFairchild (3) have summarized the methods of attack and havegiven typical results. The work of Draper and Schliestett (4),in reducing the analysis of dynamic errors to generalized nondimensionalforms suited for engineering use has already beenmentioned. The discussion which follows deals with a schemefor analyzing the dynamic errors of an elementary instrumentF i g . 2D y n a m ic E r r o r a n d T im e L a gin terms of two characteristic parameters. One of these parametershas the dimensions of time and will be called the “characteristictime.” The other parameter is dimensionless and maybe either the damping ratio or the characteristic damping number.In certain cases, the undamped natural frequency may convenientlybe used as the time parameter. Methods for determiningthese parameters in actual cases have been described(4). The treatment which is outlined in this reference will bereviewed briefly in the present paper and extended to showhow the characteristic parameters may be applied to engineeringproblems.For any given instance, the dynamic error will vary with timein a manner dependent upon the characteristics of the instrumentused and upon the way in which the actuating quantitychanges. This means that each set of circumstances will requirespecial treatment for an exact determination of dynamicerrors. The amount of work necessary can be reduced by approximatingactual variations in the actuating quantity by meansof changes falling into three basic types. In the first of thesetypes, the actuating quantity changes so rapidly between twoconstant values that the change is completed before the instrumentreading has changed appreciably. A change of this sortis called a “step function.” The second type occurs when theactuating quantity varies directly with time and will be called a“linear change.” The third type is a continuous sinusoidalvariation which may actually be one component of a more complicatedperiodic change. It will be shown how the instrumentcharacteristics can be simply applied to predicting the dynamicerrors which occur with each type of variation in the actuatingquantity.G e n e r a l i z e d E q u a t i o n o f M o t io nMotion of an instrument index is determined by the balancebetween effects of four types which, for purposes of discussion,will be considered as generalized forces, as follows:1 Restoring forces which tend to move the index towardsome equilibrium position with a force magnitude proportionalto the divergence of the index from that position.2 Damping forces which resist motion of the index with aresultant magnitude proportional to the index velocity. Thisassumption yields useful results for many cases in which itrepresents an approximation.3 Inertia forces which are proportional to acceleration of theindex.4 Forces which depend upon the magnitude of the actuatingquantity. These forces are responsible for initiating changesin the index position, and for this reason, the mathematicalexpression which specifies the actuating quantity as a functionof time will be called the “forcing function.”It has been shown (4), that the first three of these forces maybe expressed in terms of the scale reading to give the equationof motion in the form(c h )d \/d t2 + (ai)dq,/dt + (a0)qs = a„q..................[8]This equation can be solved by well-known methods (5) for theease in which the coefficients a0, oi, and o2 are constants. Whenthese coefficients vary either with time or with the scale reading,a solution is usually so difficult to handle that the assumptionof constant coefficients is made even for eases where it is not true.The resulting solutions will not be exactly correct but will oftengive a picture sufficiently close to physical facts for engineeringpurposes. These solutions will show the way in which the scalereading varies with time for a particular instrument under givenconditions. The actual value of the actuating quantity at anyinstant can be found from the forcing function so the dynamicerror is completely determined as the difference (q — g() or ona fractional basis as (1 — q jq ).Two types of problems involving dynamic errors appear inpractice. In the first type the coefficients associated with agiven instrument are known and it is desired to find the dynamicerrors existing when a particular forcing function is applied.Cases of this nature are simple in that it is only necessary tocarry through straightforward solutions of Equation [8]. Problemsof the second type start with requirements on the magnitudeof dynamic errors accompanying certain forcing functions andlead to values of the coefficients (instrument design constants)do, Oi, and a2 as the desired results. The object of generalizingthe analysis of dynamic errors is to reduce the amount of effortrequired for solution of either type of dynamic-error problem.The method of attack is to divide Equation [8] through by a2,so that the coefficient of the first-derivative term has the dimensionsof reciprocal time, and the coefficient of the term in q,has the dimensions of reciprocal time squared. The coefficientof the first-derivative term can be used to establish a characteristictime for an instrument. It will be shown that one additionalparameter in the form of a dimensionless ratio will completelyspecify a given instrument. The dimensions of theactuatingquantity in any particular case are immaterial sincetimeis the only dimension involved in the characteristics. Thecharacteristics completely define the equation of motion so itfollows that all instruments with the same characteristics will!have the same dynamic errors under identical forcing functionsandinitial conditions. Because of this fact, it is possible toplotfamilies of nondimensional curves for the dynamic responseof instruments to the three forcing-function types which havebeen chosen as representative practical cases. With these
424 TRANSACTIONS OF THE A.S.M.E. JULY, 1940curves available, it is possible to solve a wide range of dynamicerrorproblems by a simple inspection of the curves. Themathematical background necessary for proper use of the instrumentcharacteristics is outlined and the use of nondimensionalperformance curves is illustrated by examples.S o l u t i o n o f E q u a t i o n o f M o t i o n i n T e r m s o f I n s t r u m e n tC h a r a c t e r i s t i c sEquation [8] has solutions which give the variation of thescale reading q, with time. These solutions have the generalform t 2) ....................................[15]When the transient becomes oscillatory, the characteristicdamping number becomes a complex quantity which is difficultto interpret for practical purposes. A dimensionless ratio whichcan be conveniently applied in any case is the damping ratio.This ratio is defined as the ratio of the coefficient eti whichactually exists to the coefficient au which must exist for thecondition which divides oscillatory from nonoscillatory transients.Mathematically this critically aperiodic condition isreached when(ai/2a2)2 = o0/o 2.................................[16]For this caseandn = r2 = r ......................................[17]Damping ratio = f = ai/au = v = t i / t 2 = 1.........[18]It follows that when f is less than unity, the transient will beoscillatory, while the transient will be nonoscillatory for valuesof f greater than unity. The characteristic damping number willbe unity when the transient is critically aperiodic, greater thanunity for nonoscillatory transients, and complex for oscillatorytransients.In order to solve dynamic-error problems, certain definitions,in addition to those already discussed, are convenient. The“circular natural frequency” is defined asCircular natural frequency = a = \ / a0/a 2 — (ai/2a2)2. . . . [19]oj = 2im = 2t / T ..................................[20]In Equation [20] n is the natural frequency and T is the naturalperiod. When the coefficient Oi is zero, the quantities thus
DRAPER, BENTLEY—DESIGN FACTORS IN DYNAMIC PERFORMANCE OF INSTRUMENTS 425F i g . 3I n s t r u m e n t R e s p o n s e t o a S t e p F u n c t i o ndefined become the undamped natural circular frequency, theundamped natural frequency, and the undamped natural period,respectively. The undamped condition is indicated by a subscriptn on each of the quantities so thatandwn = y/ao/ch = 2 rn„ = 2 r/T n.................. [21]“ = *>» \ / l — f 2 ................................ [22]A convenient way of remembering the relationships betweenthe instrument characteristics and the other essential quantitiesinvolved in the solution of dynamic-error problems is towrite the original differential equation of motion in terms of thederived quantities. The result of this procedure is as followsIn Equations [27], [28], [29], and [30], the symbols A, B,and 0 9 = qa dq/dt = 0When the fitting constants of Equations [27] to [30] are adjustedso that the general transient equations meet the particularinitial conditions of the step function, the results are
426 TRANSACTIONS OF THE A.S.M.E. JULY, 1940The general nature of these transients is so well known thatit is unnecessary to include a detailed mathematical discussion.From an engineering standpoint, the important point is thata family of curves can be plotted with
DRAPER, BENTLEY—DESIGN FACTORS IN DYNAMIC PERFORMANCE OF INSTRUMENTS 427than if Equations [37], [38], and [39] had been plotted directly.The curves of Fig. 4 show that, as the transient dies out, theinstrument reading differs from the true instantaneous value ofthe actuating quantity by an amount which tends to a constantvalue of 2t;2Mr for oscillatory transients, 2 Mr for the criticallyaperiodic case and [(>> + l ) !/2 v]Mr for the nonoscillatory case.This is an example of a steady-state dynamic error which isconstant and corresponds to constant time lag in terms of Tnunits. Fig. 5 shows the curves of Fig. 4 plotted directly fromEquations [37], [38], and [39]. The effect of damping on thecharacteristic time is shown by the expanded abscissa scale asthe damping ratio is increased.Instrument engineering problems are usually concerned withthe dynamic error rather than with the actual instrument readingat any instant. For generality, it is convenient to expressthe actual reading in terms of the correct reading at any instant.The correct reading will always be the instantaneous value ofthe actuating quantity and in terms of Mr units is equal tot/r. It follows thatThe instantaneous value of the dynamic error, expressed as afraction of the true value of the actuating quantity, will beCurves showing the fractional reading and the dynamic erroras a function of t/r for values of f from 0.1 to 2.35 are plotted inFig. 6. The use of this family of curves will be illustrated later.S t e a d y - S t a t e D y n a m i c E r r o r s D u e t o a S i n u s o i d a l V a r i a t i o n o f t h e A c t u a t i n g Q u a n t i t yMany practical situations may be represented in terms ofperiodic changes in the actuating quantity. In cases where thedisturbance exactly repeats itself, a Fourier series of sines orcosines will accurately describe the physical facts. Even if
428 TRANSACTIONS OF THE A.S.M.E. JULY, 1940this condition is not precisely fulfilled, satisfactory results canoften be obtained by the use of a sinusoidal forcing function tofind the corresponding steady-state solution of Equation [24],Thus if the forcing function isq — qa sin wf t ..................................... [42]the steady-state solution as found by conventional methods (5)can be written asIn Equation [43]The expressionq,/q„ = / 1 ....... .... sin — ..........[43]V (1 — f)*y + (2f/3)su>j = 2m f = 2-w/Tf = circular forcing frequency....... [44]0 = Uf/osn = frequency ratio.......................... [45]v = tan-1 (2fi8)/(l — /32) = lag angle..........[46](?«/?»)« = M= I /'S /(1 — /?2)2 + (2f/3)2 = amplitude ratio.. [47]is very u sefu l in con n ection w ith in stru m ent problem s in volvin gperiodic changes. A fam ily of curves of m again st (i is g iv en inF ig. 7. P ractical in stru m ent problem s u su ally in v o lv e valu es ofth e frequency ratio less than u n ity so o n ly th is range has beencovered in F ig. 7. A fam ily o f cu rves show in g th e lag angle as afunction of /3 for th e sam e range as th a t of F ig. 7 is g iv en inF ig. 8.General Design of an Instrument to M eet GivenSpecificationsThe ideas previously discussed are particularly useful fortranslating performance specifications for an instrument intoterms of mechanical details. In practice every instance willpresent problems requiring special treatment, but the generalprocedure can be illustrated by an example which might reasonablyoccur as an actual case. This example will deal with thepreliminary design of a recording pressure indicator for slowspeedsteam engines or air pumps. Specifications start with therequirement that the instrument must be able to operate forreasonable periods of time under the conditions of pressure,temperature, vibration, etc., which exist in service. Beyondthis necessity of satisfactory mechanical operation, the desiredproperties of the indicator can be defined in terms of staticspecifications and dynamic specifications. The specificationsassumed for the present example are listed as follows:Static specifications:Range— 20 lb per sq in. below atmospheric pressure to 160 lbper sq in. above atmospheric pressureScale sensitivity— 50 lb per sq in. per in. (constant over range)Calibration error-—2 lb per sq in. (maximum)Environm ental error— 1 per cent of range per 10 C temperaturechangeUncertainty— 1 per cent of range (maximum).Dynam ic specifications:Step function— Indicator m ust give reading within 10 per centof actual pressure, 0.05 sec after sudden pressure change(.Qt/Qa between 0.90 and 1.10; t — 0.05 sec)Linear change— Gage m ust follow pressure increasing linearlyw ith tim e with dynamic error of less than 10 per cent at endof range, when pressure change is such that range would becovered in 0.07 sec (g«/qa between 0.90 and 1.10; t = 0.07 sec)Sinusoidal change— Gage m ust follow sinusoidal pressure changeswith maximum frequency of 4 cycles per sec within an amplitudeerror of less than 10 per cent and a phase-angle lag ofless than 10 deg (p between 0.90 and 1.10;
DRAPER, BENTLEY—DESIGN FACTORS IN DYNAMIC PERFORMANCE OF INSTRUMENTS 429of the spring stiffness, this means that the natural undampedperiod of the system will be a maximum. For a given dampingratio, the characteristic time is proportional to the undampednatural period, so the general problem can be resolved into findingthe minimum value of 1/ t for which the dynamic-error specificationis not exceeded. For steady-state sinusoidal changes,a minimum value of the frequency ratio /3 corresponds to aminimum value of t/r for the other cases.Table 1 gives a summary of the numerical work required tosolve the problem discussed in the preceding paragraphs. Forlow values of f where oscillation is noticeable, the minimumvalue of 1/t must be selected so that the specified ordinate limitsare not exceeded for any greater value of t/r. For example,in Fig. 3 the curve for f = 0.2 crosses the 10 per cent error lineseveral times, but the critical value is the last crossing at t/r =2.1.In general as the steady-state-lag specifications are mademore severe (specified lags are made smaller), the required undampednatural frequency is increased for a given value of f, orthe damping ratio must be decreased for a given natural frequency.For the step function, the reverse is true, since theresponse to such a change is more accurate, as f is increased toabout 0.7. It follows that the characteristics selected for aninstrument must be a compromise between conflicting trends.In many cases, it is mechanically easier to construct an instrumentwith a low rather than a high undamped natural frequency.This will probably be true for a spring-and-piston engine indicatorlike that of the present discussion, so the results summarizedin Table 2, which are based on the assumption of a critical lowerlimit to the undamped natural frequency, represent at least onereasonable engineering solution to the original problem. Itfollows that an indicator with a damping ratio of 0.5 and acharacteristic time of 0.0140 sec will be satisfactory. The correspondingundamped natural frequency will be 23 cycles per sec.After an analysis of dynamic performance has been carriedout along the lines suggested in the foregoing discussion, it maybe found very difficult to obtain the required characteristics inpractice. For example, an engine indicator would probablynot have a damping ratio of 0.5 without including some specialdamping system in the mechanism. In such a case, the originalspecifications must be relaxed or the expense of building a morethan usually complicated instrument accepted. It is evidentthat the dynamic-error specifications, which can actually befulfilled by a given indicator, may be found by using the dynamicperformancecurves in a process which reverses the methoddescribed.BIB L IO G R A PH Y1 “ Fundam entals of Instrum entation,” by M. F. Behar, Instruments Publishing Company, Pittsburgh, Pa., 1932.2 “A utom atic Regulators, Their Theory and Application,” byE. S. Smith, Jr., Trans. A .S.M .E ., vol. 58, M ay, 1936, paperPRO-58-4, pp. 291-303.3 “Industrial Instrum ents, Their Theory and Application,” byE. S. Smith, Jr., and C. O. Fairchild, Trans. A .S.M .E ., vol. 59, no. 7,October, 1937, paper PRO-59-9, pp. 595-607.4 “ General Principles of Instrum ent A nalysis,” by C. S. Draperand G. V. Schliestett, Instruments, vol. 12, no. 6, M ay, 1939, pp.137-142.5 “ Mechanical Vibrations,” by J. P. D en Hartog, McGraw-HillBook Co., Inc., N ew York, N . Y ., 1934.Values of f and t , which meet the dynamic specifications arelisted in Table 1. In order to satisfy all the conditions, theshortest characteristic time required for any of the three forcingfunctions with a given value of f must be chosen. Table 2 is asummary of the critical conditions established in Table 1. Thecritical values of the characteristic time have been converted intovalues of undamped natural frequency and undamped naturalperiod by the relationFrom Table 2, it is seen that, for low values of the dampingratio, the step function establishes the critical condition, sincethe low damping permits several natural-frequency oscillationsbefore the reading will remain below the specified error limit.As the damping ratio is increased, the transient component ofthe step-function response becomes of reduced importance,while the steady-state time lag for the other two forcing functionsis increased. In the present case, the steady-state time lag,during a linear change, and the phase-angle lag for a sinusoidalchange introduce limitations which are almost identical.DiscussionK. J. DeJ tjhasz.4 This paper represents a noteworthy endeavorto coordinate the scattered information on the dynamicbehavior of instruments into a coherent whole and make it morereadily available and understandable for students and practicingengineers. In view of the magnitude of the task, it is no detractionfrom the value of this paper to state that this objectivehas been only partially attained. The following remarks are intendedto complement the paper in some respects and to call attentionto some aspects in which further elucidation would be desirable.The title of the paper suggests a broader scope than is actuallythe case, as the treatment does not include discussion of seismographic-typeinstruments which depend for their function on alow natural period of the actuating member, such as seismographs,vibrographs, and torsiographs. A more detailed treatmentof Coulomb friction and backlash also would be desirable,as these enter into the functioning of most engineering instruments.1 Professor of Engineering Research, T he Pennsylvania StateCollege, State College, Pa. M em . A .S.M .E .
430 TRANSACTIONS OF THE A.S.M.E. JULY, 1940The writer questions the usefulness of the concept of “time lag”when dealing with transient changes. The “lag angle” in measuringa sinusoidally varying actuating quantity is a well-establishedand useful concept. The time lag of a transient changehas no meaning in cases in which the scale reading cannot followrapidly enough the increase and decrease of the actuating quantity,hence, some values of the actuating quantity are not indicatedat all by the scale reading. Furthermore, it may happenthat a scale reading is shown before the actuating quantity attainsthe corresponding value, i.e., the time lag is negative. Thiswould be tantamount to saying that the instrument knew beforehand,and predicted what was going to occur in the future, whichis of course absurd. Therefore the writer suggests that the conceptof time lag be dropped altogether when dealing with transientchanges, and the performance of the instrument be characterizedsolely by the “dynamic error,” i.e., the difference between theactuating quantity and the scale reading at a given instant, whichhas a real meaning in all cases. Attention should be focused onthe concept of “maximum dynamic error,” i.e., the maximumdifference between actuating quantity and scale reading.It would be highly desirable to elucidate the various abstractconcepts.As examples, the writer suggests:(а) The undamped natural period of an instrument is equalto the period of a simple pendulum having a mass equal to that ofthe instrument, and a length equal to its static deflection underits weight.(б) The maximum dynamic error decreases with the decreaseof the natural period.(c) The critical damping is brought about by a damping forcewhich is just sufficient to dissipate the potential energy of the instrument.Possibly these definitions could be further elucidated or improved,in order to reduce to the minimum the mental effort necessaryfor their understanding.The writer cannot call to mind any instrument in which theconcept of “e/ror after the elapse of a given time” would be ofadvantage, or could be stipulated in advance. In most casesthe requirements are as follows:(а) That the natural period and damping be as low as possible.This is the case with engine indicators, in which the “maximumerror” is proportional to the natural period, and the superimposedwaves can be allowed for by simple inspection, or more accurately,deducted from the curve by graphical differentiation. An uncertainamount of damping (or friction) is far more difficult totake into account.(б) That the damping be the lowest causing the instrumentto “dead-beat,” i.e., critical damping. This is the case withquick-weighing scales, in which the overshooting of the pointeris prevented by a dashpot. In such cases it is farfetched tostipulate, and hardly feasible to design in advance, a definitedamping ratio. Such dashpots are designed by a rough advancecalculation, relying on the fortunate fact that the final adjustmentcan be readily made by means of a needle valve.In view of the ever-increasing importance of instrumentation,and corresponding attention given to the theory and design ofinstruments, further investigations in this field are greatly to bedesired, and the authors’ paper is welcomed for stimulatingthought in these problems.E. S. Smith.6 Figs. 7 and 8 and their context, dealing with“steady-state dynamic errors due to a sinusoidal variation of theactuating quantity,” offhand appear to this writer to comprise thenovel portions of the paper and as such should be useful to engineersworking in this art. Nothing that appears anywhere inthis discussion is to be taken as minimizing the value of theauthors’ contribution which unquestionably involved the expenditureof a considerable amount of effort with a correspondingreduction in the work which others in this special field mustdo.The treatment is not in fact general, as stated in the summary,since it is not applicable to common servo-operated measuringand controlling instruments which move at constant speed fromone position to the next or are intermittently actuated; instead,it seems to be limited to a special (lineal-law) sort of self-operatedmeter. The treatment does not fit even the ordinary flowmeterwhich responds to a differential pressure which increases with thesquare of the velocity of flow.The terminology of the paper unfortunately differs radicallyfrom any of those in common use in this country. The AmericanSociety of Mechanical Engineers’ Committee on Industrial Instrumentsand Regulators is endeavoring to develop an authoritativeand generally acceptable terminology which should do muchto lessen the effort required in digesting papers such as this one,in which the points of possible originality may be obscured byunusual expressions.As to discussion in the present paper, of papers (2, 3) by Fairchildand the writer and the use of the term “dead zone” inpaper (3), it is regretted that such discussion was not made assuch, at the time the papers in question were presented, so thatthe usual closure could have covered it adequately. In viewof such belated discussion, the following brief answer may be inorder: The papers were presented with controlling (or regulating)as well as measuring in mind, and the treatment of measuring instrumentswas intended to be suitable for the metering portions ofcontrolling (or regulating) instruments. They were presentedto cover the basic theory involved in an introductory manner andwith the use of the unavoidable minimum of mathematics; however,such papers are believed to be more than mere “classifications”and to cover much of the material in the present paper.In this paper, the use of numerous Greek letters and the presentationof lengthy mathematical restatements of generally knownmaterial are objectionable, in so far as they exceed a reasonablerequirement of completeness. However, such repetition may bedefensible as making such material more readily available tomechanical engineers.The term “dead zone” was intended by Fairchild and thewriter to cover the maximum disturbance of the measured variablewhich cannot affect the meter and, hence, alter the positionof a controller, instead of referring to the error of a particularreading. Such a definition of this expression still appears to besubstantially correct, with usual ratios of starting friction to runningfriction, although an attempt was made to attain clarityrather than to sponsor an unassailable definition.The DeJuhasz treatment of the engine indicator in his book6on that subject appears to the writer to be essentially similarto that of the present authors on the linear change of the actuatingquantity, although it includes a more limited treatment of theamplitude of the response with sinusoidal variations with, offhand,no treatment of lag in such case.The authors might well test the usefulness of their two criteriaon the design of a commercially needed, reliable, and accuratepressure indicator for hydraulic transmissions of the multiplepistontype using, e.g., a working pressure of about 1500 lb persq in., a frequency of 12,000 cycles per min, and an unsymmetricalwave form (rounded tops and V-troughs).6 P atent Agent, C. J. Tagliabue Mfg. Co., Brooklyn, N . Y . M em. 6“ The Engine Indicator,” by J. K . DeJuhasz, Instrum ents Pub-A .S.M .E . lishing Com pany, Pittsburgh, Pa., 1934.
DRAPER, BENTLEY—DESIGN FACTORS IN DYNAMIC PERFORMANCE OF INSTRUMENTS 431Authors’ ClosureProfessor DeJuhasz and Mr. Smith have based their majorcriticism upon their opinions that the principles discussed in thepaper could not be applied to instrument problems of certaintypes and have advanced examples to prove their claim. Theauthors feel that this criticism is due to a lack of understandingof the manner in which generalized reasoning in terms of nondimensionalvariables can be applied to specific problems. Whensuch a method is used, a large part of the mathematical work canbe carried out once and for all to produce results in the form ofcurves which may be applied to any physical case described bythe differential equation used as the basis for the analysis. Touse such curves intelligently and to be able to handle cases whichmay fall outside the range of available plots, it is only necessaryfor an engineer to have a general understanding of the stepsfollowed in order to obtain the final results. For this reason,the analysis has been presented in some detail at the risk of“lengthy mathematical restatements of generally known material.”It was the authors’ intention to offer the possibility ofa saving in time and effort on the part of workers in the generalfield of instrumentation.In considering an instrument problem, it is only necessary forthe practicing engineer to satisfy himself that the behavior of agiven instrument can be described by a second-order differentialequation with constant coefficients. When this requirement isfulfilled, ability to use the curves of the present paper will providean engineer with specific information directly applicable tomany problems which could be duplicated from papers similar toreferences (2, 3), cited by Mr. Smith, only after many hours ofdetail work. Mr. Smith shows some recognition of this fact inhis statement, “ . . . such repetition may be defensible as makingsuch material more readily available to mechanical engineers.”The particular objection of Professor DeJuhasz that themethod of analysis described in the paper is not general, becauseit does not apply to the seismographic type of instruments formeasuring vibration, is definitely unjustified. As a matter offact, the method of analysis as presented was largely worked outduring the design of a line of vibration-measuring equipment foraircraft which has been commercially available for some time.A detailed discussion of the manner in which the methods explainedin the present paper can be applied to vibration-measuringinstruments was given by C. S. Draper and Walter Wrigleyat the 1940 Annual Meeting of the Institute of the AeronauticalSciences.7Mr. Smith states that the method of analysis discussed in thepresent paper does not apply to the case of an instrument suchas a flowmeter which involves a square law between the actuatingquantity and the reading of an indicator which responds to pressurechanges. As a matter of fact, the authors anticipated thisobjection by defining the sensitivities in terms of differentialchanges. Where nonlinear laws are required to express the relationshipbetween the actuating quantity and the index position,the coefficients of Equation [8] are actually differential coefficientswhich can be treated as constants over small ranges of operation.The sentences, which follow Equation [8] in the paper, discussthe case in which the analysis will not produce accurate resultsdue to variations of the coefficients with scale position. Inpractice, the analysis has been found adequate to handle the caseof dynamic errors in air-speed meters for aircraft when relativelysmall fractional changes in speed are involved. The assumptionsare similar to those used by electrical engineers in treating cir-cuits containing vacuum tubes and are subject to the same limitation,namely, that the results will have increasing errors as themagnitude of the changes is increased.The contention that the analysis does not include the case ofsystems which contain servomechanisms is only partially correct.Actually, the courses on theory and practice of servomechanismstaught by Professors Hazen and Brown at the MassachusettsInstitute of Technology use the same general method of nondimensionalanalysis as that described in the present paper. Foranalytical purposes it is convenient to consider any servomechanismas made up of a series of systems with 1 deg of freedom.Frequently, the analysis of the performance of a complete servo-system involves only a second-order differential equation. Evenwhere equations of higher order than the second are required, ithas been found helpful to use the ideas of damping ratio and undampednatural frequency. The example of a servosystem of therelay type, as suggested by Mr. Smith, may be analyzed in aparticularly simple fashion by use of the ideas discussed in thepresent case, but the method requires the application of a sequenceof forcing functions acting upon the individual 1-deg-offreedomsystems (elementary instruments) which make up theservomechanism.The criticism of the authors for failing to use a system ofterminology which as yet has not been published cannot be givenmuch weight. Surely it is granted that, until a system is unanimouslyadopted, the opportunity to present the arguments infavor of one which has been evolved through many exhaustivetests should not be denied. The terminology used in this paperhas been developed over a period of about 10 years by the studentsand teachers interested in instrumentation at the MassachusettsInstitute of Technology and is certainly familiar to andendorsed by a considerable number of engineers who at presentare working in the field of aircraft instruments and vibrationanalysis. The reason underlying development of the terminologyhas been the lack of a generally accepted system which could beapplied to dynamic problems of any type. The authors’ systemhas facilitated the solution of many problems. Furthermore,the time and effort required to teach or to acquire a knowledgeof instrument analysis have been reduced, as compared with thework required by an approach based entirely upon the contemporarytreatments available in the literature.The authors feel that the use of Greek letters in the list ofsymbols is a definite advantage in forming a systematic nomenclature.The general scheme is to use Greek letters for nondimensionalquantities and quantities with the dimensions of time,small Roman letters for variables or directly measured quantities,and capital Roman letters for undetermined coefficients. Thissystem has certainly justified its use by reducing the time requiredfor an engineer to understand the results of the analysisfrom an unfamiliar project.The authors disagree with Professor DeJuhasz that the quantitydefined as “time lag” is unimportant. Time lag is the essentialdesign variable in any instrument which must disregardsmall instantaneous variations of a quantity and indicate anaverage value. For example, the artificial horizon used as anaircraft instrument must have a time lag of such magnitude thatit will substantially disregard deviations of the resultant-forcevector from the true vertical. The requirement of a short timelag in a rate-of-climb meter used for maintaining level flight isobvious. Another application of the concept of time lag occurswhen an elementary instrument is used to detect changes in thephysical quantity actuating an automatic control system, shorttime lag being essential in order to start the system functioning7 “Instrum ents for Measuring Low-Frequency Accelerations inF light,” by C. S. Draper and W alter W rigley. Presented at thesoon after a change has occurred.M eeting of the Institute of the Aeronautical Sciences, Jan. 25, 1940.To be published in an early issue of the Journal of the AeronauticalSciences.The importance of “errorafter the elapse of a given time” is also apparent in this case.The existence of a negative time lag, as suggested by Professor
432 TRANSACTIONS OF THE A.S.M.E. JULY, 1940DeJuhasz, is a physical possibility and is merely an indicationthat the elementary instrument is oscillating.The concept of time lag, as the term was used in the paper,is useful and should certainly be retained in any comprehensivesystem of instrument analysis. On the other hand, the term“time lag” appears to be unsatisfactory and should probably bereplaced by other words to describe the same concept. ProfessorBrown of the Massachusetts Institute of Technology has suggestedthe term “response delay” to replace time lag. This termis descriptive of the concept involved and will be adopted bythe authors for future work.A discussion of Coulomb friction and backlash effects as suggestedby Professor DeJuhasz should certainly be included inany complete instrument analysis. One of the authors has includedthese effects in teaching instrumentation for some years.A reasonable generalized treatment would have been too long forinclusion in the paper. A study of Coulomb friction is includedby Den Hartog in his book (5).The use of analogies has not been found particularly helpful.It is better to allow an individual to apply theoretical results towhatever electrical, mechanical, acoustical, hydraulic, or othersystem which he judges to be most readily understandable. Forthis reason, the authors have omitted any attempt to make particularapplications of the generalized results in a fashion whichmight be useful in explaining the theory to a given group oflisteners. Mechanical analogies are readily accessible in bookson mechanical vibrations, while electrical analogies are discussedin many electrical-engineering texts.The authors have had some difficulty in recognizing the usefulnessof the pendulum analogy suggested by Professor DeJuhasz, inasmuch as the mass of an instrument is largely casestructure, which is not the mass of interest in this discussion.Furthermore the period of a pendulum is independent of thependulum mass. Of course, any pendulum of a length equal tothe static deflection of a 1-deg-of-freedom system will have thesame period as the system, but the advantage of this type ofanalogy is open to question.The maximum dynamic error normally decreases with decreaseof the natural period, but it is possible to show that this statementis not general. For example, if an instrument period is originallylonger than the fundamental forcing frequency, reducing thenatural period will cause the system to pass through resonancewhen the dynamic errors increase.The statement that the natural period should be as low aspossible and the damping near critical is unnecessarily restricting.One of the particular advantages of a generalized set ofcurves is that, when mechanical considerations limit the naturalfrequency which may be realized in practice, and hence limit/3, a satisfactory instrument may be obtained by a suitable choiceof the damping ratio. These considerations are clearly broughtout by a study of Fig. 7 of the paper, and further by the followingdiscussion of the instrument problem proposed by Mr.Smith. As noted in the paper, there is usually an infinite varietyof combinations of (3 and f which will satisfy specified instrumentperformance conditions. Therefore, it is the designer’s responsibilityto select that combination leading to the simplest andmost reliable mechanical construction.The hydraulic pressure indicator, proposed by Mr. Smith as adesign problem, cannot be analyzed by any methods without afull performance specification. The word “accurate” is not anengineering specification per se, it must include the acceptablenumerical tolerance range. It is this lack of reduction of instrumentspecifications to numerical terms that leads to many ofthe instrument designer’s headaches. It is also not quite clearwhether Mr. Smith intended the quantity to be measured accuratelyas the mean steady working pressure or the instantaneousvariations of pressure throughout the cycle. If the latter werethe problem in mind, the unsymmetrical wave form must bebroken down into a Fourier series. The predominant term will bethe fundamental frequency of 200 cycles per sec. To indicatethe pressure variations to any degree of accuracy whatsoever, aninstrument must respond to frequencies as high as the fundamental,with an accuracy at least equal to the numerically specifiedtolerance. When higher frequency components are presentin the forcing function, the frequency range for linear responsemust extend to higher frequencies, if the response is to be a truepicture of the forcing function.In the particular problem at hand, where higher harmonicswill be present in the instrument forcing function and no numericalaccuracy has been specified, a fundamental response accuracyof at least 5 per cent might reasonably be assumed. Furthermore,to avoid resonant magnification by higher frequency components,m (Fig. 7) must be kept reasonably close to unity byselection of a f of approximately 0.6. From Fig. 7, a /3 of 0.25and a f of 0.6 will fulfill the accuracy requirements for the fundamentalup to the fourth harmonic and will record within 15 percent accuracy. These harmonic components will undergo aphase shift which is linear with frequency within the frequencyrange over which the magnitude response is satisfactory (Fig. 8).This means that the first four harmonic terms of the Fourier serieswill be reasonably well recorded with respect to the magnitude,and the shift along the time scale, due to phase shift, will be thesame for all these components, thereby retaining the true waveform of the forcing function. For p = 0.25 a natural frequencyof the indicator of 800 cycles per sec is necessary. It should benoted that the use of critical damping in this case would reducethe accuracy of amplitude recording, Fig. 2, of the paper.If the desired indicator were to measure the mean pressureonly, then p must have some value in excess of unity. This issimilar to the case of a seismograph and has been covered inearlier papers.8 For an indicator reading to oscillate less than5 per cent, any value of f can be used if p is greater than 5 (naturalundamped frequency is less than 40 cycles per sec).The methods of this paper permit the critical instrument constants/3 and f to be evaluated quickly. The problem of achievingthese constants in the instrument is the responsibility of themechanical designer, but it is certain that the desired responsecannot be obtained unless the graphically obtained constants pand f are actually realized in the completed indicator.8 For example, reference (4), Fig. 5.
T herm ostatic Bim etalsB y S. G. ESKIN,1 PITTSBURGH, PA., a n d J. R. FRITZE,2 CHICAGO, ILL.T he u se o f th e r m o s ta tic b im e ta ls h a s in creased rapid lyd u rin g th e la s t fifteen y e a rs. In t h is p eriod , c o n sid e r able stu d y h a s b e e n giv en th e su b je c t. T h e p r e se n tpaper review s th e a v ailab le in fo r m a tio n d e a lin g w ith th eth eory an d p ractice in th e a p p lic a tio n o f b im e ta ls . Alack o f e sse n tia l d a ta c o n c er n in g v a rio u s p e r tin e n t p ropertieso f th e m a te r ia l is in d ic a te d . B a sic p r in c ip le s areth o r o u g h ly con sid ered , a s in th e a n a ly sis o f th e m e c h a n ics b y P ro fesso r T im o sh e n k o a n d in th e p ro p erties o fn ic k e l-ir o n a llo y s. H ow ever, a co n sid era b le fu n d o f u sefu ld a ta is a lso p r e se n ted in th e fo rm o f curves a n d ta b le sw h ich give th e p ro p erties o f r ep re se n ta tiv e b im e ta ls .IntroductionDURING the last few years, the demand for automaticmethods of control in regulating devices has expanded inproportion to the ease and comfort enjoyed by mankind.All concerned have increasingly realized the importance and convenienceof automatic regulation and the complete satisfactionwith which it may be used. Many automatic regulating devices,in which temperature can be used for controlling the regulation,depend for their successful operation on thermostatic bimetal.In general, automatic control effects considerable savings infuel cost. It also acts to safeguard the equipment on which it isused. Such equipment normally is left to operate unattendedwith full confidence that nothing is likely to happen to it.Whether in factory or home, whether to engineer or housewife,automatic control creates a peace of mind in our complex civilizationwhich cannot otherwise be obtained.Since the use of thermostatic bimetal has so greatly increasedin recent years and is so vital to much automatic regulation,considerable work has been done on its theory and application.In this paper, the authors present a review of the available informationon thermostatic bimetals which at present is scatteredthroughout numerous publications.Definition of T hermostatic BimetalThermostatic bimetal is a metallurgical product made fromtwo metals which have widely different coefficients of thermalexpansion and which have been firmly bonded at their face ofcontact. When subjected to a change in temperature, the compositematerial will change shape, which change of shape isutilized for control purposes. In addition to having widelydifferent coefficients of expansion, the components must havemechanical properties suitable to minimize hysteresis and provideadequate strength. For example, lead cannot be used as a component.The two component metals are usually of equal thicknessand joined together in a firm bond by brazing or welding.tory curiosities. Their first known application was in balancewheelcompensators, supposed to have been used as early as1775. As far back as 1858, Wilson obtained U. S. patent No.24,896 covering a thermostatic bimetal. In 1863, in France,Villarceau published an analysis of thermostatic bimetal in theAnnales de L’Observatoire Imperial de Paris. Wilson’s patentcovered a bimetal consisting of brass and steel and, since thedifference in the coefficients of expansion of the two metals wasnot very large, the movement of the bimetal was so limited thatits practical value was small. With the discovery by C. E.Guillaume in 1898-1899 of the low-expanding alloy known as“invar,” consisting of 36 per cent nickel and the remainder iron,a new impetus was given the work on bimetals.At the present time, the manufacture of bimetals is still anart rather than a science and the processes involved constituteclosely guarded secrets. In one plant thermostatic bimetals weremade by brazing two blocks of the component metals in a furnacein which a reducing atmosphere was maintained to prevent oxidationof the surfaces which were to be joined together. Sometimesblocks were used which were */2 in. thick, 4 in. wide, and 12 in.long. Prior to brazing, one of the blocks was machined on bothsurfaces to a thickness of exactly y 2 in., while the other block wasmachined only on one surface. While the blocks were beingbrazed in the furnace, they were subjected to pressure by meansof a hydraulic press to obtain a sound joint. It was very importantto keep the metal surfaces clean before brazing. Theblocks were usually kept in carbon paper, which prevented theiroxidizing.After the brazing operation, the exposed unfinished side ofone of the blocks was machined to produce a total thickness ofexactly 1 in., thereby assuring that each component was of equalthickness before reduction by rolling. The blocks were thenrolled down to the desired thickness, annealing being required ata number of stages. Special rolling mills were used for this workand those in the last stages needed to be extremely accurate tofinish the product to within very close tolerances.In general, the thickness variation of bimetals cannot exceedplus or minus 0.001 in. for thickness above 0.040 in. andplus or minus 2*/j per cent below this thickness. These closetolerances are necessary to obtain uniform performance since thethickness enters into the deflection equation.It is interesting to note that, in most cases, the final thicknessof each component is very close to */j of the total thickness,even though in some bimetals the hardness of the separate componentsdiffers materially.During the rolling processes, it is necessary to anneal the stripsa number of times which it has been found most convenient todo by heating the strips electrically in the flat condition.H istory and ManufactureThermostatic bimetals were known for many years as labora-1 Director of Research, Robertshaw Thermostat Company. Mem.A.S.M .E.2 Engineer in charge of materials, Edison General Electric ApplianceCompany, Inc.Contributed by the Com m ittee on Industrial Instrum ents andRegulators of the Process D ivision and presented at the AnnualM eeting, Philadelphia, Pa., December 4 - 8 , 1939, of T h e A m e r i c a nS o c i e t y o f M e c h a n i c a l E n g i n e e r s .N o t e : Statem ents and opinions advanced in papers are to beunderstood as individual expressions of their authors, and not thoseof the Society.Properties of I nvar and Related AlloysAs defined, thermostatic bimetals consist of two metals, havingwidely different coefficients of thermal expansion, which arejoined together at their surfaces. The effectiveness of a givenbimetal will depend upon the difference in thermal expansivityof the two components. Although numerous alloys now on themarket have varying degrees of high expansivity, there are onlya few alloys with thermal expansion sufficiently low for commercialuse in bimetals.In making a study of the iron-nickel series, Guillaume discoveredthat some of these alloys possessed low expansivity at433
434 TRANSACTIONS OF THE A.S.M.E. JULY, 1940ordinary temperatures, the composition corresponding to minimumexpansivity being in the vicinity of 36 per cent nickel. Thisalloy maintained its dimensions so nearly constant with ordinaryvariations in atmospheric temperature that he gave it the appropriatename “invar.”Since Guillaume’s work, the entire iron-nickel series has beenso explored that the engineer can now use an alloy with anydesired coefficient of linear expansion between zero and that ofnickel. With such a range of low-expansion alloys available,the development of bimetals followed as a matter of course.In Fig. 3 are reproduced curves showing the variation of thetrue coefficient of linear expansion with temperature for nickelsteels varying in composition from 33.8 per cent nickel to 64.8per cent nickel.6 The values of the coefficient of expansion areplotted against temperature. The curves show invar (35.4 percent nickel) to be the most desirable for temperatures from 100to 300 F. From this point up, the coefficient of expansion greatlyincreases, thus making such an alloy useless for bimetal applicationsat higher temperatures if uniform rates of movement aredesired over the entire range. Fig. 3 also shows that the alloyof 42 per cent nickel, although having a considerably highercoefficient of thermal expansion than some other alloys at roomtemperatures, develops only a slight increase in the coefficientwith an increase in the temperature and maintains a uniform coefficientover a rather wide range of temperature. It has beenfound that alloys of 40 and 42 per cent nickel are particularly suitablefor bimetals operating in the medium and high temperatureranges and they are used extensively for this purpose.In an attempt to explain the expansion anomaly of invar sev-F i g . 1 T r u e C o e f f i c i e n t o f L i n e a r E x p a n s i o n a t 20 C o fT y p i c a l N i c k e l - I r o n A l l o y s , C o n t a i n i n g 0.4 P e r C e n tM a n g a n e s e a n d 0.1 P e r C e n t C a r b o n ( G u i l l a u m e )In Fig. 1, the coefficient of linear expansion at room temperatureof iron-nickel alloys is plotted against nickel content ( l).3The composition corresponding to the minimum point on thecurve is that of invar. As the nickel content varies from theinvar point the expansion coefficient increases continuously butnot uniformly. Fig. 1 is representative of typical alloys containing0.4 per cent manganese and 0.1 per cent carbon whichhave been cooled in air after being hot-rolled. The point onthe left edge of the grid shows the value of the coefficient of expansionof pure iron as 11.9 X 10⁻⁶ per C, while on the rightedge is the point giving the value of pure nickel as 13 X 10-6per C. The dotted line on the curve connecting the values of thecoefficients for pure iron and pure nickel, represents the theoreticalresults obtained from the law of mixture in a condition stableat low temperatures. However, the true coefficients of the variousmixtures are far from following this law, as the curve shows.The point of low expansivity shown in Fig. 1 holds true only inan alloy in which the proportion of elements other than iron andnickel are also fixed, as has been stated. The position of theminimum is changed considerably when other elements are present .Fig. 2 shows the change in the expansivity of nickel steels producedby the addition of 1 per cent manganese or chromium.4The solid curves give the change in the expansivity due to theaddition of the foregoing elements, while the dotted curve givesthe actual expansivity of nickel steels. The effect of these additionsis to increase the expansivity of invar very considerably.All thermal or mechanical treatment given such an alloychanges its expansivity. When such an alloy has been heatedand then slowly cooled, its expansivity rises. However, its expansivityfalls if the cooling has been rapid. When such analloy is cold-rolled or drawn, its expansivity will decrease stillmore. By first quenching and then drawing a rod to thelimit, it is possible to reduce the expansivity to such an extent asto reach a negative value. Reheating at 100 C for several hoursbrings the value up to substantially zero. However in processinginvar for bimetal applications, advantage is not taken of this property,since reheating to higher temperatures will cause its expansivityto revert to the higher minimum.* Numbera in parentheses refer to the Bibliography.4 Bibliography (1), Fig. 24, p. 38.F i g . 2 E f f e c t U p o n L i n e a r E x p a n s i v i t y o f N i c k e l S t e e l sP r o d u c e d b y A d d in g 1 P e r C e n t M a n g a n e s e o r C h r o m iu m( G u i l l a u m e )F i q . 3 V a r i a t i o n o f T r u e C o e f f i c i e n t o f L i n e a r E x p a n s i o nW i t h T e m p e r a t u r e i n V a r i o u s N i c k e l S t e e l s (C h e v e n a r d )eral theories were evolved. Some of the earlier views attributedthe nonexpansion to an inner molecular change. Another theoryexpressed the view that the nonexpansibility was caused by thehigh nickel content bringing the temperature of the A3 transformationto the vicinity of room temperature, which made the5 Bibliography (1), Fig. 28, p. 44.
ESKIX, FRITZE—THERMOSTATIC BIMETALS 435transformation of 7 into a progressive. However, it was shownthat the position of Ac3 for 36 per cent nickel is about +400 C andthat of Ars about —100 C, thus making impossible an equilibriumat ordinary temperature and the invar would be in a decidedlyunstable condition.Benedicks (2) in developing a theory for the expansion of invar,reasoned that the alloy was in reality a two-phase system insteadof being homogeneous. He proved his theory by a careful microstudyof the alloy which led him to four conclusions:1 Strictly local, deep-etching spots occurred regularlythroughout the metal.2 These spots were often more concentrated at definite places,at which points considerably more iron goes into solution.3 In an unetched surface, a darker, finely divided structurecould be made visible in red light.4 The deep-etching spots of invar presented the same generalcharacteristics as those observed in a larger proportion in a 30.5per cent nickel alloy where a two-phase microstructure was alreadyknown to occur.From the foregoing evidence, Benedicks concluded that invarpossessed a duplex structure. As he was certain that invar containedtwo phases, he reasoned that, since every transformationbetween two phases requires a definite time for its completion,by heating invar quickly, sufficient time would not elapse for thetransformation between the two phases to take place. In thatevent, the initial expansion would be a normal one and thecoefficient would lie between that of iron (12 X 10-6) and thatof nickel (13 X 10~‘). However, when sufficient time is allowed,F ig . 4 E x p a n s i o n H y s t e r e s i s o f I n v a e ( B e n e d i c k s )the change caused by the two-phase transformation will becomenoticeable. In other words, since invar is a two-phase alloy, quickheating should show a thermal hysteresis, while if invar were aone-phase alloy, no thermal hysteresis would be detected.Consequently, the high-expansion coefficient should be expectedto occur at quick temperature changes if the alloy had twophases.To prove his theory, Benedicks conducted an experiment inwhich the thermal expansion of invar was measured as a functionof time. He developed special equipment whereby measurementsof expansions were made with an apparatus which amplified themovement 14,000 times, time being measured simultaneously.Fig. 4 shows the results of Benedicks’ experiments.6 As expected,the thermal hysteresis was very pronounced. For a giventemperature change (42 C), a sample of invar wire had an initialexpansion coefficient of 13 X 10_* or about the normal value foriron or nickel. The coefficient then diminished continually until,after 3 min heating, a considerable contraction had set in. Due to8 Bibliography (2), Fig. 63, p. 141.this, the resulting length diminished so much after a lapse of about11 min as to give an expansion coefficient of 0.2 X 10_* to 0.6 X10~6. This is the same magnitude established for invar by previousworkers (0.4 X 10“*).In other words, invar upon heating first expands the same averageamount as the separate constituents would expand for thesame temperature change and then, after a lapse of a few minutes,contracts to show a coefficient of expansion considerably less thanthat of the two elements.In applications of thermostatic bimetals where rapid rates ofheating or cooling are encountered, this temperature-timehysteresis of invar may affect the deflection of bimetals by an appreciableamount. The present methods of testing bimetals resultin data giving the “static” (constant-temperature-deflection)properties only. In order to detect this hysteresis effect, a“dynamic” (temperature-time-deflection) test must be used.S u m m a r y o f P r o p e r t i e s o f I n v a rInvar is a nickel steel made either in the open hearth, crucible,or electric furnace, containing about 36 per cent nickel, 0.1 percent carbon, and 0.5 per cent or less of manganese with negligiblequantities of sulphur, phosphorus, and other elements.It can be forged, rolled, turned, filed, and drawn into wire. Itis very strong and ductile and takes a high polish, giving an excellentsurface on which extremely fine lines may be ruled. It isgenerally ferromagnetic but becomes paramagnetic in thevicinity of 165 C.Some of the physical properties of invar in the hot-rolled orforged conditions are given in Table 1 (3).T A B L E 1“P H Y S IC A L P R O P E R T IE S O F IN V A RMelting point........................................ 1425 C (2600 F ) (melts sharply)D e n sity ..................................................................... 8 g per ccT ensile stren g th ....................................................65000-85000 lb per sq in.Y ield p o in t..............................................................40000-60000 lb per sq in.E la stic lim it............................................................20000-30000 lb per sq in.E lo n g a tio n ...............................................................30—45 per centR eduction in area................................................5 5 -7 0 per centScleroscope h ardness..........................................19B rinell hardness....................................................160M odulus of ela sticity in ten sio n ...................21400000 lb per sq in.T herm oelastic coefficient & (therm alcoefficient of Y oung's m od u lu s)...............500 X 1 0 -# per CE lectrical resistan ce............................................75—85 m icrohm -cmTherm al coefficient of electrical resistance........................................................................1.2 X 10 “* per CSpecifio heat betw een 2 5 -100 C ................... 0 .1 2 3 cal per g per CTherm al con d u ctivity 2 0 -1 0 0 C ...................0.025 cal per sec per cm 2 per cmth ickness per C tem peraturedifferenceLinear coefficient of expansion (annea le d )..................................................................1.7 X 10 ”• per deg C° B ib liograp h y (3).&W . G. Brom bacher (21) gives 480 X 10 -B per C, in range — 50 to 50 C.The amounts of carbon, manganese, and chromium presentappear to exercise considerable influence on the expansion.Above 200 C, the expansion of invar is nearly that of steel.M a t e r i a l s f o r H ig h - E x p a n d i n g S i d eIt has been pointed out that commercially useful bimetals mustconsist of two metals having widely different coefficients ofthermal expansion. In the previous section, the properties oflow-expansion alloys have been described in detail. Materialsfor the high-expansion side, in addition to having a high coefficientof expansion, should have good brazing or welding properties,should develop high elastic properties as a result of coldworking,and should have high heat-resisting properties.Initially, brass used in combination with invar resulted in asatisfactory bimetal for low-temperature applications up to approximately300 F. Further development led to the adoption ofmonel for high-temperature bimetals, but the deflection constantwhen using monel was rather low. To meet the requirements forhigh-temperature, high-deflection bimetals of good constancy,
436 TRANSACTIONS OF THE A.S.M.E. JULY, 1940various nickel-chrome alloys have been adopted for the highexpandingside. Representative analyses contained from 18 to27 per cent nickel and from 3 to 11 per cent chromium.Developments in high-temperature bimetals have been mainlyin connection with the high-expanding side. Most of the patentstaken out recently on bimetals of improved properties covermodifications of the high-expanding side made to obtain the desiredperformance.M e c h a n i c s o r T h e r m o s t a t ic B im e t a l sEfficient and economical design of elements of mechanismsrequires, first, the knowledge of stresses to which these elementswill be subjected under various conditions of service; and second,data giving the physical properties of materials which may beused for these elements. This is particularly the case when controllingor indicating devices are designed, employing thermostaticbimetals, since thermal and residual stresses are presentin bimetals in addition to the mechanically induced stresses.Where cost may be a primary consideration, the size of bimetalelements has to be considered, since bimetals are relatively expensivedue to the involved fabrication processes. Consequently,a knowledge of the properties of bimetals and an understandingof the stress conditions in sensitive elements made of this materialare essential to the most advantageous use thereof.The first experimental investigation known to the authors ofthe thermal properties of bimetal strips was made in the laboratoriesof the General Electric Company. The results of this investigation,published in 1920 (4), were that:(a) For strips, the deflection with change in temperature isgiven by the relationThe method of visualization (6) introduced by Rich has beenused in a modified form in Fig. 5 to show the effect of expansionstresses in the two components of an invar-brass bimetal strip onits curvature when heated from a temperature Ti to a temperatureTt. Assuming that the two separate components of the stripare of the same length at some temperature Th the lengths willincrease in both cases when the temperature is raised to TVThe invar will increase in length only slightly, while the brasswill expand considerably. Next, the lengths of the two componentsare equalized by elongating the invar strip with thetensile forces Pi, and compressing the brass strip with oppositelyapplied compression forces P2. While under the action of thesetwo sets of forces, the two separate strips are joined over theirsurfaces by either brazing or welding. The bimetal strip thusF i g . 5D ia g r a m s o f F o r c e s W h i c h P r o d u c e C h a n g e i n S h a p eo f B i m e t a l S t r i p U p o n H e a t in gThe relation given by Equation [ 1 ] is in agreement with morerecent investigations and theory.(6) The deflection is not affected by changes in width of thestrip. Later investigations showed this to be generally true ifthe width of the strip is less than 20 times its thickness. If thewidth of the strip is greater than this ratio, cross buckling maytake place, reducing the deflection of the strip.(c) The force exerted by the strip varies as the square of thetemperature difference and is not affected by changes in length, aconclusion which is erroneous. A simple analysis of the mechanicsinvolved, using the relation of Equation [1 ], requires thatthe force vary directly as the change in temperature, inversely asthe strip length, directly as the square of the thickness, anddirectly as the width.In 1925, S. Timoshenko published a complete analysis (5) ofthe mechanics of thermostatic bimetals. In this analysis, hedeveloped, in a clear and concise manner, the equations givingthe change in curvature of a bimetal strip upon a rise in temperature.The relative effects of variation in the thickness of thetwo components of the bimetal strip and the difference in thevalues of their moduli of elasticity were shown; equations beingderived for thermal stresses in heated bimetallic strips. In 1934,T. A. Rich presented a similar analysis (6), using a well-plannedgroup of diagrams for visualization of the stress conditions whichproduce a change in curvature of a bimetallic strip upon an increasein its temperature. The following analysis of the mechanicsof bimetals follows closely the analysis of Timoshenko (5).formed will be straight as long as it remains under the action ofthe forces Pi and Pi applied at the ends. Upon the removal offorces Pi and P2, the strip will assume the form of an arc of acircle due to the action of internal moments M, which, in thestraight strip, were balanced by external moments of the samemagnitude, resulting from the forces Pi and Pi.The expression for the radius of curvature of a bimetallic stripsubjected to a temperature rise of T% — rl \ deg can be obtainedfrom the condition that, at the joint of the two components of thestrip, the unit elongation is equal in each of the components.The following derivation will be carried through on the basisthat the thicknesses of the two components are not equal, whichmakes it possible to determine the effect of differences in the relativethickness of the components. The width of the strip will betaken equal to unity, since, within certain limits, the width doesnot affect the deflection. The following notation will be used:P = forceM = moment of force«i = coefficient of expansion of component having low expansioncti = coefficient of expansion of component having high expansionai = thickness of the low-expansion componentan = thickness of the high-expansion componentEi = modulus of elasticity of the low-expansion componentEi = modulus of elasticity of the high-expansion component/i = moment of inertia of the low-expansion componentIi = moment of inertia of the high-expansion componentt = total thickness of stripp = radius of curvature, due to temperature rise Ti — 7\
ESKIN, FRITZE—THERMOSTATIC BIMETALS 437m = ratio of thicknesses of low- to high-expansion componentsn = ratio of moduli of elasticity of low- to high-expansioncomponentsSince no external forces are present in a freely supportedheated bimetallic strip, all internal forces must be in equilibriumat every section of the strip. This condition makes it possible toestablish the relationsPi = P2 = P......................................[2]edges will be illustrated. Referring to Fig. 6, for the case of smalldeflectionsEliminating p from Equations [10] and [11], the deflection atthe center of a freely supported strip will beUsually the difference of the coefficients of expansion for a givenpair of metals formed into a thermostatic bimetal is determinedexperimentally and combined with the Vie factor into the deflec-The force P can now be eliminated from Equation [5] by determiningits value from the condition that unit elongation of thetwo components is equal at the joint. This results in the equalityBy substituting the value of Pi = P2 = P from Equation [6]in Equation [5], the expression for the radius of curvature is obtainedF i g . 6R e l a t io n o f R a d iu s o f C u r v a t u r e t o D e f l e c t i o n o fB i m e t a l S t r i pReplacing moments of inertia L and / 2 with their respectiveoi3 a-?3values — and —, considering unit width, and taking the ratioof thicknesses equal to m and ratio of moduli of elasticity equalto n, Equation [7] reduces to the formF i g . 7D e f l e c t i o n o f B im e t a l S t r i p M o u n t e d a s C a n t il e v e rB e a mFrom Equation [8], the effect of the variation in the thicknessof the two components of the strip may be determined. Generallythe thicknesses of the two components are the same so that m = 1.Equation [8] thus simplifies into more useful formEquation [9] shows that the ratio n of the moduli of elasticitycan vary over a rather wide range without affecting to any extentthe radius of curvature of a heated bimetallic strip. In mostbimetals, the moduli of elasticity of the two components are ofthe same order of magnitude so that the ratio n can be takenequal to unity. Equation [9] with this approximation reduces toits final formFrom Equation [10] it is possible to determine the deflectionof strips of various forms supported in a number of differentmanners. The case of a narrow strip supported on two knife-tion constant for the bimetal. The common form of the equationfor the deflection of a bimetal strip isThe deflection constant k is given in this paper for the case of anarrow strip clamped at one end and free to deflect at the otherend, as shown in Fig. 7. The force necessary to return a heatedbimetallic strip to its initial position is obtained by substitutingin Equation [13] the value for the deflection of a cantilever beamwith the force concentrated at the free end. The following relationgives the force in terms of the temperature changeThe constant c is known as the force constant and is usuallydetermined experimentally.S t r e s s e s i n T h e r m o s t a t i c B i m e t a l sBimetals free to deflect upon heating are subjected to internalstresses which at high temperatures may assume large values. If,in addition to internal stresses, bimetals are subjected to stressesdue to restraints, loads, etc., their performance may be critically
438 TRANSACTIONS OF THE A.S.M.E. JULY, 1940F i g . 8T h e r m a l S t r e s s e s i n B im e t a l S t r i paffected if these stresses exceed the elastic limit of the materialat high temperatures. Thus, it is necessary to evaluatestresses for applications involving high temperatures and loadingsor restraints. In this paper, only the analysis of internal stressesdue to heating will be presented. Stresses due to external forceswill vary, depending upon the application. A few simple cases ofcombinations of internal stresses and stresses due to externalforces have been analyzed by Timoshenko (5) and Rich (6).The strains produced in a freely supported heated bimetallicstrip are given in Equation [6] and consist of elongation due tothermal expansion, strains due to axial forces and strains due tobending. The stress at the joint will thus be given by the expressionp = P/a + Ea/2p.............................. [15]assuming equal thicknesses of the two components of the bimetallicstrip and equal moduli of elasticity. For this case the value ofthe force P from Equation [5] isSubstituting this value of the force into Equation [15] and rememberingthat 2a = t we obtain for the stressThe value of the radius of curvature p is given by Equation[10] so that the stress in terms of the difference in coefficients ofexpansion of the two components of the bimetal and the temperaturerise will beThe maximum stress will occur at the joint of the two componentsas shown in Fig. 8. The stresses at the surfaces will behalf as high as those at the joint.For a temperature rise of 300 C (540 F) the maximum stresswill have approximately the following valuestant is of importance and has to be investigated to obtain a designof maximum efficiency.The important thermal properties of a number of representativebimetals are illustrated in Fig. 9, the data for which wereobtained from catalogs. The bimetals selected for this chartcharacterize the three general groups into which a numberof commercially available bimetals may be classified, dependingupon the temperature range of application, low, medium, andhigh. The bimetals selected for this illustration are made by thethree largest manufacturers of this material in the United States:The H. A. Wilson Company, W. M. Chace Company, andGeneral Plate Company. In the upper part of the figure, deflectionand force constants are given as defined in Equations [13]and [14], The lower part of the figure shows the temperatureranges for which the deflection is directly proportional to thetemperature change and temperature ranges for which thesebimetals have a maximum useful deflection. As will be noted,the three largest manufacturers of bimetals produced materialsof practically identical thermal properties. Fig. 9 simplifies theproblem of the selection of a bimetal for any specific purpose.By extending this chart to include all the available bimetals, itshould be of value to designers of devices employing thermostaticbimetals. In addition to the bimetals selected for illustrativepurposes in Fig. 9, a large number of other bimetals is availablehaving widely different properties. Manufacturers’ litersture contains complete descriptions of these bimetals and givestheir complete properties in full detail.In order to prevent changes in calibration of devices using bimetalsupon initial heating, it is necessary to anneal the bimetalcarefully. During the rolling operation stresses are set up whichcan be relieved by a proper annealing procedure. High-temperaturethermostatic metals should be annealed by, e.g., heating at600 F for 1 hr if the material is to be used for any temperaturebelow 550 F. In cases where the bimetals are to be used above550 F, annealing should be done at a temperature 50 deg higherthan the maximum temperature encountered in service. Lowtemperaturebimetals should be annealed at 350 F.The deflection constant of bimetals changes as a result of annealing.Generally, different bimetals will show a varying degreeof change in constant due to annealing. Manufacturersprovide data on the effect of annealing on their respective products.P h y s i c a l P r o p e r t i e s o f B i m e t a l sIn many applications the actuating bimetallic element is usedT h e r m a l P r o p e r t i e s o f T h e r m o s t a t i c B i m e t a l sThe primary function of thermostatic bimetals is to produce adeflection or a rotation when heated. In many applications, suchas thermometers, the bimetal does not have to do any work, exceptthat of moving an indicating pointer, the bearings of whichmay have some friction. But there are other numerous applicationswhere the bimetal is called on to do considerable work suchas lifting parts of mechanisms or overcoming stored energy inspring or magnetic systems to obtain snap action. In the caseof those applications where the function of the bimetal is mainlyto provide an indication of the temperature change only, thedeflection constant has to be considered. On the other hand, incases where the bimetal is expected to do work, the force conF i g . 9 C o m p a r is o n o f T h e r m a l P r o p e r t i e s a n d T e m p e r a t u r eR a n g e s o f R e p r e s e n t a t i v e B im e t a l s o f D i f f e r e n t M a n u f a c t u r e r s
ESKIN, FRITZE—THERMOSTATIC BIMETALS 439in a manner similar to that of a spring; it is subjected to largedeflections or rotations. It is expected, and usually it is essential,that the element should return to its initial position upon the removalof the restraining forces. The design of bimetallic elements,where large deflections occur and permanency of calibrationis necessary, requires the knowledge of the stresses involvedand the tensile properties of the material. The authors were unableto find in the available literature on thermostatic bimetalsany data on the tensile properties of bimetals. Neither have themanufacturers of bimetals published information regarding thetensile properties of their products. In some cases, the moduliof elasticity have been determined and given in the catalogs.One of the authors, S. G. Eskin, during a study of bimetalseleven years ago, measured the tensile strength and the elasticlimit of metals available at that time. The results of thesemeasurements are given in Table 2. Bimetals available at presentprobably have higher tensile properties than those shown inTable 2. With the exception of the brass-invar type of bimetals,all other bimetals can be subjected to tensile stresses of the orderof 70,000 lb per sq in. at room temperatures. Manufacturersgenerally recommend stresses not exceeding 30,000 lb per sq in.which value allows a very wide margin of safety and makesnecessary the use of more bimetal than with a less conservativevalue. Stresses must be considerably lowered due to “creep”which occurs at high temperatures. Table 3 shows the “safeworking” stresses recommended by two manufacturers at varioustemperatures.For the calculation of forces exerted by bimetallic strips whensubjected to deflections, the moduli of elasticity must be known.The brass-invar type of bimetal has a modulus of elasticity approximately17,500,000 lb per sq in. and most of the mediumandhigh-temperature bimetals have moduli of elasticity closeto 25,000,000 lb per sq in. These values are for room temperatures;at elevated temperatures, the moduli of elasticity will belowered from 10 to 20 per cent, depending upon the metal andthe temperature rise.Hardness of bimetals varies considerably with analysis, degreeof rolling, and the heat-treatment. In general, bimetals are relativelyhard, the low-expansion side varying from 205 to 260Vickers or Brinell, while the high-expansion side of medium- andhigh-temperature metals varies from 230 to 300 Vickers orBrinell. These hardnesses are of the same order as those ofmedium-hard cold-rolled spring materials.With the exception of brass-invar and some special bimetals,most high-temperature, high-deflection constant bimetals havevery low thermal conductivity. This is due, first, to the factthat invar is a very poor conductor of heat. Fig. 107 shows thatthe lowest thermal conductivity of the nickel-iron alloys is inthe range of their lowest thermal expansion, this latter propertymaking them of particular value for bimetal applications.Second, heat-resisting chrome-nickel steels and similar alloys arealso very poor conductors of heat. Since this is the case, mosthigh-temperature bimetals are very poor conductors of heat.This should be borne in mind by designers of devices in whichthe bimetal is to be heated by conduction.M e t h o d s o f T e s tAll manufacturers and most large users of bimetals have developedmethods of test which meet their own particular requirements.While there may have been some similarity in the generaltest procedure, there usually existed enough difference tocause discrepancies in results when testing identical materials.To eliminate this difficulty, the American Society for Testing Materialsformed Subcommittee VII, under Committee B4, tostudy bimetals and set up methods of test. Their latest workmay be found in Tentative Standard B106-39T entitled “TentativeMethod of Test for Flexivity of Thermostat Metals.”A p p l i c a t i o n o f T h e r m o s t a t ic B im e t a l sSpace limitations do not allow enumeration of the very extensiveuses of thermostatic bimetals. Suffice it to state that onemanufacturer of bimetals lists in his catalog 60 general industrialapplications and 15 automotive, aviation, and marine applications.A number of articles have been written on the applicationof bimetals, showing the more common forms in which bimetalelements are used; i.e., spirals, helices, disks, flat and U-shapedstrips, and also special shapes to meet various unusual requirements.These references are listed in the Bibliography.Recently two new bimetal units have been introduced whichare shown in Figs. 11 and 12. The triple helix shown in Fig. 11was developed by the Weston Electrical Instrument Corporationand is being used extensively in dial thermometers. By thismethod of winding a very sensitive element requiring smallspace is obtained. The double-helix coil shown in Fig. 12 is aproduct of the General Plate Company. This coil is made bywinding a relatively long small diameter helix into a much shorter7 Bibliography (1) Fig. 40, p. 61.
440 TRANSACTIONS OF THE A.S.M.E. JULY, 1940F i g . 11T r i p l e H e l i x f o r D ia l T h e r m o m e t e r s M a d e b y W e s t o nE l e c t r ic a l I n s t r u m e n t C o r p o r a t io nF i g . 12 D o u b l e - H e l i x C o i l P r o d u c in g L i n e a r D e f l e c t i o nW h e n H e a t e d ; M a d e b y G e n e r a l P l a t e C o m p a n yhelix of a considerably larger diameter. Upon heating, this helixproduces a linear deflection along the main axis of the coil.A c k n o w l e d g m e n t sThe authors are indebted to W. M. Chace Company, GeneralPlate Company, and The H . A. Wilson Company, for valuable informationin regard to bimetals and their properties. They aregrateful to members of the A.S.M.E. Committee on IndustrialInstruments and Regulators for many helpful suggestions in connectionwith this paper. Their appreciation also extends to J.C. Sharp, chief engineer of the Edison General Electric ApplianceCompany for making the preparation of this paper possible.BIBLIO G R A PH Y1 “Invar and R elated Nickel Steels,” U. S. Bureau of StandardsCircular, No. 58, W ashington, D . C., 1923, Fig. 22, p. 37.2 “ M etallographic Researches,” by Carl Benedicks, McGraw-Hill Book Com pany, Inc., N ew York, N . Y ., 1926, pp. 122-150.3 “ Invar, Elinvar and Related Iron-Nickei A lloys,” by J. W.Sands, Metals and A lloys, vol. 3, 1932, pp. 131-135, 150, 159-165.4 “ Therm ostatic M etal,” by Henry Herrman, General ElectricReview, vol. 23, 1920, pp. 57-59.5 “ Analysis of Bi-M etal Therm ostats,” by S. Timoshenko,Journal of the Optical Society of America and Review of ScientificInstruments, vol. 11, 1925, pp. 233-255.6 “ Thermo-M echanics of Bim etal,” by T. A. Rich, GeneralElectric Review, vol. 37, 1934, pp. 102-105.7 “ The Bim etallic D isc Type Therm ostat,” by V. G. Vaughan,Electric Journal, vol. 21, 1924, pp. 532-534.8 “Warmeregler in Theorie und Praxis,” by W illy Aumann,Elektrotechnische Zeitschrift, vol. 48, 1927, pp. 1145-1148.9 “Bim etal: The Temperature Sentinel,” by H . E. Cobb,Electric Journal, vol. 25, 1928, 288-291.10 “Bim etall,” by WT. Rohn, Zeitschrift fiir Metallkunde, vol. 21,1929, pp. 259-264.11 “ Der Bim etallstreifen bei Erwarmung,” by Herbert Buchholz,Zeitschrift fiir Technische Physik, vol. 11, 1930, pp. 273-275,337-340.12 “Temperaturausbiegung von Bimetallstreifen beliebiger Kurvenform,”by K . Becker, Forschung und Technik, Julius Springer,Berlin, 1930, pp. 340-348.13 “Thermostatic M etal— or Bim etal, Nature and U tility,” byH. Scott, Metal Progress, vol. 22, 1932, pp. 29-33.14 “ Mechanical Design of Thermostatic Bim etal Elem ents,” byH . D . M atthews, Product Engineering, vol. 4, 1933, pp. 420-422.15 “ Bim etalle,” by Gg. Keinath, Archiv fiir Technisches Messen,vol. 5, 1936, pp. T 55-56.16 “ L ’U tilisation des Bilam es Comme Moteur Thermique,” byM. Jean Colonna-Ceccaldi, Electricity, 1936, pp. 184-187.17 “Bi-M etallic Strip and Its A pplications,” Nickel Bulletin, vol.9, 1936, pp. 209-213.18 “ Some R ecent Applications of Bimetallic Strip,” by R. E.Ansell, Nickel Bulletin, vol. 10, 1937, pp. 206-209.19 “Therm ostatic Bim etals and Therm ostats,” by Joseph Geschelin,Automotive Industries, vol. 79, 1938, pp. 78-84.20 “B i-M etals for Temperature Controls,” by Howard D . M atthews,Electrical Manufacturing, vol. 22, 1938, pp. 35-37, 64-66.21 “Temperature Coefficients of the Elastic M oduli of SpringM aterials Used in Instrum ent D esign,” by W. G. Brombacher, Reviewof Scientific Instruments, vol. 4, 1933, pp. 688-692.DiscussionJ. B. D owden.8 Fig. 11 of the paper shows a Weston triplehelixbimetal coil and a short discussion of its characteristics maybe informative. These multiple-helix coils are made with 2 to 4helices. A very stable self-supporting mechanical form is obtainedby this construction so a long length of bimetal may bewound in a small space. A bimetal strip 25 in. long can be readilywound in a cylindrical form 0.32 in. diam X 0.50 in. long withoutany one convolution touching another. The combined axialexpansion of the helices is practically canceled out since alternatehelices are wound in opposite directions. Also there is no sidethrust as in a spiral. The maximum accuracy in measuring thetemperature of a small portion of a temperature gradient issecured by the most concentrated temperature-sensitive elementas in this multiple-helix coil.With regard to the expansion of invar, Benedicks (2) showedthat invar has a two-phase structure and a hysteresis loop ofthermal expansion if one considers the changes which occur duringthe heating cycle. His final experimental proof was obtained bytaking many points rapidly on the temperature-expansion curveof an invar bar 80.05 mm (3.15 in.) long as it varied over thetemperature range 16 to 58 C. He explained that the length ofthe invar changed as the material changed from one phase to theother and this counteracted the normal temperature-expansionchange which was assumed to be that of iron or nickel, and thusproduced an extremely small net linear-expansion coefficient.Benedicks’ experiment was chosen as being most suitable fordemonstrating his theory regarding the expansion anomaly. Tobe directly applicable to the practical use of bimetals, similar testswould have to be made with a variety of heating rates anddifferently treated invar samples. It would seem from our experiencewith invar that the size and shape of the hysteresis loopare affected by the rate of heating (or cooling) and the conditionof the invar as regards its treatment and composition. We findthat bimetal coils with a small heat capacity, having one elementof invar, when suddenly changed from one well-stirred liquid bathto another differing by 50 to 90 C, will register a maximum andfinal change in 10 to 25 sec, as nearly as can be read on a practicalscale which is readable within 0.25 per cent. This would indicatethat the effect of this hysteresis is negligible in practicalapplications with good material and design.8 Thermom eter D ivision, W eston Electrical Instrum ent Corporation,Newark, N . J.
ESKIN, FRITZE—THERMOSTATIC BIMETALS 441H. D. Matthews.9 Caution should be used in connection withthe use of the word “annealing” in reference to thermal elements.Annealing is usually associated with softening the material by theuse of elevated temperatures. The words “heat-treatment” aremore commonly used rather than “annealing,” and the heat-treatingtemperature should be a value slightly above the maximumvalue to which the material would be subjected while in service.An appreciable softening of the material will occur at temperaturesabove 1000 F and, if the material is annealed in the usual senseof the word, the strength would be considerably reduced. Heattreatmentrelieves stresses which exist in the material, due to thefact that it is finished by cold-rolling. If the finished elementsare formed in any way from strip material, additional stressesare set up, which are also relieved by the heat-treatment. Anothervery important factor in connection with heat-treatment isthat the nickel steels which are used for the low expansive side ofbimetals have an expansion value the magnitude of which is determinedby the temperature history of the material. When bimetalis finished by cold-rolling, the nickel-steel components haveminimum expansion values. During the first heating of the material,the expansion value is raised, depending upon the time ofheat-treatment, as well as the exact temperature used. The increasingof the expansion coefficient of the nickel-steel side,due to heat-treatment, therefore, reduces the deflection constantof the finished bimetal element. This change in deflection constantcan amount to a value as high as 10 per cent in some bimetalsand, if an accuracy of 2 or 3 per cent is desired after beingplaced in service, it is necessary, of course, that the heat-treatmentbe given to the finished piece before determining the calibratedscale in the finished instrument. In ordinary air furnaces it requiresfrom 2 to 3 hr properly to stabilize the elements ratherthan 1 hr, as mentioned in the paper.In connection with the exact value of the deflection constant,this is affected to some extent by the relation of the thickness tothe width of the strip. A change in deflection constant may beas great as 10 per cent if the width of the strip is out of proportionto the thickness. Therefore, for strips of unusual width or thickness,it is desirable to determine from tests the actual resultingdeflection constant, as general formulas in use do not make anydefinite reference with respect to width.The use of the phraseology “low- and high-temperature bimetals”is becoming more or less obsolete. Up to about 1915,the bimetal in general use was made of brass and invar, and wasrecommended for temperatures up to 300 F. Since that time agreat advance has been made in heating elements, so that withthe growth of the electrical heating industry, higher-temperaturebimetals were necessary, resulting in the use of monel and nickel-chrome alloys for the high-expansive side. Due to our presentwide range of temperature calibrations, the words “high- andlow-temperature bimetals” are not particularly significant.In connection with the theoretical deflection of bimetal aspublished in 1863 by Villarceau, it is interesting to note that,with present manufacturing methods of direct welding of bimetals,no slippage occurs. The actual deflection of the materialagrees with the theoretical values.The authors refer to other qualities of bimetals besides deflectionas being of importance. These might be briefly enumeratedas follows: Noncorrosive bimetal; bimetals with low and highresistivity; nonmagnetic bimetals; bimetals with small and largetemperature coefficients.Through several years of field experience, the writer has foundthat the stresses recommended by bimetal manufacturers referredto in Table 3 are extremely favorable for actual use indesign work.* M inneapolis-Honeywell Regulator Com pany, M inneapolis, M inn.S. R. H ood.10 Based on Benedick’s experiments (2) withinvar, it is assumed that “where rapid rates of heating or coolingare encountered, the temperature-time hysteresis of invar mayaffect the deflection of bimetals by an appreciable amount.”With all the progress in metallurgy since Benedick’s work in1926, there is still no adequate explanation of the thermal expansionanomaly of invar. The conclusions in Benedick’s expositionare based on premises which cannot be verified by tests.In 1928, Howard Scott reported11 no detectable hysteresis andsuggested “the effect described by Benedick must therefore beattributed to temperature lag between his specimen and thetemperature-measuring device.”An example of the rapidity with which thermostatic metalwill respond to a change in temperature is best shown by the5000 amperes test given by the Underwriters’ Laboratory todomestic circuit breakers. One of the thermostatic metals for thisapplication has a high expansive component with an expansionrate slightly lower than that of invar when the latter is heated totemperatures above 500 F. Therefore, at the beginning of a rapidtemperature rise, if the initial expansion rate of the invar werehigh as stated, no deflection would result in the bimetal.However, in this device, the elapsed time between closing thecircuit and its subsequent interruption is 0.010 sec. Only0.003 to 0.004 sec is required for the deflection of the bimetal andthe remaining 0.006 to 0.007 sec is consumed by the remainderof the mechanism. Therefore, it is safer to say that there is notemperature-time hysteresis in thermostatic metals but thattheir deflection depends upon the rate at which they are heated;they respond as any other metal to radiation, conduction, andconvection.It is also stated that, if the width is greater than 20 times thethickness, the resulting cross-buckling reduces the deflection of astrip. Actually, the deflection of a cantilever, either tapered orrectangular, increases with an increase of the width of the basewhen the length and thickness are held constant. This variationdepends upon the width-length ratio, but for commercial sizesis of the order of 5 per cent.R. G. W altexbekg.12 The writer believes this to be thefirst paper dealing with the properties of thermostatic bimetalpresented before a technical society in this country, and theauthors are to be commended for this initial step. There aresome features of this paper which it appears desirable to amplifyand there are some statements which may be questioned.It should be noted that the data on the low-expanding nickelsteels reviewed in this paper deal mainly with steels which havebeen cold-worked much less than the usual thermostatic bimetal.It is surprising that anyone who has worked with thermostaticbimetal would accept without question Benedick’s conclusions(2) on the expansion hysteresis of invar. There are millions ofdevices operated by thermostatic bimetal containing 36 percent nickel steel which must respond to temperature changes infractions of a second. The statement, that invar, when subjectedto a temperature change from 16 to 58 C, expands for a few minutesat about the rate of iron or nickel, can be proved erroneous byplunging a thin strip of any of the common thermostatic bimetalsinto hot water. The bimetal will change form immediately.No time lag between change in form and change in temperaturewill be noticed.We have attempted to determine expansion hysteresis by testson thermometal composed of Armco iron against a 36 per centnickel steel. The test specimen was a loosely wound spiral made10 Chief Engineer, W . M . Chace Com pany, D etroit, M ich.11 “ Low Expansion N ickel Steels,” by Howard Scott, Trans.American Society for Steel Treating, M ay, 1928, pp. 829-847.12 The H . A. W ilson Com pany, Newark, N . J.
442 TRANSACTIONS OF THE A.S.M.E. JULY, 1940from strip 0.006 in. thick, '/s in. wide, and 12 in. long. This wouldrotate 1.12 angular deg per deg F. The spiral was held at 75 F(24 C), then immersed in oil at 200 F (93 C) and the amount ofrotation was automatically recorded at intervals of 0.1 sec. Theresults were as follows:During the first 0.1 sec, the coilTim e after R otation, rotated 22 deg and in 1 sec it hadimmersion, sec deg rotated 90 deg. These rotations0.1 22 correspond to tem perature0 .2 321 .0 90 changes of 75 to 95 F and 75 to4 .0 140 155 F with the coil in equilibriumN o further rotationat those temperatures. The temperaturechange of the bimetalcould not have been much faster so there could have been little,if any, time lag between the temperature of the 36 per cent nickelsteel and the corresponding expansion for equilibrium conditions.Certainly there was no hysteresis of the order discussed by theauthors.The properties of the components which affect the change incurvature of a bimetal may be combined into what is known as adeflection constant and a theoretical derivation of this constantK is given. The numerical value of K can be determined by temperature-deflectionobservations on a suitable specimen. Consistentresults may be obtained on a beam specimen tested in themanner proposed by the American Society for Testing Materials(A.S.T.M.) and cited by the author in the section, “Methods ofTest.” The values of K observed by this method agree closelywith the values derived from a theoretical analysis based upon theproperties of the components.A rate of deflection may also be determined by observationson the temperature rotation of spirals and helices, but the rateof rotation determined in this manner may vary 20 per cent on agiven bimetal, because the amount of rotation depends upon theform and relative dimensions of the bimetal strip, particularlythe ratio of width to thickness. The latter method of test ismentioned because some of the deflection constants shown inFig. 9 were obtained in this manner. A comparison with deflectionconstants obtained by the A.S.T.M. method leads toerroneous conclusions.This paper contains an analysis of stresses introduced by achange in temperature of a bimetal. This analysis gives changesin stress, not the actual value of the stress. The amount anddistribution of the stresses in any part depend upon its previoushistory. It is possible to distribute stresses advantageously in abimetal part by a suitable heat-treatment. Heat-treatment of afinished bimetal part is necessary if uniform and unchangingperformance is desired. In most applications the treatment describedby the authors is sufficient. In a few applications, it isnecessary to carry the assembled thermostat over the entire temperaturerange, above the maximum and below the minimumtemperature it will meet in service.Authors’ ClosureThe authors regret that due to lack of space they were unableto give a detailed description of Benedicks’ ingenious apparatusfor determining the manner in which invar expands on fast heatingand to describe more clearly and in greater detail results ofBenedicks’ experiments. Mr. Hood cited the work of HowardScott11 in which Scott was unable to check results previously obtainedby Benedicks. The authors have studied the methodused by Scott and it seems that, having been designed primarilyfor the purpose of obtaining easily and quickly a large amount ofdata, Scott's apparatus may not have been particularly suited todetermine an effect which requires extremely high magnification.Scott’s conclusion to the effect that Benedicks’ results were incorrectwas based on the premise that temperature lag existed betweenthe test specimen and the platinum rod used as a thermometer.The authors do not agree with this conclusion but, evenassuming that a temperature lag may have existed, it could nothave changed the general aspects of Benedicks’ investigation.The fact that at the start of heating the expansion of the invar rodwas of the order of the expansion of either iron or nickel indicatesthat the temperature-measuring arrangement was satisfactory.The authors were quite interested in data presented by Messrs.Hood and Waltenberg, showing that bimetals made with commercialinvar give a deflection immediately upon heating. It wasthus assumed that, since bimetals containing invar perform in amanner which does not follow from the results of Benedicks’ researches,his work was wrong. While the authors have no definitedata to explain the seemingly contradictory situation which exists,they feel that these discussers have erred in arriving at their conclusions,having approached the problem too much from the commercialpoint of view. A careful study of Benedicks’ work wouldshow the tremendous importance of the analysis of the invar rodon its hysteresis effect. Fig. 65 in Benedicks’ book (2) showsthat, while an alloy containing 36 per cent nickel will have ahysteresis effect, an alloy containing 36.9 per cent nickel will notshow it. This in itself may be indicative that commercial invarmay not have a hysteresis effect and, therefore, bimetals with itwill respond instantaneously to temperature changes, as the resultsof Messrs. Hood and Waltenberg’s tests indicate. Theauthors agree with Mr. Dowden that the entire subject requiresfurther investigation, particularly from a purely scientific pointof view.It may be pointed out that the hysteresis effect theoreticallywould initially reduce the deflection of a piece of bimetal containingpure invar when heated at a fast rate by about 10 per cent.This amount of reduction in deflection requires careful measurementsand may not be apparent when investigated by methodsdescribed by Messrs. Hood and Waltenberg.The authors are grateful to Mr. Matthews for amplifying theircomments in regard to annealing of thermostatic bimetals. Theyhave used the term “annealing” in a broader sense, as defined bythe American Society for Testing Materials (A.S.T.M.) in StandardA119-33.Mr. Hood brings out the point that a bimetal strip when used asa cantilever will show a greater deflection with increases in thewidth. While this may be true in one particular case, generally,the contrary will occur. The authors would like to refer himto an A.S.T.M. treatise,13 which gives the following formula as acorrection for cross-curvature of a freely supported strip ofthermostatic bimetal, where w is width of strip and L the distancebetween supports 1/{1 + (w /L )2).Mr. Waltenberg points out that, in Fig. 9 of the paper, the deflectionconstants of the General Plate Company’s bimetals arehigher than they should be, due to the fact that the company usedcoils rather than strips to determine deflection constants. It waspointed out in the paper that the data for this figure were takenfrom catalogs of manufacturers, assuming that the manufacturerswere familiar with methods for determining accurately the deflectionconstants of their materials. At the request of the authors,the General Plate Company rechecked the deflection constants oftheir bimetals shown in Fig. 9 using strips, and found them tocheck very closely with constants given in the figure.While it is quite possible that erroneous results may be obtained,when deflection constants of coils of certain geometry arerecalculated to obtain deflection constants for strips, it is conceivablethat a coil can be used of such a size that its deflection constantwould be quite comparable with that obtained with a strip.13 “T entative M ethod of T est for Flexivity of Therm ostatM etals,” B 106-39T , A .S.T .M . Standards, 1939, Part 1— M etals, pp.1164-1168.
The Significance of, and Suggested Lim its for,the Stress in Pipe Lines D ue to the C om bined Effects of P ressure and E xpansionBy D. B. ROSSHEIM1 and A. R. C. MARKL,2 NEW YORK, N. Y.T h is paper h a s been prepared a s a v e h icle for d isc u s sio no f th e fo llo w in g b a sic p r o b le m s, o n w h ic h a g r e e m e n t m u s tbe reach ed t o e sta b lish a sa tisfa c to r y w o r k in g -stress b a sisfor p ip e lin e s :1 P rop er allo w a b le str e sse s for c o m b in e d p ressu re an dex p a n sio n effects.2 In flu en ce o f a n d lim it s for lo ca lized str esse s u n d ers ta tic a n d rep ea ted lo a d in g .3 C a p a city o f b o lte d j o in t s t o w ith s ta n d e x p a n sio ne ffects w ith o u t lea k a g e or d a m a g e t o fla n g es, b o lts, org a sk ets.4 E ffect o f p resp rin g in g , se lf-sp r in g in g , creep , a n dy ie ld in g o n o p eratin g a n d o ff-str e a m str e sse s.A n a tte m p t h a s b een m a d e t o p o in t o u t v a rio u s a sp e c tso f each issu e , r a th er th a n lim it th e p r e se n ta tio n t o th ep ersonal view s o f th e a u th o r s.DURING the last decade, economic considerations and newprocesses in the power, oil-refinery, and chemical industrieshave produced a trend toward large-scale units and highoperating temperatures and pressures. With the attendant increasein line sizes and wall thicknesses, the subdivision of pipelines into convenient runs with expansion bends soon provedentirely inadequate; instead, today most piping for severeservice is carefully analyzed for forces and stresses, full advantagebeing taken of the inherent flexibility by minimizing the numberof anchors, guides, or other restraints. A natural consequenceof this improved accuracy in evaluating thermal effects is thenecessity for a review of stress limitations as they apply to expansionstresses alone and in combination with internal pressure.This problem has received the active consideration of SubgroupNo. 3 on Expansion and Flexibility, Subcommittee No. 8 onFabrication Details of the Code for Pressure Piping (ASA B31)who, functioning with the Applied Mechanics and Power Divisionsof the A.S.M.E., have sponsored this symposium.This paper has been prepared as a vehicle for discussion of thefollowing basic problems, on which agreement must be reached toestablish a statisfactory working-stress basis for pipe lines. Anattempt has been made to point out various aspects of eachissue, rather than limit the presentation to the personal views ofthe authors.1 Proper allowable stresses for combined pressure and expansioneffects.2 Influence of and limits for localized stresses under staticand repeated loading, such as in bends and corrugated pipe.3 Capacity of bolted joints to withstand expansion effectswithout leakage or damage to flanges, bolts, or gaskets.1 M echanical Engineer, M . W . Kellogg Co. Mem. A .S.M .E.2Assistant M echanical Engineer, M. W. Kellogg Co.Contributed by the Power Division and presented at the AnnualM eeting, Philadelphia, Pa., December 4-8, 1939, of T h e A m e r i c a nS o c i e t y o f M e c h a n i c a l E n g i n e e r s .N o t e : Statem ents and opinions advanced in papers are to be understoodas individual expressions of their authors, and not those of theSociety.4 Effect of prespringing, self-springing, creep, and yielding onoperating and off-stream stressesR esume of Simple Stresses I nvolvedA pipe line is essentially a pressure vessel, the internal pressurecausing a radial stress at the inner face which is converted intocircumferential stress on the way through the wall, leaving zeroradial stress at the outer surface; at any point the sum of theradial and hoop stresses varies inversely as the radius, while theirdifference is the same at all points. These are the laws of Lam
444 TRANSACTIONS OF THE A.S.M.E. JULY, 1940stresses will result there while the inner face will be in compression.Where conditions are not conducive to rapid heat loss, orwhere there is insulation even though of low thermal efficiency,these stresses are not of sufficient magnitude to warrant consideration.Stress Intensifications and T heir SignificanceThe Intensifications. A pipe being a simple cylinder is in itselffree of secondary effects if we neglect nonuniform thickness anddefects. However, most runs of piping contain joints, intersections,valves, and fittings, or may be fabricated into specialshapes, which introduce differences in rigidity or changes in contourwith the result that localized bending stresses must occurto preserve the continuity of the structure. It is our purpose tolist the sources of stress intensifications, and briefly discusstheir significance under static and repeated loadings.When a pipe is curved into a torus shape (pipe bend or weldingfitting), increased flexibility results under moments in the planeof the bend as a result of flattening of the cross section toward theneutral axis. The effect of this ovalization is to produce circumferentialbending stresses of a relatively high order, and also toincrease the longitudinal stress in proportion to the addedflexibility. This distortion of the cross section is resisted at theends of the bend by the straight tangents which probably tendsto reduce the out-of-round shape of the curved pipe in this areaand introduce corresponding ovalization into the straight pipefor a short distance.All intersections or outlets involve bending effects due to thetransmission of direct stress around the opening and the directionalchange at the sharp corners. In consideration of theseeffects, standard fittings are increased in thickness and branchconnections are provided with reinforcement which, while lesseningthese influences, on the other hand introduces discontinuityeffects due to the additional stiffness. The distortion producedby circumferential welds is in effect a corrugation which, withpresent-day welding technique, is probably so slight as to be oflittle or no consequence. In welds, as well as hot or cold bendsor other fabricated parts, residual stresses are encountered whichare probably reduced to an insignificant level where stress-relieved.To secure added flexibility, straight and curved pipe are sometimesprovided with circumferential corrugations which behaveanalogous to a bellows; as a result, appreciable longitudinalbending stresses are introduced while the circumferential stressesare probably reduced. Creased bends involve somewhat thesame consideration. No adequate analytical analysis has beenmade of the stresses in corrugated or creased-bend pipe althoughsome experimental research on full-size specimens has been doneat the Navy Experimental Station at Annapolis by Dennison (2)and this has been supplemented with tests on 2-in. pipe by theM. W. Kellogg Company. Details of these tests and a summaryand discussion of the Dennison and Kellogg data are givenin Appendix 1.In recent years the trend in high-pressure piping has beentoward the omission of bolted joints wherever possible. On theother hand, such connections have performed satisfactorily inoil-refinery service under extremely high pressures and temperatures,involving in some cases frequent cycles of application.Pressure discontinuity stresses occur at the back of the flange dueto the differences in stiffness, and bending stresses result from thebolt load. Due to the importance of this subject on pipe design,a detailed discussion is considered advisable and this has beenincorporated into Appendix 2 to avoid overburdening the bodyof this paper.Static Loading. It is generally conceded that, under staticloading, localized stresses do not necessarily influence the failureload of a structure. Tests on plain pipe with stiffening ringsusually result in failure in the pipe beyond the influence of thering and not in the zones of high bending stress adjacent thereto.Similarly, many tests on unreinforced openings in pressure vesselsand pipe have shown a bursting strength comparable with thatof the plate or piping material, unless the openings were largewith comparable distortion, in which case the effect is no longerlocal and failure is a function of the shape involved. Manystructures have to undergo a considerable degree of cold workingin manufacture and nevertheless give satisfactory service in theabsence of stress relieving; for instance, the A.S.M.E. PressureVessel Code permits unstress-relieved vessels up to i y 2 in.plate thickness in proportion to the diameter for U-69 construction,and in most of these vessels the plates are formed cold.With the present safety factor of 5, many stress intensificationsare countenanced such as the knuckle stress on relatively shallowdished heads and unreinforced openings of limited size. In theAPI-ASME Unfired Pressure Vessel Code, an attempt has beenmade to reduce the degree of possible stress intensification inview of the safety factor of 4, but here also these stress raisersare present although to a lesser degree.In connection with transverse stresses in curved pipe, Hovgaard(3) has made tests which show that for low-carbon steel, witha minimum yield point of 25,000 lb per sq in., appreciable permanentset would not be obtained until the longitudinal stress ascalculated with the longitudinal-stress coefficient derived by himexceeded 20,000 lb per sq in.With bolted joints, the trend at the present time is to permitan overstress in the hub in proportion to the capacity of theflange proper to take additional stress, that is, the mean of thehub and flange stress must not exceed the allowable. Flangescalculated in this manner have given satisfactory performanceon hundreds of heat exchangers. There is the additional considerationof maintaining a tight joint and this aspect is coveredin Appendix 2. It would appear that with ASA standard flangesthe bolt area is sufficient to transmit bending stress of ordinarymagnitude without lowering the gasket pressure beyond theminimum required so that the flange and bolting would not beunduly overstressed. At the same time the bolt load is able towithstand appreciable torsion by means of friction between thegasket and flange faces although to a lesser degree than appliesto bending, and caution must be exercised where high torsionalmoments are involved.In so far as static stresses are concerned, it would, accordingly,seem to be entirely proper to permit principal stresses in the linewhich closely approach the yield point and to neglect the influenceof highly localized stresses. This is particularly truewhere the distortion due to the stress intensification tends to resultin a shape of increased stiffness.Cyclic Loading. The problem of establishing suitable allowablestresses becomes more involved in the case of cyclic loading.There are some cases where load variations will definitely existsuch as in discharge lines from reciprocating pumps or compressors;more often the number of stress cycles and magnitudeof alternating stresses during operation are a matter of conjecture.There is little doubt as to the limitations that should beimposed for applications definitely involving alternating stresses.On the other hand, for average applications, the question whetherand to what extent fatigue should be considered is not readilyanswered. This is particularly true in view of the large amountof pipe which is giving satisfactory service in proportion to therelatively few fatigue failures which have been encountered.Alternating stresses may also be a source of fatigue corrosionwhich might occur as accelerated attack in corrosive media, andis sometimes present in applications where the type of material isconsidered fully resistant.
ROSSHEIM, MARKL—STRESS IN PIPE LINES DUE TO PRESSURE AND EXPANSION 445In Appendix 1 the available data on fatigue tests of differenttypes of tubular members are given and an attempt has beenmade to correlate this information to determine what relation,if any, exists between the flexibility factor and the useful life asindicated by the number of cycles to failure. It is regrettablethat the information available is exceedingly meager; on theother hand, we believe that the data indicate a definite trendbetween the resistance to fatigue and the stress intensification, ofwhich the flexibility factor is a rough measure.Subzero Temperatures. Occasional failures are sometimesencountered in subzero piping and usually occur in an area oflocalized stress which might be only a flaw or scratch in thepipe. At the present time, resistance of materials to impact iscompared on the basis of a Charpy keyhole-notch bar test, althoughattempts have been made to correlate similar informationfrom tension impact tests. In the absence of a better explanation,failures of this nature are connected entirely with thecomposition and the physical properties of the material involved,although stress may be found to be a factor when our knowledgeof this subject is further expanded.Stresses Beyond Yield Point and CreepThe stresses in a pipe wall, being the superposition of individualeffects following individual laws of distribution, are by no meansuniform over the cross section or length of the pipe. The longitudinalpressure stress is assumed constant; the radial andcircumferential pressure stresses are a function of the radius;the bending stresses due to expansion are a maximum at the extremefibers and zero at the neutral axis of the section, and varyover the length of the pipe; the discontinuity stresses at flangesand intersections, the effects of ovalization in plain bends, and thestress concentrations at corrugations follow laws peculiar tothemselves.Local yielding, where overstress occurs in restricted areas, willeffect a redistribution to adjacent fibers. When the load is removed,the fibers which have undergone permanent set will assumea negative strain, the net result being an increase in theelastic range of the structure. As an extreme condition, andneglecting increase in yield point due to strain hardening, it is possibleto visualize a line carrying a negative strain with stresses atthe yield point in the unloaded condition, and deflecting underexpansion forces and moments until an equal positive strain isproduced, with stresses again at the yield point but of oppositesign. This increase in elastic range could also be obtained byprespringing the bend to the yield point cold and then applyingdisplacements twice as great as the prespringing but of reversedsign. The difference between “self-springing” and “prespringing”structures would be that in the first case the bend has undergonepermanent deformation of certain areas which combineto shorten the distance between the ends while in the latter caseno yielding was necessary.Normally the entire elastic range (from the positive to thenegative yield point) will not be utilized, and self-sprung bendswill operate hot with a yield-point stress, with an off-stream stresssomewhat lower. The same bend with 50 per cent prespringingwill have equal stresses hot and cold, both below the yield point,or the prespringing could be up to the yield point with a low operatingstress.We next consider the effect of time and temperature on thisproblem. Prolonged loading at room temperature will result in aslightly lowered yield point, and as we go to higher temperaturesthe short- and long-time yield points decrease. This fact is thebasis of stress relief at temperatures below the critical range, theprocedure being to select a corresponding temperature and soakingtime to yield all locked-up stresses to a desired level. Thiseffect probably extends down to room temperature although thesoaking time rapidly increases below 1000 P for carbon steel.The first effect of time and temperature therefore is to lower thestress-carrying capacity to the level of the long-time yield pointat that temperature.The yielding which occurs during the period just described is so-called “first-stage creep.” Subsequently, the structure will continueto elongate under second-stage creep analogous to decreasingload or relaxation tests, the rate diminishing rapidly as theload is reduced. In time, a stress is reached which will be practicallymaintained over an extended period, which is commonlycalled the “relaxation strength.” Consequently the secondeffect of time and temperature is to reduce the stress level to therelaxation strength of the material at that temperature.With this reasoning, an unstressed bend will first assume elasticstresses proportional to the deflections; subsequently, firststageand second-stage creep will reduce the stress to the relaxationstrength, given sufficient time, so that there appears no possibilityof more than initial overstress. The strain correspondingto the overstress will reappear when the off-stream conditionobtains, so that the bend has self-sprung itself to this degree.For high-temperature piping, the self-springing therefore providesan expansion range from the desired stress cold to a relaxationstress of reversed sign. If the bend is presprung the periodof adjustment is reduced and, if the prespringing is 100 per cent,there would be no bending stress due to expansion under operation.It is evident that prespringing is beneficial and should be encouragedsince it maintains the stresses in a more favorablerange. Calculations should have for object the determination ofthe elastic range rather than the maximum stress. The averagestress level should be considered in setting the allowable range,a procedure which also recommends itself from fatigue considerations.For high-temperature piping in the creep range the offstreamstress becomes significant as relaxation occurs, so thatcalculation for stresses at room temperature is indicated, sincethe maximum high-temperature stress is regulated at the relaxa-tion-stress level for that temperature. This involves the roomtemperatureelasticity modulus.Where the thrusts and moments in operation are significant,calculations at operating temperatures are also necessary. Forthese the reduced moduli of elasticity at the line temperatureare used. In all calculations Poisson’s ratio is assumed constantsince few data are available on its variation.Methods of Combining StressesA pipe line in space is subjected to flexural and torsional stressesas well as normal stresses and shears due to expansion effects inaddition to circumferential, longitudinal, and radial stresses causedby pressure. This connotes a triaxial state of stress which mustbe correlated with the uniaxial failure stress obtained from thestandard tensile test. The three better-known criterions ofelastic failure (4) are the principal-stress theory (Rankine),the maximum-shear theory (Coulomb-Guest), and the maximum-shearstrain-energy theory (Hencky-Mises). The first,although still widely applied on account of its simplicity, has beendiscredited, while the results of the other two theories agree fairlywell among themselves and with elastic-limit tests. The Hencky-Mises theory is generally conceded to predict yielding mostclosely.Neglecting, as of little practical significance, such effects as theradial pressure stress, the circumferential bending stress (whichoccurs in curved members), the normal stresses, and shears dueto expansion, and assuming that stress-intensification factors,where applicable, have already been included in the stress components,the simple stresses which remain to be considered asacting in the extreme tensile fiber are
446 TRANSACTIONS OF THE A.S.M.E. JULY, 1940f L = longitudinal pressure stress plus extreme-fiber stressdue to bending50 — circumferential pressure stressSs — shear stress due to torsionThe resulting principal stresses can be written as51 = v. \Sl + fc + V w s ' + iSL-Scyi]............. in/. = V . {Sl +Sc- v W + Ul —So)*] I ......................[2]/, = 0In the principal-stress theory, Si is directly compared with theallowable stress / and the two lower principal stresses are disregarded.In the maximum-shear theory, the difference between the twoextreme stresses governs. If both/i and/2 are positive, the samecriterion is obtained as for the principal-stress theory. If, on theother hand /2 is negative, a different limitation applies. Accordingly,the following two conditions must be satisfiedSi = V. {Sl + S c + V W s* + Ul - S c)*] } S / ............... [3]Sl — /a = V W s’ + Ul — ScY] S / ................................[4]Finally, for the Hencky-Mises theory, the failure criterion canbe written asV ( / i 2+ /.* —/ 1/.) = \/( 3 /s 2+ / l 5+ / i 2—SiJc) £/..[5]With steady creep, the maximum-shear theory is commonlyused, although Bailey (5) has developed a formula analogous tothe Hencky-Mises equation, involving constants which are evaluatedfrom the creep properties of each material. Beforeselecting a theory, some thought should be directed at criteriaof failure. The stress theories mentioned predict yielding, notultimate failure and, with extensive yielding or creep, the elastictheory no longer controls the stress distribution. In thickcylinders under pressure the Hencky-Mises theory would nodoubt predict the yielding of the innermost fibers, but generalyielding of the cylinder is probably best predicted by the simplestress theory, and the same is true of failure.Where stresses are calculated according to the elastic theory,the principal-stress theory could be safely continued in use sinceit is in step with present-day safety factors. In fact, the Barlowor outside-radius formula of the Piping Code already penalizespiping in comparison with pressure vessels (A.S.M.E. and API-ASME Codes both use the Lam6 formula which follows Rankine’stheory for thick pressure vessels). If stresses are to be evaluatedmore closely and the safety factor reduced, then the Hencky-Mises theory should be used if yielding destroys the utility of thestructure. If some yielding is not considered detrimental, thenfurther studies and tests are desirable to correlate combined loadswith rupture.Where stresses are calculated under conditions of steady creeprather than the elastic theory, the maximum-shear theory isused by Bailey (5). Norton (6) has made creep tests on tubularspecimens which indicate similar rates where the average simplecircumferential stress and the simple tensile stress in the cylinderand test bar were the same, although with longer tests there areindications that the creep rate would decrease for the cylinders.Bailey establishes the ratio of diametral to tensile creep as 1/ 1to l/s f°r the same shear stress. Norton’s tests would indicatethat the use of the average stress from the elastic theory (Lam6—mean of outside- and inside-diameter stresses) is entirely safe fora hydrostatic loading.Suggested D esign Assumptions and Stress LimitsUp to this point, we have been concerned with the presentationand discussion of the data and reasoning affecting the problemof pipe lines under expansion, and have found the subjectto be quite complex. It is obvious that considerable simplificationmust be introduced in order to establish rules suitable forgeneral application. In the following, basic assumptions for usein evaluating stresses and limits for the combined stresses resultingfrom pressure and expansion are suggested.Evaluation oj Expansion Thrusts and Stresses. The calculationof the line for expansion serves the purpose of establishingthe range over which stresses vary rather than the maxima andminima, and accordingly consideration of the amount of prespringingrequired can be deferred to the end of the calculation.Since the relaxation stress definitely limits the hot condition,both prespringing and self-springing will tend to make the roomtemperaturecondition the controlling one and calculations accordinglyshould be based on the elasticity modulus at room temperaturerather than the reduced value in operation. Where aclose estimate of thrusts in operation is desired, a simple conversionby the ratio of the hot to the cold elasticity moduli willgive the required results.Simple Stresses to Be Considered. In arriving at the principalstresses, consideration should be given in all problems to thefollowing stresses at the outside surface of the pipe:Simple pressure stresses:CircumferentialLongitudinalLine expansion stresses:Longitudinal bending (two planes)TorsionLocal stresses:Longitudinal bending in curved pipe and creased ellsLongitudinal bending in corrugated pipe.The radial pressure stress is zero at the outer surface. Directstress due to the axial force and shearing stresses caused by transverseforces need be calculated only where the piping is extremelystiff. The local stresses are evaluated conveniently by usingstress-intensification factors which are discussed later. We believethat the circumferential bending stress (curved pipe) andother local stress raisers, such as branch connections, may beneglected, although the use of unreinforced openings and reinforcementdetails should be more closely controlled where serviceconditions involve distinctly cyclic loading. Bolted jointswill be commented on as a separate item.Stress-Intensijication Factors—Fatigue. In addition to theordinary usage of the term “stress-intensification factor,” it willhere also be applied as a correction factor reducing the elasticrange of stresses where cyclic loading is involved. The valuesgiven in Table 1 are suggested as a working basis.T A B L E 1 S U G G E S T E D S T R E S S -IN T E N S IF IC A T IO N F A C T O R SStress-intensificationfactorN oncyclic C yclicShape stresses stressesP lain ta n g en ts......................................... 1 1Plain bends and creased bends. . . . 0 kCorrugated tan gen ts and b e n d s ... 2 l/t 5Cyclic stresses would be considered to obtain where serviceconditions involve pulsating loads or frequent temperaturechanges; a closer definition should be considered, although itcannot be expected to relieve the designer entirely from a considerationof the merits of each case.The factors for plain tangents require no comment. In thecase of plain bends, k and /3 are the familiar Kfen&n or flexibilityfactor and Hovgaard’s longitudinal stress-intensification factor,respectively. Both are applied to flexure stresses in the planeof the bend only. Creased bends are realized to occupy an inter
ROSSHEIM, MARKL—STRESS IN PIPE LINES DUE TO PRESSURE AND EXPANSION 447mediate position between plain and corrugated pipe, but areusually classed with the former in the absence of reliable data.For straight and curved corrugated pipe, stress calculations arebased on the moment of inertia of the pipe before corrugating,and the stress-intensification factor is applied to the longitudinalpressure stresses and the bending stresses. It is realized that themoment transverse to the plane of a bend can vary from purebending to pure torsion with an intermediate range where botheffects are present, and that the true state of stress is not evaluatedby present methods; however, this and kindred problems can beconsidered as future refinements as our knowledge of this subjectexpands.For noncyclic stresses, we have used the endurance propertiesof 20,000 cycles as a rough guide; for cyclic loading, 500,000 stressreversals have been considered as fairly representative of theendurance limit.Combination of Stresses. If failure is associated with yielding,the Hencky-Mises theory most accurately predicts the elasticlimit under combined stresses, although the maximum-sheartheory offers sufficiently close results and is somewhat easier toapply. On the other hand, present-day safety factors for pressurestress are predicated on the principal stresses (Rankinetheory) and, since local yielding results in stress redistributionwith no loss in utility, average stresses are probably the bestover-all strength index. For the present, we would favor thecontinued use of the principal-stress theory for calculations basedon the elastic theory. Where stresses under steady creep (5) arebeing considered, the maximum-shear theory may be used.Suggested Stress Limits. Using as a basis the allowable stressestablished in the codes for calculating pipe wall thickness underpressure, the following limits for the available stress range (alreadydiscussed as a suitable criterion for stress-deflection comparison)are suggested:For no prespringAllowable stress range = 0.75 (S A -(- S A ) .............. [6]and for 50 per cent prespringAllowable stress range = /SA + S A' .......................... [7]where S A = allowable stress at room temperature and S A' =allowable stress at operating temperature, both to be introducedwith their algebraic values so that they will always be numericallyadditive.As an illustration, the allowable ranges obtained for combinedpressure and expansion stresses in accordance with formulas[6] and [7] are listed in Table 2 for various line temperatures, asbased on allowable pressure stresses for seamless low-carbon steelpiping (48,000 lb per sq in. minimum ultimate tensile strength)to A.S.T.M. Specification A-106 as proposed for the ASA Codefor Pressure Piping.T A B LE 2 ALLOW ABLE RA N G ES FO R C O M B IN E D P R E S S U R EA ND E X P A N S IO N ST R E SSE S AS O B T A IN E D W IT H FO RM U LA S[6] A N D [7]Line tem perature, F/---- -— —------ Allowable stress range^-;---------- -------Oil-piping section Power-piping sectionNo pre 50% pre No pre 50% prespringspring spring springUp to 650 18000 24000 14400 19200700 17663 23550 14100 18840750 17175 22900 13740 18300800 16500 22000 13200 17600850 15413 20550 12330 16440900 14250 19000 11400 15200950 12563 16750 10050 134001000 10875 14500 8700 11600For any intermediate degree of prespring, the relationAllowable stress range = (0.75 + s/2) (S A + S A') .... [8]could be used, where s = percentage of prespring expressed as afraction = 0.50 maximum.A higher degree of prespring than 50 per cent is beneficial atelevated temperatures in establishing the piping nearer equilibrium,thus reducing the amount of permanent set necessary tobring stresses to the relaxation limit. However, this will notaffect long-time conditions, and is therefore not considered towarrant an increase in the elastic range.Investigation of Bolted Flanged Joints. The rules suggestedin the preceding apply to pipe and do not consider joints. Theseare properly investigated after the completion of the line calculations.We have already indicated that ASA standard flangesare probably sufficiently strong to take any bending stressesordinarily encountered and, at least with ring-type gaskets,possess a fair resistance to torsion. In doubtful cases, and wherespecial flanges are used, an investigation analogous to that carriedout for two flanges in Appendix 2 will be indicated. TheASA flanges should probably be explored more thoroughly, anddefinite limits imposed on the allowable bending and torsionmoments depending on the type of gasket used.A ppendix 1T E ST S OF P L A IN , C O R R U G A T E D , A N D C R E A S E D -B E N DP IP E U N D E R CYCLIC V A R IA T IO N OF STRESSFew, if any, pipes break in service due to the application of asteady load or but a few repetitions. Since the common pipematerials are quite ductile, under steady stress a small amount ofyielding ordinarily will relieve highly localized overstress andeffect a redistribution without hazard of failure, provided theaverage stress does not already exceed the yield point. Where,on the other hand, repeated stress variations are incurred due totemperature or pressure changes, or vibration, an entirely differentsituation arises. The application of a large number ofstress cycles of sufficient amplitude will cause fatigue failure,which is accelerated by flaws in the material or surface irregularities.The fatigue properties of a metal are characterized by theendurance limit which is the stress below which no fracture willoccur even after an indefinite number of stress reversals, and isusually derived from cyclic flexure tests in which the extremefibers are alternately subjected to maximum tensile and compressivestresses of equal magnitude. It has been found that theratio of endurance limit to ultimate strength, or so-called enduranceratio, ranges between 40 and 50 per cent. Where stressesare not completely reversed, but vary about a definite mean, thelimiting stress is raised. For a variation from zero to a maximum,an approximately 50 per cent higher limit is found comparing tobetween 60 and 75 per cent of the ultimate strength. A generalformula covering any arbitrary stress range has been suggestedby Moore and Kommers (7), asc _ 3Slmax 2 ± O S U /S U J............................ 11where S L is the endurance limit for complete reversal, and thesign of the ratio of minimum to maximum stress is negative whereboth stresses act in the same sense, and positive where one istension and the other compression. In the absence of corrosion,cycle frequency appears to have no influence on fatigue-resistingproperties, the number of cycles alone controlling.T ests of Corrugated and Creased-Bend Piping btD ennison (2)Realizing the advantages offered by corrugated and creasedbendpiping, particularly in confined spaces, and at the same timenoting the lack of concise information on the characteristics ofsuch piping, the Bureau of Engineering of the Navy Department
448 TRANSACTIONS OF THE A.S.M.E. JULY, 1940authorized large-scale flexibility and fatigue tests on which Dennison(2) reports. The information contained in this valuablepaper is summarized briefly below.Standard commercial products were used, the specimens includingtangents, square and offset quarter bends, and expansionU-bends of 6-in. standard-pipe-size seamless tubing of carbonsteel to A.S.T.M. Specification A106-33T, with different heattreatments.The ultimate tensile strength of the various piecesranged from 51,500 to 72,600 lb per sq in.; the yield point, from33,400 to 46,000 lb per sq in.; the elongation in 2 in. from 25.5to 48.0 per cent; and the reduction in area from 33.5 to 75.1 percent.The corrugations showed a 2 y 2-in. pitch and 3/
ROSSHEIM, MARKL—STRESS IN PIPE LINES DUE TO PRESSURE AND EXPANSION 449Fi
450 TRANSACTIONS OF THE A.S.M.E. JULY, 1940F ig . 6S t r e s s C y c l e s o f M . W . K e l l o g g C o m p a n y ’s M o d e l sF i g . 7F a i l e d S p e c i m e n s , P a r t s o f T e s t i n g A p p a r a t u s , a n d C o r r u g a t e d T a n g e n t s C u t t o I l l u s t r a t e t h e S h a p e o f t h eC o r r u g a t io n sseries; the arrow attached to the point furthermost to the right denotesa test which was discontinued without failure. Since theresults for the corrugated tangents and bends were in close accord,a single curve, marked D, was drawn for both series. It shouldbe noted that there is quite a reduction in endurance for the plaintangents (curve F) as compared with the metal itself. (Since theultimate strength of the pipe material in the present tests isclose to that obtained for the material in Dennison’s tests, it isassumed that curve O can serve as a parameter for both investigations.)A further reduction in fatigue properties is found for theplain arcs (curve E) despite the reduced theoretical stress.A short note may be in order on the type of cyclic variation ofthe stresses applied. While the stress curve for each point on thecircumference of the tangents follows a sine wave, this is nottrue for the offset quarter bends shown in Fig. 6. The curves ofboth flexural and torsional stress are given at three points on thecircumference for the location of maximum stress near the fixedend; point A is on the inside of the bend in the plane of its centerline, and points B and C, respectively, are 45 and 90 deg distanttherefrom. Only point A and a point diametrically opposite aresubjected to stress reversal of the maximum amplitude. Despitethis fact, and the added complication of a cyclic torsional stress,the corrugated arcs behaved similarly to the tangents, and theconclusion, also implied in Dennison’s presentation (2), can bedrawn that the highest stressed point controls failure providedaverage conditions are not too dissimilar.Examination of the failed specimens of corrugated pipe confirmsthe observations of Dennison (2). In the case of plainpipe it was natural to expect a more jagged break since there isno sharp concentration of stresses; here surface markings andweak ligaments dictate the path of least resistance. Fig. 7 showsall the failed specimens assembled, with corrugated bends andtangents at the left, and plain bends and tangents at the right;in the center, the roller bearing, reducing collar, and various partsof the clamping devices are shown, together with the two halvesof a corrugated tangent cut through longitudinally to illustratethe shape of the corrugations.D i g e s t o p R e s u l t s o f F a t i g u e T e s t sIn order to review the results of both the Navy (2) and theKellogg tests for the purpose of formulating rules suitable forgeneral application to the practical problem of pipe-line design,
ROSSHEIM, MARKL—STRESS IN PIPE LINES DUE TO PRESSURE AND EXPANSION 451all the pertinent information on each separate series has beenassembled in Table 3. The listing follows the order of increasingflexibility of the significant part of each bend model. Limitingstresses have been read from the original fatigue curves for 20,000,100,000, 500,000, and 2,500,000 cycles and these are correlated tothe ultimate tensile strength in column 7. In column 8, thelimiting stresses obtained for the pipe for each number of cyclesare compared with the corresponding stresses for the standardfatigue-test bar. In column 9, the limiting stresses for the plainbends, creased bends, and corrugated tangents and corrugatedbends are correlated with those applying to the plain pipe tangents.A relationship can be established between the flexibility factorand the endurance of the material, which appears to be independentof the source of increased flexibility (whether flatteningof the cross section, as in the case of plain bends, or partial orcomplete corrugation, as in the case of creased or corrugatedflexibility at 20,000 and 500,000 cycles, respectively; and St20and S i600 are the “virtual” endurance limits for pipe of a flexibilityfactor k at 20,000 and 500,000 cycles, respectively. Values computedin accordance with formulas [10] and [11] are compared inTable 4 with those obtained by test.If the exponents of k were changed to 0.65 and 1.04, respectively,for the 20,000- and 500,000-cycle stresses, the differencewould be reduced considerably. However, formulas [10] and[11] should be viewed as rough guides in the interpretation andextrapolation of these tests only, and additional refinement appearsunwarranted in view of the meager basis on which they arefounded.In the tests, the endurance of the plain tangents was betweentwo thirds and three quarters that of the test bar and, by introducinga factor approximately 0.7, an estimate of the virtualendurance limit for pipe of any flexibility can be derived from thefatigue characteristics of the material.A ppendix 2T H E PR O BLEM OF B O L T E D F L A N G E DC O N N E C T IO N Spipe). This will be illustrated by reference to the 20,000-cycleand 500,000-cycle stresses, for which the following formulas permita reasonably close estimate of the limiting stresses for pipeof varying flexibility. For 20,000 cycleswhere k is the flexibility factor of the pipe; S%a and
4 5 2 TRANSACTIONS OF THE A.S.M.E. JULY, 1940approaches to flange design published by Waters, Wesstrom,Rossheim, and Williams (9), as well as Bailey’s (10) contributionto our understanding of the behavior of flanges under conditionsof creep, and the many individual investigations made in recentyears here and abroad with reference to the performance of gaskets.The complexity of the problem involved will be apparent froma consideration of the variables. In general, the shape of aflange does not readily lend itself to accurate mathematicalanalysis, particularly since the method of its attachment to thepipe, by welding, rolling, screwing, or otherwise, affects the stressdistribution. The effects of bolt holes and the gasket groove aredifficult to include. Serious uncertainties are introduced by thenecessity of making assumptions for the locations of the bolt andgasket reactions which depend on the stiffness of the flange.While a formidable number of test results are available on a widevariety of gasket shapes and materials, no entirely satisfactorycorrelation of the data has yet been presented and opinions regardingthe gasket contact pressures required to seal a joint undervarying conditions show considerable divergence. The share ofthe elastic deformation of the compound system assumed by thebolting depends on the material, size, length, and spacing of thebolts, on the development of the shank and type of thread used,on the material and height of the nut and, to a small extent,even on the compressibility of the washer. Allowable designstresses have to consider the yield strength as well as the fatigueproperties and are affected by the manufacture and heat-treatmentof the steel.Conditions are further aggravated in the case of hot lineswhere the problems of creep and relaxation make it extremelydifficult, if at all possible, to develop an accurate analysis of thebehavior of a bolted joint. In addition, the different expansionsof the component parts must receive consideration and this, inturn, presupposes at least an approximate knowledge of thetemperatures assumed by the flange, bolting, and gasket in operationand during starting up and shutting down. The questionarises whether flanges should be insulated. If lagging is provided,the metal temperatures can be maintained more nearlyuniform and sudden failure due to change in operating or atmosphericconditions or thermal shock is less likely to occur; on theother hand, the life of an uninsulated connection will probably begreater due to the reduced temperatures.In view of the multiplicity of considerations entering into thedesign of an ordinary bolted flanged connection it is comfortingto be able to state that, in general, a few relatively simple rulessupported by experience and good judgment will enable a designerto proportion the parts in such a way that the joint will performsatisfactorily in operation, at any rate under conditions whichdo not involve excessive temperatures or rapid fluctuations.Both the A.S.M.E. Code and the API-ASME Code for UnfiredPressure Vessels have adopted the flange formulas developedby Waters and Taylor. An extension of the method toinclude shear and to cover tapered hubs has been published recently(9); this new derivation also permits the evaluation of theeffects of internal pressure by a secondary investigation whilethe earlier analysis restricted itself entirely to the bolt moment.While the present paper is not concerned with flange designproper, a brief exposition of certain phases will be necessary inorder to show how the effects of expansion of a pipe line on thebolted flanged connection can be taken into account.The following forms of loading must be considered in the designof bolting for a flange:1 The internal pressure load, which is usually taken over thecircular area bounded by the center line of the gasket.2 The minimum load required to set the gasket in the coldcondition. It has been found that, up to certain pressures, theforce required to maintain a tight seal is independent of theinternal fluid or gas pressure; this limit varies for differentmaterials and shapes of gasket and also depends on the flangefacing. The minimum contact load can be interpreted as theload required to establish line contact around the circumferencefor the harder gaskets; for the softer packings, it probably signalsa sufficiently intimate contact over a larger area so that the gapbetween the gasket and flange faces is reduced to such minutedimensions that crossflow cannot occur.3 The minimum load required to maintain the joint tightunder operating pressures exceeding the limit mentioned in 2.For such pressures the required gasket force appears to be adirect function of the internal pressure. The value of the gasketcontactratio is dependent on the type of gasket and facing.4 A sufficient additional compressive load to allow for thereduction in gasket pressure caused at the joint by direct tensilestresses and tensile bending stresses due to thermal expansion ofthe line, the fundamental idea being that this pressure under nocircumstances can be allowed to drop below the minimum requiredto preserve a tight joint.5 A sufficient total load to prevent rotation in the joints dueto torsional stresses induced by the line expansion. These aretaken in friction which is a direct function of the bolt load.6 An adequate initial load to compensate for yielding of anypart of the assembly due to suddenly applied pressure or temperatureloads.7 For service at elevated temperatures a design load whichdoes not stress the component parts beyond their relaxationstrength, so that the required gasket compression will be maintainedfor the desired period.While the conservation of a sufficiently high gasket load underall conditions of operation is the primary concern in the design ofthe bolting, care should be taken to proportion the gasket so thatoverpulling of the bolts or the application of expansion thrusts orcompressive bending stresses will not lead to its failure by crushing.Furthermore, the effect of internal pressure on the gasket inproducing excessive hoop stresses and the danger of blowoutsmust be considered. The flanges of course, must be able towithstand the maximum bolt moment exerted, and, while ordinaryallowable stresses need not apply, the proportions must be suchas to prevent excessive distortion.Disregarding the effects of line expansion, cold design stressesbetween 20,000 and 25,000 lb per sq in. have been used ratherwidely in this country for alloy-steel bolting; these are stressesmaintained in operation, although the initial stresses required toset the gasket are very often much higher. For elevated temperatureswhere creep controls, stresses producing 1 per centstrain in 100,000 hours are applied; as determined by investigatorsin this country, such stresses will remain below the relaxationstrength. In England, Bailey (10) from a test on carbonmolybdenumsteel arrives at the conclusion that the relaxationlimit for 100,000 hours corresponds to the stress causing 0.1 percent creep in that period (11). For the flanges, the applicablecode stresses are used except that it is not uncommon to allow a50 per cent higher limit for the hub stresses which are of a highlylocal nature and easily relieved.With the introduction of a more accurate analysis of a stressproblem, it is common practice to reconsider safety factors. Inthe past, flanges have withstood stresses in excess of those calculatedconsidering the bolt load required for tightness only, andaccordingly a precedent is established for permitting higher designstresses where the effects of line expansion are included.Before we suggest any new stress limits, it will be in order toform an estimate of the magnitude of the hitherto uncalculatedexpansion stresses in a bolted flanged connection.A review of a large number of stress calculations involving
ROSSHEIM, MARKL—STRESS IN PIPE LINES DUE TO PRESSURE AND EXPANSION 453T A B L E 5 R E SU L T S O F IN V E S T IG A T IO N O N TW O A SA W E L D IN GN E C K F L A N G E S W IT H S T A N D A R D R IN G JO IN T S FO R T H E C O N D IT IO N W H E R E T H E B E N D I N G M O M E N T D U E TO E X P A N S IO NIS H IG H E N O U G H TO P R O D U C E A S T R E S S O F 15000 L B P E R SQ IN .I N T H E A D J O IN IN G P IP IN GPipe data:1 Line size, in .............................................................................. 4 242 Flange series, lb ..................................................................... 300 15003 Pipe sch ed ule.......................................................................... 40 1604 B ending m om ent producing a stress of 15000 lbper sq in . in th e pipe, in -lb .......................................... 48200 11730000Lim its for u nit gasket com pression based on gross w idthof ring:5 M inim um pressure required to set th e gasket w ithno internal pressure (V s ring w idth X 18000jb per sq in . yield p o in t), lb per sq in ........................ 2250 22506 M inim um pressure required to m ain tain tightn essunder operation (l/* ring w idth X 5.5 Xinternal pressure), lb per sq in .. . . ; ........................ 413 20637 M axim um pressure to prevent crushing gasket, lbper sq in ................................................................................ 30000 30000B olt stresses for various conditions:8 M inim um stress required to set gasket w ith nointernal pressure, lb per sq in .................................... 7500 19009 M inim um stress to h old internal pressure plusgasket pressure under operation, lb per sq in ........ 4750 795010 Stress required to w ith stan d m om ent causing astress of 15000 lb per sq in . in th e pipe, lb persq in ........................................................................................ 10100 860011 M inim um stress required for tightness (item 8 or9, w hichever is higher), lb per sq in ....................... 7500 795012 M inim um stress required for tigh tn ess and bending m om ent (item 10 + item 11), lb per sq i n . . . 17600 1655013 Probable lim it to w hich b o lt m ay be p ulled w ithoutcontrol, lb per sq in ................................................ 31800 20000F lange stresses for various conditions:For m inim um bolt load required for tightness (item 11):14 L ongitudinal hub stress, lb per sq in .......................... 3300 530015 R adial flange stress, lb per sq in .................................... 3700 650016 T angential flange stress, lb per sq in ........................... 2800 6200For m inim um bolt load for tightness and bending moment(item 12):17 L ongitudinal hub stress, lb per sq in ........................ i 6900 1000018 R adial flange stress, lb per sq in ................................... ...... 7900 1220019 T angential flange stress, lb per sq in ................................ 5900 11700For condition where bolts are pulled u p to lim it (item 13):20 Longitudinal hub stress, lb per sq in ...............................12000 1180021 R adial flange stress, lb per sq in ................................... .....13600 1440022 T angential flange stress, lb per sq in ................................10300 13900M axim um gasket com pression on gross w idth:23 For m inim um b olt load required for tigh tn ess(item 11), lb per sq in ...... ....................................... 2250 950024 For m inim um b olt load for tigh tn ess and bendingm om ent (item 12), lb per sq in ............... ................ 5300 1975025 For condition where b olts are pulled up to lim it(item 13), lb per sq in ...................................................... 9550 23800pipe lines connecting to pumps gave the following averages forthe end reactions:Vertical thrust plus weight of pump riserincluding valves and fittings, lb = 3 .2 5 D 3Lateral thrust in any direction, lb = 1.50 D 3Bending or torsional moment, in-lb = 60 D 3where D equals the outside pipe diameter increased by 3 in.The corresponding bending or torsional stresses in the pipe dueto expansion ranged from 1000 to 6000 lb per sq in. It has beenour practice to limit the total stresses in pipe lines to 1.5 times theallowable code stresses, one third of which is absorbed by thelongitudinal pressure stress; accordingly, some carbon-steelinstallations below 750 F based on the API-ASME Code withmaterial of 60,000 lb per sq in. ultimate strength must have,supported up to 15,000 lb per sq in. bending stress due to expansion.Since the ends of a line usually are locations of maximumstress and normally will be flanged for attachment to a nozzleprovided on the vessel, there will probably always be one or twoflanges which are subject to the maximum moment.In order to appraise conditions at a joint under such circumstances,two ASA welding neck flanges with standard ring jointswill be investigated for the conditions where the bending momentdue to expansion is high enough to produce 15,000 pounds persquare inch stress in the adjoining piping; the data are given inTable 5. It will be noted by referring to Tables 6 and 7 that theexamples selected are fairly representative of the range of conditionsmet with in ASA flanges.T A B L E 6P IP E D A T AP ipe N om inal Area, Sectionschedule size, in. s q in . m odulus, in.*40 4 3 .1 7 3. 218 8 .4 0 16. 8112 15 .7 4 47. 0916 2 4 .3 5 91. 4920 3 6 .1 5 170. 4024 5 0 .3 0 285. 1080 4 4 .4 1 4. 278 1 2 .7 6 2 4 .5 112 2 6 .0 4 74. 5316 4 0 .1 4 144. 5020 6 1 .4 4 277. 2024 8 7 .1 7 467. 90160 4 6 .6 2 5. 908 2 1 .9 7 38. 4712 4 7 .1 4 122. 5016 7 0 .8 5 233. 5020 109.92 453. 5024 157.51 780. 60T A B L E 7F L A N G E D A T ABolts®---------- » -—R ing gasket*—»F lange N om inal R oot Section Gross Sectionseries, size, area, m odulus, area, m odulus,lb in . sq in. in .8 sq in. in.3150 4 1 .6 1 6 3 .0 3 5 .7 7 8 .4 58 2 .4 1 6 7 .1 0 9 .5 7 2 3 .3 312! 5 .0 2 8 2 1 .3 7 14.73 5 5 .2 416 8 .8 1 6 4 6 .8 4 1 7 .5 5 78.4 320i 14.560 9 1 .0 0 2 1 .6 0 118.8024 18.580 137.00 2 6 .0 2 1 7 2 .3 8300 4 2 .4 1 6 4 .7 6 8 .0 7 11.8 781 5 .0 2 8 1 6 .3 4 1 4 .6 0 3 8 ,7 812 11.6 5 0 5 1 .6 9 2 0 .6 2 7 7 .3 316 18.5 8 0 104.51 2 5 .4 3 117.61 :20 2 2 .3 0 0 150.5 0 3 6 .1 3 2 0 7 .7 524 3 3 .7 2 0 2 6 9 .8 0 5 3 .5 1 3 6 4 .5 4400 4 3 .3 5 0 6 .6 0 8 .0 7 11.8 78 6 .6 1 0 2 1 .4 9 1 4 .6 0 3 8 .7 812 14.860 6 5 .9 4 2 0 .6 2 7 7 .3 316 2 3 .1 0 0 129.94 2 5 .4 3 117.6120 3 3 .7 2 0 227.61 3 6 .1 3 2 0 7 .7 524 4 7 .5 2 0 3 8 0 .1 6 53.5 1 3 6 4 .5 4600 4 3 .3 5 0 7 .1 2 8 .0 7 11.8 78 8 .7 3 6 3 0 .0 3 1 4 .6 0 3 8 .7 812 1 8 .5 8 0 8 9 .4 2 2 0 .6 2 7 7 .3 316 2 8 .1 0 0 166.84 2 5 .4 3 117.6120 4 0 .3 2 0 2 8 7 .2 8 3 6 .1 3 2 0 7 .7 524 5 5 .3 0 0 4 5 6 .2 3 53.5 1 3 6 4 .5 4900 4 5 .8 2 0 13 .4 6 8 .0 7 11 .8 78 13.860 53 .7 1 14.6 0 3 8 .7 812 2 3 .1 0 0 121.27 2 0 .6 2 77 .3 116 3 3 .6 0 0 2 0 3 .7 0 3 6 .3 2 16 7 .9 820 5 3 .0 4 0 3 9 1 .1 7 5 4 .1 9 3 1 1 .5 924 85.8 4 0 7 6 1 .8 3 8 5 .6 1 5 8 3 .2 21500 4 7 .4 3 0 17.6 5 8 .7 6 1 3 .9 68 2 0 .1 6 0 7 8 .1 2 2 0 .8 6 5 5 .4 112 4 3 .4 3 0 2 4 4 .2 9 4 1 .2 3 154.6116 6 8 .6 7 0 4 7 6 .4 0 6 5 .3 8 3 0 2 .3 820 1 0 1 .1 8 828.41 9 0 .3 2 5 1 9 .3 424 140.000 1365.00 117.71 8 0 1 .9 04000c 4 7 .4 3 0 17 .6 5 11 .4 9 1 4 .0 08 2 3 .7 6 0 9 4 .3 0 2 8 .2 7 5 6 .5 412 5 1 .5 0 0 2 9 1 .3 0 4 8 .6 0 136.69° R oot areas of b olts are com puted for V -threads w ith 8 threads per inch,m inim um . In calcu latin g th e section m odulus of th e b oltin g, it has beenconsidered perm issible to assum e th e b olt area uniform ly distributed over theb olt circle.b T h e approxim ate form ulas A = 2icrw and SM = irrh o h ave been usedin calcu latin g th e ring-gasket areas and section m oduli, respectively, wherer = radius of th e pitch circle and w = gross w idth of th e ring.c Proposed.T A B L E 8 IN V E S T IG A T IO N O F A SA F L A N G E S (T A B L E 5) E X T E N D E D TO C O V E R T O R S IO N E Q U A L I N M A G N IT U D E TO T H EB E N D I N G M O M E N T S IN V E S T IG A T E D 0Line size, in ..................................................................................... 4 24Flange series, lb ............................................................................ 300 1500P ipe sch ed u le................................................................................. 40 160Torsion m om ent, in -lb ............................................................... 48200 11730000V ertical thrust required P = M / ( f X gasket radius), lb 82500 4290000C orresponding b olt stress = ( P /b o lt area), lb per sq in . 34000 30600R equired m inim um gasket com pression = P /g a sk e tarea, lb per sq in ..................................................................... 10200 36500° A friction faotor of / = 0.20 is assum ed.This investigation would tend to show that the ASA flanges,at least where used with ring joints, have a sufficient margin ofstrength in all parts to take considerable bending moments withoutdanger of overstress. In both examples, the check againstoverpulling of bolts, to which the authors subject each flange asa routine precaution, gives higher values than the computationincluding an unusually high bending moment. It is a well-
454 TRANSACTIONS OF THE A.S.M.E. JULY, 1940known fact that ASA flanges are overbolted in order to allow forhigh gasket contact ratios required on some forms of gaskets.This is no longer true of the proposed 4000-lb standard, which isintended for ring joints only or alternate gaskets requiring a lowsealing force. The 4-in. 4000-lb size actually has the same boltingas the 4-in. 1500-lb size, and correspondingly the margin forbending stresses is considerably reduced; also, the gross ring areais by no means in proportion to the rating, and accordingly cautionmust be exercised in the use of such flanges where linestresses are high.Where torsion moments are applied to a joint and no mechanicalmeans for absorbing them are provided, these must betransmitted through friction between the gasket and the flangefaces. Our study of representative ASA flanges was extended tocover torsion equal in magnitude to the bending moments investigated;the data are given in Table 8. A friction factor of/ = 0.20 is assumed.Neither flange can be considered adequate to withstand thetorsional moments applied. While it is true that the assumptionsused are extremes, the investigation clearly indicates theneed for caution where torsion is concerned. This is even moretrue for gaskets other than metal rings with a lower degree ofrigidity particularly such that suffer from abrasion.Similar lines of reasoning can also be applied to shear effectsand pipe thrusts, although it is believed that neither ordinarilywill be significant.Concerning the calculation of flanges under the conditions ofcreep and relaxation obtaining at elevated temperatures, thereader is referred to an interesting article by Bailey (10). Unfortunately,a large degree of uncertainty attaches to the creepconstants and temperature assumptions which must be made, andpresent experience at high temperatures is insufficient to permit ofcorrelating theory and practice. As far as superimposed stressesdue to line expansion are concerned, Bailey suggests that thesetend to diminish rapidly and need not be considered in connectionwith the ultimate steam tightness of the joint.BIBLIO G R A PH Y1 “Thermal Stress,” by J. N. Goodier, Journal of A pplied M echanics, Trans. A .S.M .E., vol. 59, March, 1937, p. A-33. Also publishedin “ Design D ata,” a com pilation of reprints from the Journalof A pplied Mechanics from 1935 to 1938, T h e A m e r i c a n S o c i e t yo f M e c h a n i c a l E n g i n e e r s , N ew York, N . Y ., March, 1939, p.23.2 “T he Strength and Flexibility of Corrugated and Creased-Bend Piping,” by R . L. Dennison, U. S. N ., Journal of TheAmerican Society of Naval Engineers, vol. 47, no. 3, August, 1935, p.343.3 “ Deflections and Stresses in Pipe B ends,” by W illiam H ovgaard,Paper N o. 317, World Engineering Congress, Tokyo, vol. 3,1929.4 “Failure Theories of M aterials Subjected to CombinedStresses,” by J. Marin, Proceedings of The American Society of CivilEngineers, vol. 61, August, 1935, p. 851. This paper contains acomprehensive survey of available theories.5 “T he Utilization of Creep T est D ata in Engineering D esign,”by R. W . Bailey, Proceedings of The Institution of M echanicalEngineers, vol. 131, November, 1935, p. 131.6 “ Creep in Tubular Pressure Vessels,” by F. H . Norton, Trans.A .S.M .E., vol. 61, April, 1939, p. 239.7 ‘‘The Fatigue of M etals,” by H . F. Moore and J. B. Kommers,M cGraw-Hill Book Company, Inc., N ew York, N . Y ., 1927.8 “ First Report of the Pipe Flanges Research C om m ittee,” byH. J. Gough, Proceedings of The Institution of M echanical Engineers,vol. 132, February, 1936, p. 201.9 “ Formulas for Stresses in Bolted Flanged Connections,” byE . O. W aters, D . B . W esstrom, D . B. Rossheim, and F. S. G. Williams,Trans. A .S.M .E ., vol. 59, April, 1937, paper FSP-59-4, p. 161.10 “ Flanged Pipe Joints for High Pressures and Temperatures,”by R. W . Bailey, Engineering, vol. 144, July-D ecem ber, 1937, pp.364, 419, 490, 538, 615, and 674.11 For further discussion of working stresses in bolting see:"Piping H andbook,” by J. H . Walker and S. Crocker, McGraw-HillBook Company, Inc., N ew York, N . Y ., third edition, 1939, pp. 259-263 and 376-379. Also: “Flanged Pipe Joints— M ethods of Applyingand Determ ining B olt Stresses,” by E. C. Petrie, Heating, P iping andA ir Conditioning, vol. 8, June, 1936, p. 303. Also: “ First Reportof the Pipe Flanges Research Com mittee of the British StandardsInstitution," Engineering, vol. 141, 1936, pp. 243-245 and271-273.DiscussionW i l l i a m H o v g a a b d . 4 This paper is very suggestive andaffords a good basis for a discussion of the many difficult questionswhich arise in the design of pipe lines. The problem presentedmay be summarized as that of the determination of factors ofsafety for pipe stresses.It is necessary to distinguish between the states of stresswhich exist locally and those which exist generally throughoutthe pipe. In the former class belong the longitudinal stressesdenoted by f L in the paper and stresses localized near the ends ofthe pipe. These stresses combine with hoop stresses and torsionalstresses, creating a state of stress which should not be allowedto approach the condition of plasticity. If flow does occurlocally, a permanent set is liable to occur, although the safety ofthe pipe may not be endangered. It is believed that this stateof stress is best measured by the Hencky-Mises formula, givenas Equation [5] in the paper. The expression on the left side of theequation does not represent an actually existing stress, althoughit has the dimensions of a stress. It is simply a function of thecomponent stresses, so constructed that when it reaches the valueof the yield point, flow of the material will occur. This functionthe writer has called the “equivalent stress” in various papers,and has denoted it by /,„. It is suggested that the equivalentstress should not exceed one half of the stress at the yield point;that is, the factor of safety, in case of the stresses here under consideration,should be at least 2 relative to the yield point. It isfound that then with all ordinary values of the circumferential orhoop stress, f c, the longitudinal stress, f L, can be from 1000 to2000 lb per sq in. higher than the equivalent stress.In the latter class of stresses, which are general over the entirepipe, belongs the hoop stress, f c, caused by the steam pressures.It has a special significance, because it cannot be relievedby a change of form of the pipe or by a readjustment of thestrains. When the pressure is associated with high temperatures,creep has to be considered and, due to our incompleteknowledge of this phenomenon, it is advisable to use a relativelyhigh factor of safety. Hitherto, it appears that, in the case ofthe hoop stress, the factor of safety has been ordinarily related tothe ultimate strength. This was quite satisfactory so long as theratio between the ultimate and the yield strength was fairly constant,but in modern alloy steels, where this ratio may varywidely, it seems safer and more rational to relate this factor tothe yield point, which determines incipient breakdown. It is ofinterest to note that Lloyd’s Rules, for instance, prescribe a■thickness of the pipe wall, which, including the additional incrementof 0.12 in., gives a factor of safety of about 7 relative to ayield point at 500 F of 27,000 lb per sq in. This is obtained, assuminga steam pressure of 400 lb per sq in., a wall thickness of0.319 in., and a hoop stress of 3750 lb per sq in. An analysisof other rules representing ordinary practice seems to indicatethat the factor of safety of the hoop or “bursting” stress relativeto the yield point should not fall below 6.A. E. R. d e J o n g e . 6 The authors should be highly commended1 Professor Em eritus, M assachusetts Institute of Technology; address,Brooklyn, N . Y . M em. A .S.M .E .5 M echanical Engineer, The Babcock & W ilcox Company, NewYork, N . Y . M em. A .S.M .E .
ROSSHEIM, MARKL—STRESS IN PIPE LINES DUE TO PRESSURE AND EXPANSION 455for having undertaken the arduous task of outlining the problemsencountered in determining the stresses in pipe lines. As theirpaper is intended to be a “vehicle for discussion” of these problemsto supply material for a new piping code, it offers an occasionto stress the difficulties of this undertaking.As the total stress can only be arrived at by a combination ofthe individual stresses, the latter have first to be considered separatelybefore they can be combined.With regard to internal pressure, the Lam6 formula for thickwalledcylinders is probably the best to use as it gives resultswhich agree fairly well with practical measurements. It mightbe said that an attempt should be made to obtain uniformity in allcodes concerning pressure vessels with respect to the use of thisformula.Expansion stresses, on the other hand, provide a very differentproblem. First, the fundamental assumption made in their determinationis that the ends of the pipe line are rigidly fixed.This assumption, however, is rarely if ever correct. It is thereforenecessary to begin with the investigation of the rigidity ofthe various apparatus connected by pipe lines and to classifythem with regard to the “degree of fixedness” assigning definitepercentage values or percentage limits to them. For instance, apressure vessel supported on a high gantry will offer but a slightdegree of fixedness in the horizontal plane while it must be consideredmore or less rigid in the vertical direction. This investigationand classification has not only to be extended to linear displacements,but also to rotations.However, even when disregarding all considerations of partlyfixed ends, the problem of calculating stresses in pipe lines inspace is by no means solved as yet with anything approachingaccuracy. The theoretical values for the deflections and rotationsin pipe bends, subjected to torsion, transverse bending, andtransverse forces, do not check with the test results, differing insome cases by more than 50 per cent, the error being systematic,i.e., always in the same direction. Even straight pipe lines donot seem to follow the laws of ordinary beams any better. Thus,compound pipe lines in space exhibit quite different flexibilitiesfrom those usually assumed in the calculations, although itshould be stated that these values could be allowed for in the calculationsif they were known with any degree of certainty. Deadweight and local stresses at hangers, anchors, etc., are usuallyneglected and so are temperature stresses. In heavy pipe lines,however, deadweight should not be neglected. With all this uncertainty,it does not seem to be of much use to lay down fixedrules for maximum stresses.Fortunately, pipe lines are generally more flexible than assumed,and this factor works in the direction of lower stresses.In addition, should overstressing occur, the usual materials forpipe lines exhibit the useful property of ductility and thus automaticallylower the stresses in the pipe line by local yielding. Thesame holds with respect to creep. Prespringing is another uncertainfactor, and so is the fact that load variations or load alternationsoccur. In combining the stresses obtained for theseindividual effects, it is clear that the end result will be even moreuncertain.Taking all these factors into consideration, the fixing of. stresslimits can only be regarded as a very rough approximation whichof necessity must prove to be highly controversial. The actualapproach to the subject obviously lies in investigating all of thedifferent factors separately and more carefully than has hithertobeen done, to fix for each one the limits within which theory andmeasured results agree, and then to compound these limit factorsinto a common limit factor. It is apparent that, for this purpose,experimental investigations on the flexibility of actual large-sizepipe lines are required, and while such investigations have probablybeen made by individual firms, very little has been publishedregarding the results of such experiments. Only by coordinatingtheoretical calculations and experimental investigationsis it possible to arrive at any data which may be regardedas approaching reality and thus be of value. By using such anapproach to this complicated problem, the usual safety factorwill no longer be a “factor of ignorance” in so far as pipe lines areconcerned.J o s e p h M a b i n . 6 Considering the condition of static loading,the authors’ Equation [5] includes the stresses due to bending,torsion, and the longitudinal and circumferential stresses due topressure. It is of interest to study, in addition, the radial stressand to determine the influence of the various forces in producingfailure. If the radial stress f3 is included as shown in Fig. 8 of thisF i q . 8 T h r e e - D i m e n s i o n a l A s p e c t o f S t r e s s P r o b l e m W i t hR a d i a l S t r e s s I n c l u d e d i n A d d i t i o n t o S t r e s s e s D u e t o B e n d i n g , T o r s i o n , a n d P r e s s u r e
456 TRANSACTIONS OF THE A.S.M.E. JULY, 1940The left side of Equation [18] is proportional to the distortionenergy for an element at a distance r from the center. The criticalelement at which failure occurs will be for the maximum valueF io. 9 V a l u e s o f L o a d R a t i o S P l o t t e d V e r s u s L o a d R a t i o L jf o r V a r i o u s V a l u e s o f T w i s t i n g M o m e n t t o B e n d i n g M o m e n ta s a P a r a m e t e rThen Equation [18] beof the distortion energy or for r = a.comesSubstituting values of ki and h? from Equation [17] in Equation[19]Equation [20] gives a relation between the loads, dimensions,and the stress/in simple tension at failure. If the stress/is consideredas the allowable stress, Equation [20] can be used forpurposes of design. A design chart can be constructed by rewritingEquation [20 ] thusA plot of Equation [21 ] is shown in Fig. 9, in which values ofthe load ratio S are plotted versus the load ratio Lt for variouspossible values of the twisting moment to the bending moment asaa parameter. Fig. 9 is plotted for a value of R = - = 0.25. Inothis way the allowable loads can be determined for a given pipe or,by plotting Equation [21 ] for various values of R, the requiredsize of piping can be selected.Arthur M cCutchan.7 The authors of this paper have furnisheda comprehensive analysis of stress problems involved in thedesign of pipe lines with a view to finding satisfactory bases forestablishing allowable combined bending-plus-pressure stresses.Their lucid account of the factors involved should stimulate discussionof controversial issues and thus aid in reaching a consensusof opinion on how far a safety code such as the Code for PressurePiping need go in setting limits on stresses other than girthstresses due to internal pressure.The section on effect of “cold springing,” or “prespringing” asthe authors have termed it to distinguish from the similar effectresulting from “self-springing,” is particularly valuable. Althoughthose who have worked intimately with the subject offlexibility of piping fully recognize that a hot line will relieve itselfof excessive bending stress through creep or yielding of thematerial, there appears to be a rather widespread misconceptionthat creep tends to reduce rather than increase the initial coldspring usually provided in piping for high-temperature service.The fact that an overstressed line at high temperature tends torelieve itself of any overburden of bending stress through creepor yielding of the component parts is responsible for the statementsometimes heard that: “The Lord takes care of flexibilityexperts.” It is only when excessive bending moments result inleakage of bolted joints, or excessive thrusts or moments displaceanchors or cause misalignment of equipment, that there is anyuntoward manifestation of lack of adequate flexibility. In recognitionof the greater significance of stress related to high bendingmoments at bolted joints, the practice of the writer’s companyfor the last 10 years has been to assign lower values of permissiblestress at bolted joints than in curved pipe or straight pipe remotefrom joints.In the case of creased bends, and corrugated bends and corrugatedstraight pipe, lower total combined pressure-plus-bendingstresses also have been assigned, but for a different reason. Thetests made by Lieutenant Robert Dennison (2), to which the authorsrefer, indicated rather high stress concentrations in suchstructures. Under cyclic stress, cracks eventually developed inthe creases and corrugations at stresses corresponding to relativelysmall bending moments.A study of the variable stress conditions existing in steam pipingin central-station power plants, however, indicates that only inthe case of a combination of a large constant bending stress andsevere vibration of the line would it be possible to produce fatiguefailure. Moreover, because of the self-unloading characterof bending stress, arising from constraint of thermal elongationof a line, it appears doubtful if even this condition need be fearedin practice.For conditions encountered in power plants, the writer deducedthe following stress-intensification factors from Lieutenant Dennison’stests (2) and Professor Moore’s repeated pressure tests onboiler drums,8 as applicable to creased bends and to corrugatedpipe and bends:Creased bends........................................... 2 to 2.5Corrugated pipe and bends................. 2.5 to 3These values for corrugated pipe and bends agree surprisinglywell with the factor of 2.5 suggested by the authors for noncyclicloading. In the case of creased bends, the authors, in their effortto link such factors with flexibility factors, appear to have overlookedthe fact that almost as great stress intensification wasfound in Lieutenant Dennison’s tests of creased bends as in testsof corrugated bends.7 Engineering D ivision, T he D etroit Edison Company, D etroit,M ich. M em . A .S.M .E .8 “ T ests of the Resistance to Repeated Pressure of Forged, R iveted,and W elded Boiler Shells,” by H . F. Moore, Trans. A .S.M .E ., vol.53, 1931, paper FSP-53-6, pp. 55-60.
ROSSHEIM, MARKL—STRESS IN PIPE LINES DUE TO PRESSURE AND EXPANSION 457The satisfactory behavior of creased and corrugated pipe underactual conditions of use may be explained on the basis of the selfrelievingcharacteristic of bending stress induced by constraint ofthermal elongation. This unloading automatically reduces thebending stresses in the convolutions to those which the materialwill support at the operating temperature. Since the endurancelimit holds up better than the yield strength and the creepstrength as the temperature is raised, it is doubtful if a high-temperatureline can support enough steady stress for the superposedvibratory stresses to cause fatigue failure.Since the amount of the unloading will appear as an addition tothe cold spring originally provided, rather severe stresses mayexist in the convolutions of creased and corrugated pipe in thecold condition. These bending stresses emphasize the desirabilityof eliminating locked-up stresses by annealing such piecesafter fabrication. The number of these major stress cycles,caused by change from a cold to a hot condition in a main steamline of a central station, ordinarily does not exceed a few hundredin the life of a plant. Consequently, failure under such conditionsis related to a property of material termed by Professor H. F.Moore as “crackless plasticity.” 9 Material used in fabricatingcreased and corrugated pipe usually is capable of considerableplastic deformation without developing cracks. It can be concludedtherefore that the stress-intensification factors given bythe authors, with the exception of those for creased bends, willinsure proper application of such structures. The writer wouldsuggest a factor of 2 for creased bends under noncyclic stressesand 4 for cyclic stresses.In the writer’s opinion, the maximum-shear theory (4) shouldbe used in combining stresses resulting from effects of bendingand pressure rather than the principal-stress theory advocatedby the authors, since yielding, not eventual fracture, is the conditionof so-called failure which can be anticipated in a structureloaded by constraint of linear expansion. The maximum-sheartheory possesses the further advantage of extreme simplicity.In the absence of torsion, the combination of bending and pressurestresses to obtain the tensile stress equivalent to the maximum-shearstress reduces to the following simple expressions:1 For side of pipe in tensionSeq = S b + Si2 For side of pipe in compressionin whichSeq — S b — Si -(- StSeq = tensile stress equivalent to maximum shear stressSb = stress caused by bending moment, tension on one sideof pipe, compression on the otherSi = longitudinal stress due to internal pressureSt = transverse or hoop stress due to internal pressure.Fine distinctions as to which theory to use in combining stressesare not justified, however, in analyzing structures in more thanone plane, the flexural characteristics of which can hardly be determinedwithin an assured accuracy of 10 per cent. Furthermore,commercial variations in pipe-wall thickness within thepermissible limit of 12'/2per cent from nominal dimensions mayaffect the flexibility of the pipe line a corresponding amount.The writer would point out that the paper does not attempt tocover the method of computing expansion stresses, moments, andreactions, since there are a number of available methods whichgive comparable results, at least for simple structures. Somestructures, however, are extremely difficult or impossible to com-* “A n Investigation of the Fatigue of M etals— Series of 1925,” byH. F. Moore and T. M. Jasper, U niversity of Illinois, Engineering ExperimentStation, B ulletin N o. 152, 1925.pute by methods approaching rigorous accuracy, and squarecornerapproximations or other simplified assumptions oftenhave to be resorted to. If too specific flexibility requirementsare written into the code, the writer begs leave to ask who can determinewhether they have been met in complicated structures?In the case of branch lines' three-ended structures, and the like,the most that can be determined is that certain stresses will notbe exceeded.The idea of establishing a permissible range of total combinedstress to limit the stresses in both the hot and cold conditionshas the advantage that the numerical value of such stresses canbe made the same as the values of allowable stress given in thecode for determining pipe-wall thickness and yet be high enoughnot to interfere with good design from a flexibility standpoint.The definitions of S a and S a' given in the paper seem inadequate,however, in that they fail to specify that these terms relate tobursting stress as distinguished from bending stress, or that theso-called allowable stress refers to total combined stress.The proposed setup allows a conservative designer to ignore, iflie so desires, the ameliorating effect of cold spring, whether actuallypresent or not, but still permits him to use a total combinedstress of not to exceed 75 per cent of the sum of the allowablebursting stresses at room and at operating temperatures.On the other hand, it allows more latitude in case of need or forthose who want it. For instance, at 900 F using carbon-molybdenumpipe, the 75 per cent rule for no cold spring would allow atotal combined stress of 15,750 lb per sq in., whereas the 100 percent rule for 50 per cent cold spring would allow 21,000 lb per sqin.It is possible that in lieu of these detailed stresses the simplerequirement that a line should be designed so that it could be coldsprung 100 per cent of the computed linear expansion withoutdeveloping stresses exceeding 2/ 3, or some such fraction, of theminimum specified room-temperature yield strength of the pipematerial would be a satisfactory code statement as far as any actualhazard is involved.The writer’s observation of the disturbing effect of bendingmoments on bolted-flanged joints is at variance with the reassuringconclusions reached by the authors which are to the effectthat ASA standard flanges, at least where used with ring joints,can withstand any bending moments commonly encountered.Actual experience with 1000 F experimental flanged joints hasindicated that even small bending moments can cause leakage ofan otherwise satisfactory ring joint. Calculations also showedthe desirability of using 1500-lb alloy-steel flanges on 865-lb persq in. 910-F service, assuming a Vs-in-wide metal gasket, evenwhere the bending moment was limited to that corresponding to atotal combined stress of only 10,000 lb per sq in. Hence, it wouldseem desirable that the authors support their conclusions withadequate explanation of how they are arrived at.Although there are a number of assumptions, regarding initialbolt loadings, necessary residual gasket compressions, and probableresidual bending moments existing in steam lines after yearsof service, to which exception might be taken, the writer feelsthat a discussion of these points might tend to obscure the realpurpose of this symposium, which, as he understands it, concernshow far a safety code need go in prescribing limits for total combinedstress in piping systems, together with methods for combiningsuch stresses.P . E. P e n d l e t o n . 10 The paper is valuable in that it pointsout the controlling design features for high-pressure and hightemperaturepipe lines. Among these are relaxation stress, aproper theory of failure, and the importance of high localized10 Lieutenant-Com mander, U. S. N ., Bureau of Engineering, N avyDepartm ent, W ashington, D . C.
458 TRANSACTIONS OF THE A.S.M.E. JULY, 1940stresses in systems subject to repeated loading, as well as theirlack of importance under conditions of static loading.However, no quantitative data are presented in regard to relaxationstress, i.e., at what temperature does it become the controllingfactor for a specific material and what are the values ofthis stress at various temperatures. Accurate data on this questionare difficult to obtain, although several laboratories in theUnited States are actively engaged in this problem.The importance of keeping the range of stress of a piping systemmidway between the positive and negative yield strengths istimely. In this connection, it would be interesting to see a developmentmade of the influence of locked-in stresses of a weldedpipesystem and their effect in extending the stress range betweencold and hot conditions.At present, the Bureau of Engineering of the Navy Departmentcalculates total combined or equivalent stress by the Hencky-Mises maximum-shear strain-energy theory, specifying a maximumof 15,000 lb per sq in. for this stress. A 50 per cent coldpull-up is required on all main steam lines, but no credit is givenfor this in calculating the stress in the pipe line when hot. It isthus unlikely that many regions exist in which any localizedstresses greatly exceed the yield point of the pipe material. Consequently,there will be but little self-springing in pipe lines designedin this manner. On the other hand, the 50 per cent prespringingwill subject the piping to a maximum negative, or coldstress of 8500 lb per sq in. Since the combined working stress of15,000 lb per sq in. is less than the relaxation stress, the formerwill control the upper limit of the stress range. This range willthen be 23,500 lb per sq in. (giving no credit for reduction in hotstresses) for Navy main steam piping, which is carbon steel fortemperatures up to 650 F, and carbon-molybdenum, for temperaturesranging from 650 to 850 F. However, if credit be given for50 per cent cold pull-up, the stress range will be 16,000 lb per sqin., which compares with a 19,200-lb per sq in. combined-stressrange for carbon steel at 650 F as given in the paper. It would beinteresting to know what upper limits of combined stress wereused in compiling the allowable stress ranges given in Table 2.Attention drawn by the authors to the limitations of the varioustheories of failure when applied to piping design suggests thatfurther development of this subject is desirable, especially in theplastic range.The use of simplified formulas for the determination of thrustand bending moment for particular pipe systems suggests thatmuch could be done in this connection to facilitate design calculations.The writer wishes to endorse the suggestion often made that thevarious research problems involved in high-pressure-temperaturepiping design be allocated by a combination of interested groupsto laboratories and technical organizations best-fitted for theirsolution, so that duplication of effort may be avoided.In the preparation of this discussion, the writer is indebted toII. Michel, marine engineer, Bureau of Engineering, Navy Department,for his able assistance.E. L. R o b i n s o n . 11 During the last 10 years new installationsof high-temperature steam piping have definitely gone beyond thetemperature range throughout which elasticity is preserved, untilat the present time there are approximately 2,000,000 kw of steamturbines in operation at temperatures where plastic deformationunder stress definitely takes place. Furthermore, most new installationsare being made at temperatures above that at whichelasticity may be expected to persist without plastic effects.Ten years ago the determination of the elastic reactions andthe corresponding stresses due to thermal expansion constituted11 Turbine Engineering D epartm ent, General Electric Company,Schenectady, N . Y . M em . A .S.M .E .one of the principal problems in connection with the design ofhigh-temperature piping installations. Most modern installationsare being designed for operation at temperatures at whichrelaxation causes a decrease in elastic stresses as time goes on,rapidly at first and then more slowly. On this account, industryis confronted with problems of design for which there is little substantialbackground. The authors have made a valuable contributiontoward the solution of these problems. They are carefulto distinguish between yielding and rupture and, for the mostpart, their conclusions are so well qualified as to make it difficult todisagree with them.In a few respects it is possible that the writer can contributesome useful observations.The authors favor more than 50 per cent prespringing, but itdoes not seem to the writer that they emphasize the benefits1ofthe greater prespringing sufficiently. The attitude is taken that,since relaxation results in self-springing, the long-time conditionswill be the same. However, as they point out, this requires agreater amount of permanent set or creep in order to effect the relaxation.The results of high-temperature rupture tests conducted duringthe last 2 years raise a very real question as to whether or notit is wise to ask too much of readjustment by means of creep.Creep, in itself, is beneficial, but when it leads to a brittle break,it does not seem wise to base design upon the expectation that itwill occur without any deterioration of the material.The authors do not discuss the invalidation of elastic analysisby the occurrence of plastic deformation. It is, perhaps, unwelcometo those who have devoted much high-grade analytical workto the determination of elastic stresses in high-temperature pipingto realize that the reactions fall off and the stress distributionalters. On the other hand, it might be pointed out that, if thepractice of prespringing to the extent of 100 per cent of the thermalexpansion should be generally adopted, the elastic analysiswould have reality when the piping is cold and strong and whenthe stresses are not combined with pressure. While at high temperaturewhen the strength is reduced, existing stresses will be dueto pressure only and not due to the reactions brought into playby the prevention of thermal expansion. The writer believesthat prespringing should certainly be sufficient to assure extremelylow rates of creep from the beginning.Equation [9] of the paper is quoted from Moore and Kommers(7) to represent the fatigue strength where the stresses are notcompletely reversed. The tests given in the reference weresponsored by the writer’s company and were first reported inbulletin form.12 Originally, in presenting this formula ProfessorMoore made a number of qualifying remarks. In particular theformula fails as the stress ratio in the denominator approachesunity because the tensile strength is almost never 3 times the endurancelimit for complete reversal, and a maximum stress beyondthe tensile strength should not be implied as satisfactory.Where test results are not available, the writer would prefer amodified Goodman diagram based upon 1/% the tensile strengthfor complete reversal. However, an actual diagram of test resultsfor the conditions of application would be better.The authors repeatedly refer to the “relaxation limit.” As amatter of fact there is no true relaxation limit any more than thereis a true creep limit. It all depends upon the time. Thus at hightemperature within a few hours all high stresses decrease rapidlyto a level at which further decrease is slow. This is what is accomplishedduring a stress-relief anneal. On the other hand, ifthe same process is continued for 1000 hr, the gradual reductionof stress proceeds still further, and the residual stress is progres-12 “ A n Investigation of the Fatigue of M etals— Series of 1922,” byH. F. Moore and T . M. Jasper, U niversity of Illinois, Engineering Experiment Station, B ulletin N o. 136,1923.
ROSSHEIM, MARKL—STRESS IN PIPE LINES DUE TO PRESSURE AND EXPANSION 459sively lower after 10,000 hours and again after 100,000 hours.The authors quote Bailey’s conclusion that the relaxation limitfor 100,000 hr corresponds to the stress causing 0.1 per cent creepin that period. The writer doubts the wisdom of such a generalization.It is much better to have a relaxation test than to try todetermine bolt performance from a constant-stress test. Severalsimple methods of conducting relaxation tests, as reported by fourdifferent companies, were described in a report of a Subcommitteeof the A.S.M.E.-A.S.T.M. Joint Research Committee on theEffect of Temperature on the Properties of Metals made in1938.13The writer’s company has run hundreds of relaxation tests onall varieties of high-temperature steels and prefers such tests forthe prediction of bolt performance and uses them instead of constant-stresstests for preliminary evaluations of material for hightemperatureservice. In many such tests, the residual stress at10,000 hr corresponds closely to the constant stress causing 0.1per cent per 100,000 hr, although in so many cases the residualstress is far below this level that it is unwise to take the correspondencefor granted. Almost without exception, the residualstress for 100,000 hr is far below the stress corresponding to acreep rate of 0.1 per cent per 100,000 hr.The authors refer to the “applied stress” for alloy-steel bolting.It is always difficult for the writer to visualize the applied stressin a bolt. It is easier to think of the bolt as having a measuredextension when initially assembled, determined by the length ofthe bolt, the number of threads per inch, and the number of flatsthe nut is turned in tightening up. Technically, a “strain” isapplied rather than a stress, and even this is not easily measuredwith soft gaskets. The authors suggest applying a stress to produce1 per cent creep in 100,000 hr. The writer believes that aninitial strain, corresponding to a considerably higher elastic stress,is desirable to assure tightness even though relaxation soon reducesit. Bolts may well be taken up 0.1 or 0.15 per cent. However,the effective stress remaining in the bolt to keep the jointtight after a period of time must be determined from the relaxationproperties of the material. This will be far less than theelastic stress corresponding to the inital setup, although it is notquite independent of it. A bolt tightened 2 mils per in. initiallywill be measurably tighter after 10,000 hr than a similar boltfirst tightened 1 mil per in.N. O. S m i t h - P e t e r s o n . 14 The problems involved in suchcalculations as are carried out in this paper are not simple tensionor bending-stress problems to which there can be only a right ora wrong answer. They are complicated and involve many assumptionsas well as a choice of different formulas for their solution.In presenting the solutions of these problems in completedetail, with formulas, assumptions, and calculated results, itbecomes possible for others to compare their methods with thoseof the authors. The writer has done so and has obtained resultsdiffering somewhat from those listed in Table 5, pertaining toflange stresses. The difference in amount is not nominal and isdue to difference in choice of formulas and assumptions made.It is the stated aim of the authors in publishing this very thoroughpaper to develop just such difference in methods of calculation,and the writer is hereby presenting his methods as they apply tosome of the problems.The writer uses the same formula for flange stresses as theauthors, namely, the Waters, Rossheim, Wesstrom, and Williamsformula, presented to this society in 1937. The writer’s reasonfor using this formula, among the many flange formulas in exist-13 “The R esistance to Relaxation of M aterials at H igh Temperatures,”b y E . L. Robinson, Trans. A .S.M .E ., A ugust, 1939, pp. 5 4 3 -550.14 Walworth Com pany, N ew York, N . Y.ence, is the fact that it is the only formula which permits calculatingstresses in the three axial directions, viz., hub, radial, andtangential flange stresses. However, before being able to usethese formulas, it is necessary to make assumptions concerningthe end-force area, ring contact area (or gasket area), and residual-contact-pressureratio.The authors consider the end-force area to extend to the ringpitch diameter, the ring contact area to be equal to */» theannular-ring area, and the residual contact pressure to be 5‘A to 1.The writer follows the A.S.M.E. Boiler Code regulation in consideringthe end-force area to extend to the outside diameter ofthe ring. The contact area is accurately calculated according tothe sloping surfaces of the ring, and the residual contact pressureis taken to be 6 to 1.This difference in calculations gives approximately 10 per centhigher flange stresses for a 24-in. 1500-lb flange than those listedby the authors in Table 5, items 14, 15, and 16.These differences are largely in assumptions in that the sameflange formulas are used. However, a formula difference alsoexists between the authors and the writer when it comes to calculatingthe transmission of pipe-line bending moments by a boltedflanged pipe joint.The authors consider such bending moments to be transmitteddirectly to the flange bolts and, hence, use the section modulus ofthe bolt arrangement in the joint to obtain the total preloadingbolt stress required for maintenance of joint tightness.The writer believes that no bending-moment action can betransmitted to the flange bolts until the contact pressure on thering has been completely absorbed (leak condition) and that,therefore, for a tight joint, where the existence of a residual contactpressure on the ring is required, the bending moment willaffect directly the ring-contact pressure and not the bolt stress;hence, the ring section modulus is involved in obtaining the totalpreloading bolt stress.In explanation of this latter theory, which does not take intoaccount elastic effects, consider the universally accepted mannerof calculating the required preloading of a ring in order to insurejoint tightness when an end force is exerted upon it. The universallyaccepted way is to assume the end force, a tensile force,to be transmitted directly to the ring contact surfaces and thereto reduce the existing contact pressure. The end force is notconsidered as being transmitted to the flange bolts and, therefore,does not cause any change in the bolt stress. Similarly, a bendingmoment, which on one side exerts a tensile force, should notbe conceived of on that side as affecting the bolt stress, but shouldbe conceived of as here reducing the contact pressure. On theother side, the compression side of the bending moment, the contactpressure is, of course, increased. Therefore, to calculate theamount of such decrease and increase in the contact pressure,the section modulus of the pressure area is required to be usedand not the section modulus of the bolt arrangement. After calculatingthe contact-pressure changes due to a bending moment,the calculation of the required bolt stress is then undertaken.The writer’s method leads to an 18 per cent higher flange stressthan those listed under items 17, 18, and 19 of Table 5, for a 24-in. 1500-lb flange.These percentage differences in calculated stress results are notnominal, and it is to be noted further that the basic flangeformulas used by the authors and the writer are the same. Werethere any differences in the choice of these formulas, the percentagedifferences in calculated results would be greater yet. Thesituation, therefore, seems to call for the adoption, by code-makingauthorities, of flange formulas and calculating methods ingeneral, as well as allowable stresses. The authors’ paper makesthis also evident throughout and is an excellent exposition of thewhole pipe-line problem.
460 TRANSACTIONS OF THE A.S.M.E. JULY, 1940A u t h o r s ’ C l o s u r eThe authors acknowledge their debt of gratitude to the manydiscussers who, by their interesting comments, have materiallyadded to the value of this paper. Considering the relativenovelty of the subject dealt with, it is gratifying to note fair agreementon the basic conclusions and, consequently, the closure canbe limited to the clarification of certain points brought out in thediscussions.While the discussion of the theory of calculating a pipe line forflexibility has purposely been excluded from this paper, Mr. deJonge’s reminder that much is still to be learned on this subject isnot untimely. However, the assumptions usually made are onthe side of safety and the available methods of calculation, if appliedby competent engineers, are entirely satisfactory for engineeringuse.The main issue, that of allowable stresses for pipe-bend calculations,has received wide comment. Professor Marin has contributeda study of the triaxial state of stress and its implications.The Hencky-Mises theory is advocated as a stress criterion byProfessor Hovgaard, Lieut-Com. Pendleton, and, in the verbaldiscussion, by Mr. Soderberg, whereas Mr. McCutchan favorsthe maximum-shear theory. While it is conceded that a matterof principle is involved, either failure criterion appearsadequate considering the present undeveloped state of our knowledge.As pointed out by Mr. Robinson, the authors haveavoided more than passing comment on the invalidation of theelastic analysis by the occurrence of plastic deformation. Theyfelt justified in slighting this aspect by the fear of confusing theissue which is to define workable rules for evaluating the flexibilityof piping. Again, the redistribution of stresses due to creep andthe phenomenon of relaxation are in favor of the structure, and anelastic analysis gives the limits of stress through which thematerial goes in each cycle of change from the elastic to the semiplasticand ultimately, in extreme cases only, the fully plasticstate.On the other hand, the authors gladly comply with Mr. Robinson’srequest to lend added emphasis to the injunction to use prespringingin excess of 50 per cent. Appreciation of the benefitsobtained from cutting a line short is growing steadily, and wewould assume that this will soon be general practice. Theauthors have used the following rough rule as a guide in settingthe desirable amount of prespring s:S J B2 SJ BS J E + S 'J E ' * 2 S a/E + S 'a/E 'In order to understand the significance of this formula, itshould be remembered that S A, the bursting stress specified in thecodes, corresponds to 40 to 50 per cent of the yield point cold; andS 'A either corresponds to the same percentage of the hot yieldpoint or to from 80 to 100 per cent of the stress producing 1 percent creep in 100,000 hr, which can be considered the virtual relaxationlimit (in the same sense as Lieut. Dennison defines the“virtual” endurance limit). E and E' are the cold- and hotelasticitymoduli, respectively. Since the allowable stress rangefor a prespring s in excess of 0.5 is S A + S 'A, the lower limit of sin the formula gives a stress of S A cold and S 'A hot, or a rangebetween, roughly, one half the cold yield point and one half thehot yield point or, for elevated temperatures, the relaxation limit;this state of stress will also be produced in an unsprung bend (attemperatures involving creep) after a period of operation producingcomplete relaxation. The upper limit of a, which should beapproached in particular for high-temperature applications, placesthe average stress midway between the yield point at room temperatureand the virtual relaxation limit, thus reducing the operatingstress. The formula gives presprings between 50 and closeto 100 per cent, depending upon the material strengths at roomand operating temperatures.Mr. McCutchan favors reduced stresses at bolted joints. Whilethe authors agree that bolted joints should receive special attention,their experience is that a reduction in allowable stress is notgenerally necessary with ring-type-gasket joints. Actually, thestress specified at the bolted joint would govern the entire pipingdesign, since maximum moments usually occur at the connectionsto equipment where bolted joints are normally located. Mr.Smith-Peterson’s comments on the detail calculations of theflanges have been found interesting, and the authors agree that itwould have been more proper to base their investigations of theeffect of bending moments on the ring section modulus in placeof the section modulus of the bolting.
P roperties and Perform ance ofPlastic B earing M aterialsB y L. M . TICHVINSKY,1 EAST PITTSBURGH, PA.B earin gs m a d e o f p la stic m a te r ia ls c a n be u sed su c c e ssfully n o t o n ly for th e ca se o f p erfect fluid lu b r ic a tio n b u ta lso for t h a t o f se m iflu id lu b r ic a tio n . C erta in a d d itio n s,su ch a s g ra p h ite, w ill s o m e tim e s p e r m it t h e a p p lic a tio no f th e se m a te r ia ls u n d er co n d itio n s o f dry fr ic tio n .B y v irtu e o f good p h y sic a l p rop erties th e se b earin g sfind a w ide a p p lic a tio n . H ea v y -d u ty p la stic b earin g s areu sed in th e s te e l-m ill in d u str y . L u b ricated a n d cooledw ith w a ter, th e y carry h eavy lo a d s a t p ressu res o f severalth o u sa n d p o u n d s per sq u are in c h . A s g u id e b earin g sth e ir p erfo rm a n ce ra n g es from sm a ll, h ig h -sp e e d sp in d le s,t o large sh ip -p ropeller sh a fts. O il-, w a ter-, a n d g rea selub rica te d p la stic b earin gs are u sed e x ten siv ely in in d u s tr ia l, m a r in e, a n d fa rm m a ch in ery .T h ere are m a n y d ifferen ces in th e b eh avior o f p la stica n d m e ta l b earin g m a te r ia ls by v irtu e o f w h ic h th e p erform a n ce is a lso d ifferen t. T h is a r tic le in te n d s to p o in to u t th e m o st im p o r ta n t p h y sica l p ro p erties, a s w ell a sso m e o f th e c h a r a cte ristic p erfo rm a n ces o f p la stic b earin gm a teria ls.THERE are many reasons for the increase in the use and applicationof various kinds of bearing materials bonded withsynthetic resin. The industry in this country became interestedin these materials mainly because of some qualitiessuperior for certain applications to those found in bearing metalsand alloys. An extensive development and application of plasticbearing materials abroad was and is due primarily to the lack ofbasic bearing metals.This article describes the bearing materials bonded with syntheticresin. Rather complete data are given on the laminatedmaterials, including physical properties as well as the results ofvarious bearing performance tests. This information wasgathered from various domestic and foreign technical and scientificpublications, as well as from testing in the author’s laboratory.T y p e s o f S y n t h e t i c R e s i n - B o n d e d B e a r i n g M a t e r i a l sAll bearing materials bonded with synthetic resin can be dividedinto three types in accordance with their internal structure.1 The bearings of the first type are made from various plainor graphitic molding powders. Numerous kinds of bearings forlight and medium load applications are made from these materials.Guide bushings for high-speed spindles, or gland materialsfor sealing purposes, are typical examples of the use of thismaterial; these bearings perform under all types of friction,namely, dry, boundary, and fluid. The application of these materialsis rather limited because, as they are very brittle andfragile, impacts of even small magnitude may cause failure.Those made of graphite powder have a rather high heat-transfercoefficient.1 Research Laboratories, W estinghouse Electric & M anufacturingCo.C o n t r i b u t e d b y t h e S p e c ia l R e s e a r c h C o m m i t t e e o n L u b r i c a t i o na n d p r e s e n t e d a t t h e A n n u a l M e e t i n g , P h i l a d e l p h i a , P a . , D e c e m b e r4 -8 , 1939, o f T h e A m e r i c a n S o c i e t y o f M e c h a n i c a l E n g i n e e r s .N o t e : Statem ents and opinions advanced in papers are to beunderstood as individual expressions of their authors, and not thoseof the Society.4612 The second type comprises the most important and widelyused bearings. Such bearing material is obtained by moldingat high pressure and temperature sheets of woven textile fabrictreated with an organic binder. Synthetic resin of the phenolformaldehydetype is usually used in the manufacture of laminatedbearing materials. The molding is done in hydraulic presses(pressure varies from 1200 up to 2200 psi) at temperatures rangingfrom 120 to 180 C (I).2 Under the combined action of heatand pressure the resin softens or melts and undergoes a furtherchemical reaction, resulting in a material which no longer is fusible.By this action the filler (cuttings, laminations, and thelike) is permanently bound. The desired thickness for the finalproduct determines the duration of this operation. It may lastfrom 10 minutes to 30 hours.Laminated bearing material is strong and tough. Bearingsmade of such materials perform efficiently when lubricated withwater in which case the latter serves as lubricant and as a coolingagent. Almost any liquid (except strong alkalies) can be used, andalthough it might be recommended sometimes to add a lubricant,e.g., tallow or suitable emulsion, to the water, these bearings donot require oil or grease (2).3 Bearing material of the third type is based on an internalfelt-like structure. It is obtained by impregnating a felt of fibrousfillers consisting of cellulose fluff, linters, and similar materials.The resin is generally precipitated from a thin aqueous solution(sodium hydroxide) on and in the felt-forming fibers.These materials range in their physical properties between thebrittle powder moldings and the extremely tough and stronglaminated materials.P r o p e r t i e s o p S y n t h e t i c R e s i n - B o n d e d M a t e r i a l sLaminated materials are the most important in bearing applicationsas already mentioned, therefore most of the informationpertaining to the physical properties will be given in connectionwith these materials.(A) Modulus of Elasticity. The modulus of elasticity, orYoung’s modulus, gives the relationship between stress and strainin the elastic region. It defines the amount of strain under loadand, therefore, enables one to determine the deflection.In connection with the materials in question, for a long time thevalue of the modulus of elasticity was found to be equal to 1.0 X10⁶psi (2). However, methods were devised through which theuse of artificial silk, cotton, and many other fibers resulted in theincrease of the value of the modulus of elasticity up to 1.8 X 10⁶psi (3).Many of the synthetic bonded materials were developed in connectionwith their extensive use by the electrical industry.Through a change in the molding pressure alone it is possible toattain a considerable increase in the modulus of elasticity. Thisis clearly shown in Table 1 (4).T A B LE 1M olding pressure, p si.......... 2300 4600 9200M odulus in tension, p si. . . . 0 .7 2 X 1 O' 0 .8 5 X 10® 1.0 3 X 10⁶M odulus in bending, p s i ... 0 .7 8 X 10e 0 .9 1 X 10⁶ 1.1 4 X 10⁶According to Riechers (4) the values of the modulus of elasticity! Num bers in parentheses refer to Bibliography at end of paper.
462 TRANSACTIONS OF THE A.S.M.E. JULY, 1940for molded resinoid materials with various fillers are given inTable 2.TABLE 2FillerModulus, psiWood flour.................................(0.8 —1.17) X 10'Organic textile...........................(1.32-2.35) X 106Organic filler..............................(1.32-2.2 ) X 10*In the case of Micarta3 tubing where the fabric during rollingis maintained in tension, the modulus of elasticity reaches a valueof about 3.0 X 10⁶ psi.(li) Compressive Strength. For bearing application the compressivestrength of these materials is important.Compressive strength, as well as such properties as ultimatetensile strength and shear strength, can be increased by improvedfabric filler as can be seen from Table 3 (3).Lb per sq in.Compressive strength, p si___U ltim ate tensile strength, p si.Shear strength, p si....................T A B LE 3Ordinaryfabric-filledphenol resin25.00011.0004000-7000Improvedfabric filler27.00027.0006000-7000[The compressive strength is usually given for lam inated materialsin two directions: right angle to laminae and parallel to laminae, asillustrated by the accom panying sketch.]In Table 4 data on the compressive strength are given.TABLE 4 COMPRESSIVE STRENGTH OF LAMINATEDMATERIALSFlatwise, psi40-45,00045-50,00030-45,000Edgewise, psi20-24,00030-35,000According toEyssen (2)Rochester (5)Sm yth (6)(C) Heat Conductivity. In this property all synthetic resinbondedmaterials are inferior to white bearing metals. However,some improvements in this property have to be mentioned,especially those achieved during the last year. About a year agoone could say roughly that bearing plastic materials showed aheat-conductivity coefficient which is 100 times smaller than thatof a tin-base white metal (0.845 w per sq in. per deg C per in. forbabbitt). By reason of improvements made it can now be saidthat this ratio has decreased about one half.The thermal conductivity of ordinary Micarta is taken as equalto 0.007 w per sq in. per deg C per in. Micarta for bearing application(I and II) has higher thermal conductivity as shown inTable 5.TABLE 5Bearing Micarta I, w per sq in. per deg C per in... 0.0099 -0.01Bearing Micarta II, w per sq in. per deg C per in.. 0.00925-0.01Eyssen’s (2) published data vary between 0.0045 and 0.0059 wper sq in. per deg C per in. for laminated products, and between3 “ M icarta” is a trade name for a plastic material. Other m aterialsof the same general class are T extolite, Formica, etc.0.0077 and 0.0089 w per sq in. per deg C per in. for moldable materialsbased on felts of impregnated nonoriented fibers.According to Richardson (7) the thermal conductivity ofphenolic-plastic bearings is approximately 0.0072 w per sq in. perdeg C per in.Erk (8) gives a table of the thermal conductivity in a number ofthe “Kunstharz.” In the phenol group there are some withthermal conductivity as high as 0.020, 0.021, and 0.023 w per sqin. per deg C per in.In an endeavor to increase the thermal conductivity of Micartaand at the same time to improve friction qualities, a new methodwas developed for the manufacture of graphited Micarta. Thethermal conductivity of this material was found to be equal to0.015 w per sq in. per deg C per in. The heat conductivity ofsynthetic resin-bonded materials will never be of the same orderas that for white bearing alloys. Certain developments in themethods of manufacture may still improve this property withoutimpeding the others.(D) Other Properties. The coefficient of expansion for thelaminated product consisting of sheets of heavy square-wovenduck bonded together by means of a synthetic resin of the phenolformaldehydetype is 0.00002 per deg C per in. (6).The specific gravity of the synthetic resin-bonded materialsvaries between 1.25-1.40. For general calculation it can beassumed that 1 cu in. weighs 0.05 lb. Oil absorption is negligiblefor practical purposes while water absorption was found to varyfrom 0.5-0.8 per cent when a test piece (2 X 2 X 1A in.) wassubmerged in water for 24 hr (2).The Brinell hardness of synthetic resin-bonded materials wasdetermined by Rochester (5) as 30-12, by Smyth (6) as 35-42.P e r f o r m a n c e o f S y n t h e t i c R e s i n - B o n d e d B e a r i n g sThe performance of all synthetic resin-bonded bearings islimited, as in the case of bearing metals and alloys, by themaximum allowable temperature of the bearing materials. Theheat conductivity of the synthetic resin-bonded materials islower than that of bearing metals. Therefore, such efficient coolingis required by which maximum amount of heat generated byfriction can be removed by the circulating lubricant. An exampleof this is shown in Fig. 1. Such a bearing being lubricated andcooled with water performs at low speeds and medium loads.The sketch shows the arrangement of cooling and also the locationof the high-pressure water inlet. This bearing is not operatingin the boundary region at the starting and stopping periodsbecause the high-pressure pump forces water into the bearingclearance.
TICHVINSKY—PROPERTIES AND PERFORMANCE OF PLASTIC BEARING MATERIALS 463The softening of the synthetic resin-bonded materials varieswith type and grade of the bond. In this respect it is of interestto note some remarks by British authors pertaining to workingtemperatures of bearings. Smyth (6) indicated a safe workingtemperature of 100 C and an actual temperature of 150 C atwhich the material is unaffected. Rochester (5) recommends amaximum working temperature of 60-80 C. He mentions thatthe maximum allowable running temperature for short periodsmight reach 250 C. It is self-evident that high, localized temperaturesmight reach rather high values, not only in the regionof dry or boundary friction, but even during perfect fluid lubrication(9). In Table 6 data are given for a series of tests (10) duringwhich the final bearing temperature and the values of thecoefficient of friction were measured as a function of peripheralvelocity, clearance ratio, and pressures of 22 and 155 psi. Thetwo materials tested showed approximately thesame performance, the values of the coefficient offriction being slightly higher for material No. 1 thanfor material No. 2. In Table 7 some of the characteristicsof these materials are given.The performance of wound bushings impregnatedby cresol is given in Figs. 3 and 4. Thevariation of the coefficient of friction with bearingF i g . 3V a r i a t i o n o f t h e C o e f f i c i e n t o f F r i c t i o n U p o n t h eB e a r i n g P r e s s u r e a n d P e r i p h e r a l V e l o c it yF i g . 2C o e f f i c i e n t o f F r i c t i o n a s F u n c t io n o f P e r i p h e r a lV e l o c it y a t 450 a n d 1500 P si P r e s s u r ebearing material was made of resin-impregnated cotton-clothcuttings. A flow of light turbine oil varied between 0.238-0.715gpm. The amount of circulating oil showed a tendency to increasewith increasing clearance. Results of these tests indicatethat the lower the bearing clearance ratio the higher is the runningtemperature, and the lower is the value of the coefficient offriction. For this reason it is advisable to provide the bearingswith chamfered grooves,' so that a large amount of lubricantmay be admitted not only for lubricating purposes, but also formore efficient cooling. Another investigation was carried on duringwhich the performance of various bearing materials wasstudied on a specially built test machine (11). The values of thecoefficient of friction of two materials are plotted on Fig. 2 as afunction of peripheral velocity for pressures of 450 and 1500 psi.The bearing bushings were 38/s in. diam, l 6/s2 in. long, and weremachined with a 0.0028 in. per in. clearance ratio. A light oilhaving 80 Saybolt sec at 100 F and 49 Saybolt sec at 150 F wasfed into the bearing housing at 25 C and a rate of 0.26 gpm. TheTA B LE 7KindM olding MoldingM ate- of Resin, time, temp, Additionalrial resin per cent Structure min C treatm entNo. 1 Phenol 50 Cloth cuttings 45 165 10 hr at 80 CNo. 2 Phenol 45 Cloth cuttings 20 165 8 hr at 125 CF i g . 4V a r i a t i o n o f H e a t L o s s e s a n d S h a f t T e m p e r a t u r e U p o nt h e B e a r i n g P r e s s u r e a n d P e r i p h e r a l V e l o c it ypressure and peripheral velocity is given in Fig. 3, while thevariation of the heat losses and shaft temperature with pressureand velocity is given in Fig. 4.These bearing tests were made at the same conditions as thetests of bearing materials given in Table 2. From Fig. 3 it is seenthat the value of the coefficient of friction shows less variationat high loads at which it approaches some constant value. Bydiminishing the load, the values of the coefficient of friction riserapidly. In the region of maximum pressures around 6000 psi thevalues of the friction coefficient lie between 0.002 and 0.005.More heat is being removed in the oil at higher peripheral velocitiesthan at the lower, as can be seen in Fig. 4. It can also benoted that the slope of the shaft temperature is about the same asthat of the heat losses. These shaft temperatures were recordedat steady-state conditions by means of a thermometer insertedin the journal hole specially drilled for this measurement.All bearing surfaces must be well run in before optimum frictionconditions are established. This is especially true for thecase of bearings made of plastic material, where the running in
464 TRANSACTIONS OF THE A.S.M.E. JULY, 1940must be done carefully and skillfully. It is found (1) that thebest scheme for running in plastic bearings consists in loading thebearing gradually at low speeds until full load is reached and thenbringing the journal by steps to full speed. If the load be appliedtoo quickly the excessive heat generated on the sliding surfacesmight cause seizure. By frequent loading and unloading atvarious speeds the plastic bearings finally become insensitiveto pressure increase as they become better fitted to the journal.This is especially so since finish measurements of journal surfacesare now made (14, 15) and the performance of bearings can beelucidated also from this important point of view.Fig. 7 indicates that the performance of a grease-lubricatedMicarta bearing is approximately identical with that of an oillubricatedbabbitt bearing, both in the boundary region. Thesetests were made at various pressures and peripheral speeds whileusing a 2Vrin-diam bearing bushing 2 in. long. Fig. 8 showsthe results when another type of Micarta bearing materiallubricated with grease was tested at various loads and speeds.The friction properties of synthetic resin-bonded materials canbe improved by various additions. The variation of the coef-The bearing can be considered well run in when the originallylight-colored and finished areas disappear and form a lightcolored,mirror-like, uniform surface. The bearing friction andtemperature, which at the beginning were high, decrease considerablyat the end of the running-in period. This period usuallyrequires several days and can be substantially reduced by goodmachining of the sliding surfaces. Such running-in performanceis very well represented graphically in Fig. 5. A bearing withtextile laminae perpendicular to the axis, impregnated with cresol,was run in on a testing machine with forced-feed oil lubricationduring 110 hr. The bearing pressure was increased in steps of75 psi after steady-state conditions were reached. The frictiontorque and temperature increased gradually with the loadinguntil at a pressure of 370 psi they rose suddenly and the journalspeed dropped rapidly. After a few minutes, however, the torqueand temperature readings decreased and their values slowlyreached lower readings than previously recorded. By a furthersimilar loading procedure the torque and temperature rose againas may be noticed in Fig. 5. At a pressure of 800 psi the torqueand temperature reading went again off scale and the journalslowed down. After a few minutes the torque and temperaturedecreased again and rose slowly with increased load. The variationof the coefficient of friction may be seen also on the curve.An article published recently on the performance of railwaybearings (12) also points to the importance of running-in performance.This is done in connection with laminated textile materialimpregnated with cresol resin (65 per cent resin content).This running-in period is artificially accelerated by removing theupper layer of the bearing surface and polishing it by means ofa special bushing having the same diameter as the bearingjournal. As shown in Fig. 6, such bearing before the surfacelayer is removed performs with a value of the coefficient of frictionwhich is in the boundary region. At a pressure of slightlyover 400 psi the bearing seized. However, the same bearing afterthe upper bearing surface was removed and polished performedsatisfactorily at much higher loads in the region of fluid filmlubrication. These tests were carried on several bearings atperipheral velocities of 1.6 and 3.2 fps. Bearing temperatures arealso plotted in Fig. 6. Optical measurements of bearing surfacefinish were made (13) on new and worn bearings; this, it ishoped, will help in further study and improvement of the performanceof synthetic resin-bonded materials made for bearings.F i g . 6 B e a r i n g P e r f o r m a n c e o f R a i l w a y B e a r i n g s(M aterial: lam inated tex tile sheets im pregnated w ith cresol65 per cent resin.)F i g . 8 V a r i a t i o n o f t h e C o e f f i c i e n t o f F r i c t i o n W i t h P e r i p h e r a l V e l o c i t y a n d P r e s s u r e
TICHVINSKY—PROPERTIES AND PERFORMANCE OF PLASTIC BEARING MATERIALS 465ficient of friction depending upon such additions is shown in Fig.9. These experiments were made on the machine previously describedby the author (14). All bearings tested were run in fora few hours with a small amount of lubricant. Its supply wasthen shut off and the values of the coefficient of friction and ofthe temperature were recorded for different pressures. Thestandard Micarta, as can be seen, performs with a higher frictionand temperature. Additions of mica and talc decrease both thefriction and the temperature. A marked improvement is obtainedwhen hard graphite is added to Micarta; the values of thecoefficient of friction are low and so is the temperature, due to theimproved heat conductivity as mentioned previously.F i g . 9 I n f l u e n c e o f A d d i t i o n s t o S y n t h e t ic - R e s i n B e a r i n gM a t e r ia l s U p o n t h e V a l u e o f t h e C o e f f i c i e n t o f F r ic t i o nF i g . 10I n f l u e n c e o f A d d it io n s U p o n t h e W e a rThe wear properties of the same materials were also investigatedon the wear-testing machine previously described by theauthor (16). The principle of the machine is sketched in Fig. 10.The rotating test specimen A is pressed on the rotating andoscillating outside surface of a hard disk. A small jet of wateris played upon the disk for removing the heat. The loss in weightof the specimen gives a comparative measure of wear. The additionof aluminum oxide greatly improves the wear qualities ofMicarta. The rate of wear of the standard Micarta is approximatelythe same when hard graphite and mica are added to it.The foregoing data and several performance examples, it ishoped, will assist a designer in his work when selecting andspecifying synthetic resin-bonded bearings. Being made of acomparatively new material, the plastic bearings now find moreand more application. The continuous development of the materialitself and studies of its performance which are carried on bya combined force of chemists, physicists, and engineers will resultundoubtedly in many more improvements and in wider application.A c k n o w l e d g m e n tThe writer thanks the Westinghouse Electric and ManufacturingCo. for permission to publish this paper. All the data of experimentsperformed by the author were made with the assistance ofE. G. Fischer, of the Westinghouse Research Laboratories, andC. Jahing, graduate student.B IB L IO G R A PH Y1 “ Werkstoffe fiir Gleitlager,” by A. Thum and R. Strohauer,R. Kiihnel, Julius Springer, Berlin, 1939, pp. 119-171.2 “ Properties a n d P e rfo rm a n c e of Bearing M a te ria ls BondedW ith S y n th e tic R e s in ,” b y G . R . E y s s e n , in " G e n e ra l D iscu ssio n onLubrication a n d Lubricants,” T h e Institution of M ech a n ic al Engineers, London, O c to b er, 1937. A m e ric a n edition published b y T h eA m e r ic a n S o c ie ty o f M e c h a n i c a l E n g i n e e r s , N e w Y o rk , v ol. 1,1938, group 1, pp. 84-92.3 “ ‘Filled’ Resins and Aircraft C onstruction,” by G. de H avilland,Journal of the Aeronautical Sciences, Aug., 1936; ModernPlastics, March, 1937.4 “ Synthetic Resins in Aircraft Construction— Their Composition,Properties, Present State of D evelopm ent and Application toLight Structures,” by K . Riechers, National Advisory Com m ittee forAeronautics, Technical Memorandum N o. 841, Novem ber, 1937.5 “ Fabric Bearings for Rolling M ills,” by H . Rochester, in“ General Discussion on Lubrication and Lubricants,” I.M .E .,London, October, 1937. American edition published by A .S.M .E.,N ew York, vol. 1, 1938, group 1, pp. 260-265.6 “ Some Applications of Fabric Bearings,” by W atson E.Sm yth, in “General Discussion on Lubrication and Lubricants,”I.M .E ., London, October, 1937. American edition published byA .S.M .E ., N ew York, vol. 1, 1938, group 1, pp. 277-284.7 “ H eavy-D uty Bearings of Phenolic Plastics,” by H . M.Richardson, in “General Discussion on Lubrication and Lubricants,”I.M .E ., London, October, 1937. American edition published byA .S.M .E ., N ew York, vol. 1, 1938, group 1, pp. 249-259.8 “W arm eleitfahigkeit von K unstharzen,” by S. Erk, KunstundPressstoffe, 1, V .D .I. Verlag, 1937, pp. 37-38.9 “ Physical Properties of Surfaces, III. The Surface Tem perature of Sliding M etals, the Temperature of Lubricated Surfaces,”by F. P. Bowden and K. E . W . Riddler, Proceedings of the RoyalSociety of London, series A, vol. 154, M ay 1, 1936, p. 640.10 “Versuche an Lagern m it K unstharzbuchsen,” by E . Heidebroek,Kunststoffe, vol. 27, O ct., 1937, pp. 263-267.11 “Versuche m it Pressstofflagern,” by E . Lehr, Kunststoffe,vol. 28, July, 1938, pp. 161-170.12 “ Kunstharzlager fiir Schienenfahrzeuge,” by H . M akelt,Kunststoffe, vol. 29, M ay, 1939, p. 143.13 “ Optische Oberflachenpriifung von K unststoffen,” by H.Klingelhoffer and H . Muller, Kunststoffe, vol. 29, Jan., 1939, p. 14.14 “Boundary Friction in Bearings at Low Loads,” by L. M.Tichvinsky and E. G. Fischer, Journal of A pplied Mechanics, Trans.A .S.M .E ., vol. 61, 1939, p. A-109.15 “ L'6tat de Surface des pieces M 6caniques,” by P. Nicolau,University de Lille, 1939, Reprint from Genie Civil, February 18—25,1939.16 “Wear in Lubrication Problem s,” by L. M. Tichvinsky,Trans. A .S.M .E., vol. 61, no. 4, M ay, 1939, p. 335.DiscussionCarl Claus.4 The author mentions that appreciation ofplastic bearing materials is not caused by lack of basic bearingmaterials but by advantages in certain applications. Theseseem to be confined to installations where it is possible to carry offfrictional heat by water or oil which act as coolants and lubricants.There is little objection to this method in rolling mills where operatorshave long been accustomed to these conditions.The author states that bearings made from graphitic moldingpowders show a better heat conductivity, but that they are ex-4 Research Engineer, Bound Brook Oil-Less Bearing Company,Bound Brook, N . J.
466 TRANSACTIONS OF THE A.S.M.E. JULY, 1940tremely brittle. A familiar bearing used for several decades consistsof a metal shell with graphite inserts. This combination ofthe conventional metallic-sleeve bearing with the plastic graphitedissipates the heat satisfactorily without a cooling liquid. Themetallic structure gives proper support to the graphite. A wellknownapplication is the trolley bushing of streetcars for whichno better bushing has as yet been found. The constant jars ofthe trolley pole do not loosen a well-bonded plastic graphite inthis and other applications.Another bearing somewhat related to plastic bearings is theporous-metal bearing. It is manufactured by the cold pressingof metal powders. Instead of using a resinous binder it is sinteredand obtains a strength and ductility not approached by theresin-bonded bearing. Its heat conductivity is excellent and itsporosity is used for storing lubricant in its structure.By using hard graphite in the author’s tests with Micarta a“marked improvement” was found in reducing the coefficient offriction and the operating temperature. It would be interestingif the terms “hard graphite” and “soft graphite” were explained,as well as the effect of the different kinds of graphite. Fig. 10 ofthe paper shows more wear for soft graphite than it does for hardgraphite.The condition of the shaft before and after the test is also ofinterest. Graphite has a tendency to fill up depressions of theshaft surface and make it smoother. Unless a pure graphite isused it may also act as a polishing agent which will rub off highspots.Aluminum oxide is reported to have improved the wear qualitiesof Micarta in a test shown in the testing machine, Fig. 10.This material is an abrasive which may have smoothed thecontacting surfaces. It was apparently firmly imbedded in themolded test specimen and may have acted as a lapping compound,which wears down the shaft or disk rather than beingworn down by them.An interesting observation can occasionally be made on oilimpregnatedwooden bearings which may wear down a steel shaftwhen abrasive dust embeds itself into the wood. As a result ofsuch a condition the soft-wood bearing shows no wear but theshaft does.In conducting the tests the author has found it necessary torun in the bearing surfaces carefully for hours. The designing engineerquite naturally wonders what may happen to a bearingwhich he specifies and which will assuredly not receive such tendercare. Since two bearings are mostly used to support a shaft,the question of misalignment will also have to be considered.Misalignment can easily result in failure at the start when excessivepressure prevails over a small area.The difficulty with testing machines for bearings seems to bethat they do not duplicate operating conditions. Results obtainedfrom them cannot be applied to cases which vary fromthose of the individual testing machine itself. In the ideal sleevebearing the load is supposed to be carried by an oil film, and awearing down of bearing material and shaft should be impossiblewithout contact between them.As a result of the limitations of the bearing testing machines,most engineers reluctantly turn to comparative tests of bearingmaterials in commercial applications such as electric motors, automobileengines and their accessories, etc.Performance tests under operating conditions rather than acceleratedbreakdown tests give us the only reliable answers to ourbearing problems. Even then results are greatly influenced bynumerous conditions outside of the bearing material itself.The hardness and finish of the shaft, the degree of misalignment,and particularly the lubricant between the shaft and the bearingare often of even greater importance than the bearing materialitself.H . A. E v e r e t t .6 It is an axiom in research work that whereverpossible the actual points for observed data be shown whencurves are presented. The author has been meticulous in this respectin all of the illustrations in his paper except Fig. 2. Willhe be kind enough to let us have the observed data points for thatfigure, as there seems to be a surprising and gregarious change inthe coefficient of friction with increasing speed.E . F. H e e r .6 Limited investigations have been conducted onthe graphites used in bearings. While experience thus far hasnot been sufficiently comprehensive to arrive at definite conclusions,the fact is definitely indicated that for each class of bearingthere probably is at least one type out of the several varieties ofgraphite which is superior to others.Following the author’s division of the subject we shall first discussbearings made from various plain or graphitic molding powders.Since it is the purpose of the graphite to supply a lubricationfactor, it is important to have a complete distribution of thegraphite throughout the molding powder in the ratio desired inorder to supply a constant coefficient of friction. At the sametime, it is equally important to make sure that the structuralstrength of the bearing is not weakened. This immediatelybrings up the consideration of—What effect, if any, does the particlesize of the graphite have on the performance of the bearingin service and does the particle size influence the internal strengthof the bearing? Further consideration must also be given thequestion as to whether or not the particle size of the graphite influencesthe molding characteristics of the bearing. What effectdoes loading have on the finished product?It is conceivable that the internal strength of a plastic will beaffected by the relation of binder to inert material. If such is thecase, the embrittlement mentioned by the author may be attributedto overloading with graphite or other inerts (by inerts ismeant any nonplastic ingredient).It would seem to be equally important to study the performanceof bearings formed from resin in which dry flake graphitehas been used as opposed to bearings formed from resins whichhave been treated with colloidal graphite in either an aqueous ororganic carrier.As mentioned, some experience along these lines has alreadybeen had, sufficient to indicate that there is a relation betweenthe particle size of the molding powder and the particle size of thegraphite to be used, if admixture of the graphite and resultingfriction properties are to be constant.A study of the particle size of the molding powder examinedunder a low-power microscope indicated that the small particlesare rod-like crystals about 20 mu in diam and from 80 to 100 muin length. These are held together in agglomerates with a bindermaking up particles which range in size up to Vs in. diam. It isthe writer’s opinion that, with molding-powder particles of thisnature, it is almost imperative to have the graphite particles ofsuitable size to maintain proportionate distribution of graphite toproduce a homogeneous finished product. If large particles ofdry powdered graphite surround the finer particles of moldingpowder, the proportion of graphite to molding powder will probablybe greater than is desired and a weakness in structuralstrength would probably result. On the other hand, if the largestof the particles of molding powder are to bear their complementof graphite in the form of a coating, it becomes necessary to use aform of graphite other than a dry powder, for obviously it is mostdifficult to maintain the proper proportion of dry powdered graph-6 H ead of D epartm ent of M echanical Engineering, The PennsylvaniaState College, School of Engineering, State College, Pa. M em .A .S.M .E .8 Sales Research D epartm ent, Acheson Colloids Corporation, PortHuron, M ich.
TICHVINSKY—PROPERTIES AND PERFORMANCE OF PLASTIC BEARING MATERIALS 467ite adjacent to and in contact with these large particles of moldingpowder. Experience thus far has indicated that graphite,the range of particle size of which lies well below the ordinaryfine-mesh powders, when dispersed in a suitable organic fluid,will give much better distribution of the graphite throughout themass of molding powder and will enable the graphite to be attachedto all resin particles regardless of size of the latter. Theorganic solvent can be disposed of by evaporation which leavesthe molding powder in discrete particles not cemented togetherbut at the same time properly coated with graphite.With respect to the second and third types of bearings mentionedby the author, namely, the laminated type, we would againsubmit for consideration the selection of the graphite to be usedfor impregnating the textiles and the methods which should beadopted. A study should be made of the effect of overloading thetextile fabrics with graphite as well as a study of impregnatingthe fabrics with a colloidal dispersion of graphite as comparedwith fabric which has been treated with powdered graphite.These studies, of course, would not be complete without a furtherstudy concerning the variations produced by treating the fabricswith aqueous and organic liquid dispersions of graphite.Much that has been said with respect to molding powders ofcourse applies to impregnating fabrics, inasmuch as particle sizeis of prime importance; also distribution of the graphite throughoutthe fabric to supply properties which will be constant. Indealing with fabrics, as is the case with molding powders, thewetting properties of the graphite dispersions are also of greatimportance. Some experience has already been had in connectionwith fabrics. It has been found that dispersions of graphitein aqueous as well as organic liquid dispersions are quite useful.Furthermore, a selection of particle size is important becausethere must be the proper relation between the particle size andthe fibers used in the fabric, also the coarseness of the mesh of thewoven fabric. The limited experience thus far indicates that,among the methods which can be used to impregnate the textileswith graphite, the one which appears to hold greatest promiseis the immersion of the fabric in a dispersion of graphite in wateror suitable organic solvent. The content can be closely controlledby using colloidal dispersions of graphite in these fluidsfor submerging the fabric for a given length of time. The graphitecontent together with the time involved in keeping the fabricsubmerged contributes to a homogeneous result and the proportionof graphite to the fabric can thereby be controlled and, ofcourse, varied according to requirements.From the paper it may be concluded that the initial run-in periodis a predominating factor in the life of the bearing. If thatis the case, it is apparent that a study should be made of the behaviorof such bearings where water is used as the lubricant.Such study should determine the effect or what can be accomplishedby introducing an aqueous lubricant, consisting of a colloidalgraphite dispersed in water, into a circulating system fordelivery to the bearing during this rmvin period. This technique,in the opinion of the writer, should be valuable particularlyin locations where the water used to lubricate the bearing is veryhigh in mineral content.In conclusion the writer should like to emphasize by repeatingthat experience thus far definitely points to the desirability ofusing graphite of fine particle size dispersed in suitable fluid carriersin order to produce homogeneous distribution of graphitethroughout the bearings, thereby giving the bearings constantfriction properties.W. T h i n k s . 7 The writer has often wondered why compositionbearings are called “plastics,” when they are as hard andbrittle as a piece of coal. Even less success has attended the determinationof the origin of the word “Micarta.” It seems to indicatethat the bearing material contains, or at some time did contain,mica. Can the author supply any information on thesequestions?A great deal of information is given in the paper on strength ofMicarta in different directions. This brings to mind the question:Why is Micarta made in layers? The writer is familiar with atleast one material in which the shredded cotton fibers are mixedwith the uncured phenolformaldehyde and the mass cured as asolid block. If the block of composition is not sufficiently strong,a steel framework is placed in the raw composition and is cookedwith it. This design has been successful not only for bearingsbut also for slippers of universal joints in rolling mills. Theseslippers act, in a way, like bearings.A u t h o r ’s C l o s u r eRegarding Mr. Claus’s remarks, it was indicated in the paperthat it is necessary to differentiate between plastic materials ofthe first and the other two types. The materials of the firsttype are made from various plain or graphitic molding powders,while the second and third types are obtained by molding laminatedtextiles and felt fillers. By virtue of their different internalstructures, finished products made according to the three typesmentioned have different physical properties, as shown in thepaper. Material of type one might be brittle, but laminatedbearings are very strong and tough. They are not brittle, andhave high bond strength.Hard and soft graphite Micarta simply designates the way inwhich graphite is put into the material. In the case of hardMicarta, the graphite is put on the cloth before the resin is applied,while in the case of soft graphite the graphite is put intothe resin.Mr. Heer’s discussion is interesting since it indicates a few finepoints pertaining to the properties of graphite. The amount of325-mesh lubricating graphite powder used was evenly distributedin the cloth in such a quantity as not to decrease the bondstrength.Professor Everett correctly indicated the surprising change inthe coefficient of friction at increasing speed as shown in Fig. 2of the paper, taken without alterations from Mr. Lehr’s paper.As far as the writer was able to find a correct answer to ProfessorTrinks’s question, the name “Micarta” (a trade name, usedfor laminated products only) derives its name from mica, whichhas a laminar structure and high dielectric strength, and whichwas originally added in a small quantity to Micarta.7 Professor of M echanical Engineering, Carnegie In stitu te of Technology,Pittsburgh, Pa. M em. A .S.M .E .
N eoprene as a Spring M aterialB y F E L IX L. Y E R Z L E Y ,1 W IL M IN G T O N , DEL.In th is p ap er th e m e c h a n ic a l p roperties o f n eopren e-which are im p o r ta n t fo r v ib ra tio n is o la tio n a n d d a m p in gare evalu a ted a n d co m p a red w ith th e a n a lo g o u s p ropertieso f rubber. S ta tic a n d d y n a m ic m o d u li a n d d a m p in g a c tio n are sp ecifically tr e a te d .ID V A N C ES in engineering design proceed from the develop-/ - \ ment of new materials, from increasing knowledge ofavailable materials, and from the exercise of imaginationin the creation of new applications. It must be evident thatevery increase in the variety of available materials diminishes thenumber of restrictions on mechanical invention. It must alsobe true that, as the variety of physical characteristics available indifferent materials increases, fewer compromises are necessarywith imperfectly suited materials. Neoprene has taken its placeat the side of rubber as an elastic material for springs. As anaddition to the variety of materials available to engineers it hasalready increased the variety of structures that can be made fromthem.T h e F i e l d f o r N e o p r e n e S p r i n g sThere can be no question of the superiority of metallic springsover those made of the rubber-like materials (l),2 including rubberfor certain applications, and there can be no doubt of the superiorityof rubber-like materials in other cases. One needs only tosurvey the present applications of rubber-like materials in automobilesto verify the latter statement. Many improvements inriding comfort and performance became possible only as theavailability and characteristics of rubber were appreciated.Further affirming evidence of the unique advantages of rubbermay readily be found in the literature (2, 3) and in the prevailingtrend toward further uses of rubber.Analysis of spring applications reveals at least five outstandingreasons for the use of rubber springs. These are:1 To reduce noise. The function of rubber in this respect isto avoid transmission of audiofrequencies through metallicsupports (4, 5). It is interesting to note, however, that othersteps mu§t sometimes be taken simultaneously to eliminatesounds which are air-borne.2 To impart flexibility. In addition to the technically moreinteresting applications, involving periodic vibrations which aresubject to more or less precise mathematical treatment, there arenumerous applications arising from the need for a mild cushioningeffect, for example, as supplied by the numerous rubber padsand cushions used in automobile bodies (6). These provide theautomobile structure with a necessary degree of over-all flexibilityand elastic yield in an economical and simple way.3 To reduce production cost. The trend in modern machineproduction is toward lighter construction and higher speeds.In general, this means also that precision in manufacture must be1 Physicist, Rubber Chemical Division, E. I. du P ont de Nemours& Company, Inc. Mem. A .S.M .E.2 Numbers in parentheses refer to the Bibliography at the end ofthe paper.Contributed by the Rubber and Plastics Subdivision of the ProcessIndustries D ivision and presented at the Annual M eeting, Philadelphia,Pa., December 4 -8 , 1939, of T h e A m e r i c a n S o c i e t y o fM e c h a n i c a l E n g i n e e r s .N o t e : S ta te m e n ts a n d o p in io n s a d v a n c e d in p a p e rs a re to b eu n d e rs to o d as in d iv id u a l ex p ressio n s of th e ir a u th o rs , a n d n o t th o seof th e S o ciety .increased, usually at an increase in the cost of machining operations.Rubber in compression will conform readily to irregularsurfaces and can, in some cases, be employed to eliminate amachining operation as well as maintenance expense. This isillustrated in Fig. 1. A self-aligning bearing is made by replacinga lubricated ball-and-socket construction with a less expensiveassembly involving a rubber-like material. A spherically formedband of neoprene between the bearing and the block not only providesthe necessary self-aligning feature, but does so with an appreciablesaving in cost.4 To reduce maintenance costs. Rubber springs frequentlyeliminate guides and other points of metal-to-metal contact, andthereby reduce maintenance costs (7).5 To obtain definite damping action. When damping actionis required with metallic springs, auxiliary frictional equipment isusually required. Leaf springs provide damping, but the extentof the damping action varies with the lubrication between theleaves and is not subject to practical control. The dampingaction of a rubber compound is definite and reasonably constantand is obtained without mechanical wear and without need of attention.The foregoing considerations apply generally, but in varyingdegrees, to all of the rubber-like materials. In addition, the followingdistinctive advantages of neoprene over rubber arecharacteristic:1 Relative immunity from deterioration in petroleum products.All petroleum solvents cause disintegration of rubber. AlthoughF i g . 1A S e l f -A l i g n i n g B e a r i n g C o n s t r u c t e d W i t h N e o p r e n eC u s h i o nthe rate of deterioration is dependent upon the nature of the petroleumproduct, the end results are similar. Penetration intothe rubber first causes softening and swelling, followed by gradualloss of strength and eventual failure. Neoprene differs fromnatural rubber, first, by showing much greater resistance to thepenetration of petroleum products and, second, by retaining itsoriginal physical properties to a much greater extent (8, 9).2 Greater chemical stability at high temperatures. Rubberand neoprene, which are organic materials, cannot be exposed tothe moderately high temperatures at which metallic springs frequentlyoperate without undergoing chemical changes. Thechanges of rubber and neoprene on continued exposure to hightemperatures are quite different. Continuous exposure to elevatedtemperatures of the best modern heat-resisting rubber compositions,which have low sulphur content, tends to cause reversion.Reverted rubber compositions are characterized by loss ofresilience, elastic modulus, and tensile strength. Neoprene compositionsdo not revert at high temperatures, but gradually becomeharder with increased modulus and with relatively slow
470 TRANSACTIONS OF THE A.S.M.E. JULY, 1940loss of tensile strength. The residual plastic effect, drift, of thevulcanizate is decreased by continued heating, and the modulusincreases rather than decreases.3 Resistance to the action of sunlight and ozone. Sunlightand ozone are grouped together because formation of ozone at thesurface of rubber in sunlight is considered the prime cause of thesurface deterioration which occurs (10). In many industrialsituations, the presence of ozone precludes the use of rubber.Neoprene, on the other hand, is used extensively as a jacketingmaterial for high-voltage cables, where ozone is generated bycorona discharge. It is also used in direct sunlight, where rubberdoes not possess the necessary degree of permanence.4 Greater damping action. The hysteresis loss and hence thedamping action of both rubber and neoprene may be varied considerablyby compounding. In general, however, hysteresis loss,with stocks that are also practical in other respects, is greater forneoprene than for rubber. The thermal conductivity of neopreneis also higher than that of rubber and permits more rapid dissipationof heat.The foregoing statements relate to the preliminary selection ofa spring material. It is equally important to have definite knowledgeof the various moduli of elasticity in order to determine thesize and shape of the required spring. For that reason the balanceof the paper will deal almost exclusively with the elastic propertiesof neoprene.The author has recently described a compact mechanicaloscillograph (11), Fig. 2, particularly for the evaluation of rubberasshown for a rubber and a neoprene compound in Fig. 4. It willbe observed, as Haushalter (12) has said, that the curves areapproximately straight up to 20 per cent compression but thatfor greater deformations there is pronounced curvature. Theslopes of the dotted lines, shown in Fig. 4, represent the dynamicmoduli and were calculated from the dynamic tests under averageloads of 120 and 100 lb per sq in. for the neoprene and rubbercompounds, respectively. The crosses shown on the dotted linesindicate the points of equilibrium reached at the end of the dynamictest. The difference between the slopes of these lines andthe tangents to the static load-compression curve illustrates thedifference between the dynamic and static moduli.It will be noted in Fig. 4, that the general shape of the curvesfor rubber and neoprene is the same. The neoprene loop isslightly wider, however, indicating greater hysteresis loss ordamping action. The increase in modulus of neoprene in thedynamic test is greater than that of rubber. These differencesare characteristic of the two materials today. Subsequentchemical developments may change this comparison.E l a s t ic P r o p e r t i e s o f N e o p r e n eF i g . 2 T h e O s c il l o g r a p h ; O s c i l l a t in g B a r a n d L o a d in g P l a t f o r m A r e M o u n t e d o n K n i f e - E d g e s(M achine is show n in sta tic equilibrium position w ith test piece undercom pression.)like materials in compression, both statically and dynamically.This apparatus has been used for the tests reported herein.Small cylindrical test pieces nominally 3A in. diam X 'A in. highare used. For static-load-compression relationships, deflectionsunder various dead loads up to 280 lb per sq in. are recorded.For dynamic characteristics, the bar is allowed to oscillate at itsnatural frequency of vibration under the combined action ofgravity and the elastic force of the test piece. The dynamicmodulus is then calculated from the frequency and the inertia ofthe bar by means of the equation, K = 210 If1. Test frequenciesare usually of the order of 2 to 5 cycles per sec. Data are recordedautographically. A typical oscillogram from this seriesof tests is shown in Fig. 3.It is well known that rubber and neoprene do not show the samestiffness on the first cycle of loading and unloading as they do onsuccessive cycles. Each of the test pieces was subjected to severalconditioning cycles of loading and unloading under an averageload of 280 lb per sq in. Static-load-compression data werethen obtained, followed by further conditioning and a dynamictest under the average load corresponding to approximately 30per cent compression. Data obtained in this way were plottedFor the purposes of this paper, it is considered satisfactory toapply the term “compression modulus” to the slope at any pointof the load-compression curve. It will be noted, however, thatthe values of the static modulus are obtained as slopes on theloading branch of the hysteresis loop. Although this is an arbitraryprocedure, it appears to be common practice. For certainproblems, the slope at points of the unloading curve might bemore important. In other cases, an over-all average for successivecycles of loading and unloading is a more important value.Indeed the dynamic modulus reported in this paper is such avalue.During the last few years, correlations have been developedbetween the elastic moduli of rubber and values of the Shoredurometer type A hardness. These correlations, though onlyapproximate, provide a convenient way of determining the elasticmoduli near zero load without resort to more extensive and some-
YERZLEY—NEOPRENE AS A SPRING MATERIAL 471times expensive tests.3 Conversely it provides the convenientmethod of specifying moduli by stating the hardness desired,particularly for springs in small quantities. The author intendsin the following discussion to establish a similar relationship forneoprene with the hope, however, that some evaluation more precisethan hardness data may win preference in the future.different instruments will lead to different evaluations. In thesecond place, rubber technologists will readily agree that, unlessoperators are schooled with extreme care, different operators willobtain quite different durometer readings on the same compoundand with the same durometer. In the third place, onecannot expect the same correlation between shear modulus anddurometer readings for all types of rubber compositions. In appreciationof the fine work that has been done in establishingthis correlation, expressed by Haushalter (12) and others, thiscriticism is offered only as constructive caution.To remove doubt regarding the calibration of the durometeremployed in this work, durometer readings were correlated withforce in grams on the pin. These data are given in Fig. 5. Thedimensions of the pin are also shown. Other dimensions areassumed to be standard. To eliminate the personal element asfar as possible a stand, Fig. 6, was built. The instrument andF i g . 5C a l ib r a t i o n o f D u r o m e t e r U s e d i n T e s t sF i g . 7 L o a d - C o m p r e s s i o n D a t a f o r G r o u p o f N e o p r e n e T y p e -GV ULCANIZ ATESF i g . 8L o a d - C o m p r e s s i o n D a t a f o r G r o u p o f R u b b e rV ULCANIZ ATESF i g . 6S p e c i a l D u r o m e t e r S t a n dThere are three apparent reasons for unavoidable errors incorrelations between durometer hardness and moduli. In thefirst place, the calibration of the durometer has not been adequatelystandardized by the manufacturer. As a consequence,8 The oscillograph is intended to provide a direct and inexpensivetest for compression moduli and will soon be adapted to direct testsin shear.the sliding rod together weigh 2 lb which then becomes the totalactuating force (13).In Fig. 7 are shown load-compression data of a group of neoprenetype G compounds having different hardness numbersand, in Fig. 8, a similar group of rubber compounds. It is notfeasible to present extensive data in curve form; condensationfor the purposes of this paper as well as for practical use is required.Data for neoprene and rubber compounds in compression aregiven in Table 1. It will be noted in the table that the staticmodulus at zero load is in most cases considerably lower than thestatic modulus under the load used for the dynamic test. Asstated previously, the compression curve for rubber, up to 20per cent, is practically a straight line. This is convenient, since
472 TRANSACTIONS OF THE A.S.M.E. JULY, 1940it may be used in many cases to simplify calculations appreciably.It is true, however, that as a general rule the tangent to theload-compression curve at zero deformation is lower than thetangent at 20 per cent compression. This trend continues and,at 30 per cent compression, a still greater slope exists. Thevalues given in Table 1 for the compression modulus at zero loadare the closest values that could be obtained graphically, disregardingany irregular curvatures that were shown by the datafor small deformations. In some cases, they correspond to theconstant slope of the curve up to 10 per cent compression and,in other cases, they correspond more closely to the particularslope at 10 per cent compression. It will be recognized that errorsin obtaining a load-deformation curve for rubber may readilyoccur at zero because of the difficulty sometimes experienced indetermining the zero deformation. This is particularly true ofsoft stocks which may undergo appreciable deformations withvery light loads and it is also true for compositions which haveexcessive creep or pronounced damping characteristics.The dynamic tests reported were conducted at 30 per centaverage compression, which in terms of usual practice is somewhatabnormal. Various tests conducted by the author haveindicated that the relation between static and dynamic moduliis practically independent of the load up to 30 per cent compression.It is also independent of the frequency obtainable by thistechnique as indicated by the uniformity of the ratio obtained attwo frequencies for compounds 302N-40, -41, and -42 in Table 1.It has frequently been claimed that rubber is considerablystiffer dynamically than it is in static loading. Circulation haseven been given to the statement that the dynamic modulus ofrubber is 2 or 3 times greater than the static modulus. As theresult of his recent work, Kosten (14) has concluded that theratio of the dynamic modulus to the static modulus lies, as arule, between 1 and 2 and that the ratio is independent of frequency.The present work, employing a different technique ofmeasurement and a somewhat different frequency range, confirmsthese conclusions drawn by Kosten. Naunton and Waring (15)on the other hand, have found in tests up to 60,000 cycles per minthat the increase in modulus is proportional to frequency. Theyconfirm the finding, however, that the ratio of dynamic to staticmodulus is between 1 and 2.The ratio of the dynamic modulus to the static modulus inTable 1 is given in the eighth column and it will be seen that theseare in the range 1.04 to 1.75. In the next to the last column,the resilience in per cent, or in other words the elastic efficiencyof the compound, is given. These data were calculated fromthe dynamic records by obtaining the ratio of successive heightsof rebound on the oscillograph. If resilience is plotted againstthe ratio of dynamic modulus to static modulus, as in Fig. 9, itwill be noted that there is an increase in the ratio as the resilienceof the compounds decreases. It should also be kept in mind,however, that the compounds given in this paper are of a commercialgrade and that many complicated factors involved in thestate of cure and physical composition have been introducedother than the obvious change in resilience.Assuming that, under operating conditions likely to be encountered,the dynamic modulus can be as much as 2 timesF i g . 9.Re s i l i e n c e P l o t t e d A g a i n s t R a t i o o p D y n a m ic M o d u l u st o S t a t ic M o d u l u s(T h e dash lin e is draw n to em phasize th e m ajor trend.)greater than the static modulus at a given load, one might naturallyinquire as to the importance of the change. According tothe usual theories of vibration, the frequency at resonance is givenby the equation, / = constant spring constant. In other words,a doubling of the modulus of rubber or neoprene will cause a 41per cent increase in resonant frequency. This is not a negligiblefactor, but as this work and that of Kosten (14) indicate, a doublingof the modulus is not apt to occur. The actual change in
YERZLEY—NEOPRENE AS A SPRING MATERIAL 473resonant frequency will be moderate and in most cases negligible.This is especially true, in view of the usual design practice of allowinga factor of 3 or 4, if possible, between the natural frequencyof the supports and the probable frequency of impressed forces.In his useful summary of the theory of vibration, Rosenzweig(16) has presented a discussion of the importance of damping atresonance. When critical speeds are encountered, some dampingaction or restraining force is absolutely essential. The data inthe next to the last column of Table 1 give values for the resilienceof the compounds. For the neoprene compounds selected, resilienceranges from 42 to 80 per cent and the corresponding energyabsorption would consequently range from 58 to 20 per cent.The values for rubber are different, ranging from 66 to 92 percent for resilience and from 34 to 8 per cent for energy absorptionin a given cycle of loading and unloading. The art of compoundinghas not yet progressed to the point where resilience can bevaried independently from all other properties, but there are waysof varying the resilience in a limited range for a given modulus.In Fig. 10 durometer hardness is plotted against compressionmodulus at zero load as taken from Table 1. Other data of thissame form have been published by Haushalter and are shown bythe dotted line. This illustration confirms the relationshipfound by Haushalter (12) between compression modulus anddurometer hardness as closely as one might expect. It will benoted, however, that there are points which do not lie on thecurve.Haushalter (12) and Kosten (14) both have emphasized theimportance of the ratio between the height of a cylindrical testpiece and its diameter. Haushalter has indicated that, if the ratiois approximately 1:1, the compression modulus is 6.5 times theshear modulus. In the present case, the ratio of the height tothe diameter is 0.67. Consequently, it is of interest to determinehow nearly the test pieces '/2in. high and */< in. diam approach thecharacteristics of test pieces fulfilling the ratio requirement.Fig. 11 shows the changes caused in the load-compression curveby changes in the height of the cylinder from 0.135 in. to 0.995in., i.e., by varying the ratio from 0.18 to 1.33. It can be seenthat the difference in compression between the 0.502-in. and 0.995-in. cylinders is considerably less than 10 per cent of the percentageof compression at all loads.In Fig. 12, the diameter of the cylinder is varied from 0.433 in.to 0.950 in., i.e., varying the ratio from 1.15 to 0.53. The discrepancybetween the curves for the 0.742-in. and 0.433-in.cylinders is less than 10 per cent of the percentage of compression.If the ratio of 6.5 :1 is valid for rubber, one might reasonably expectapproximately the same ratio to apply for neoprene. Smith,on the other hand, has found the theoretically derived ratio of 3 :1(17) between compression modulus and shear modulus to beuseful. Although the discrepancy between 6.5 and 3 appearsoffhand to be disturbingly large, further investigation will probablyunify the methods of treatment and contribute better understanding.The measurements in shear so far made by the authorhave been limited and inadequate to establish a clear relationshipbetween the shear and compression moduli. It is knownfrom several comparisons, however, that the shear modulus ofneoprene can be varied over the same range as that of rubber; forexample, for practical purposes from 50 to 350 lb per sq in.Whenever damping action is important, due to the unavoidableoccurrence of critical speeds, it will be recognized that mountingswill be called upon to absorb substantial quantities of energy.The direct result of this absorption of energy will be an increasein the temperature of the mounting. The specific heat of uncompoundedand unvulcanized neoprene is 0.52 cal per g and itsthermal conductivity 0.00046 cal per sec per cu cm per deg C.Vulcanization seems to have little, if any, effect on the thermalproperties of neoprene, although loading ingredients will alter ther-F i g . 10D u r o m e t e r A H a r d n e s s P l o t t e d A g a i n s t S l o p e o fL o a d - C o m p r e s s i o n C u r v e a t Z e r o L o a d(T he average obtained b y H au sh alter for sim ilar d ata is show n b y thedash line.)F i g . 11F i g . 1 2E f f e c t o n L o a d - C o m p r e s s i o n C u r v e o f T e s t C y l i n d e r s3/ i I n . D ia m , C a u s e d b y V a r y i n g H e i g h tE f f e c t o n L o a d - C o m p r e s s i o n C u r v e o f T e s t C y l i n d e r sV 2 I n . H i g h , C a u s e d b y V a r y i n g D i a m e t e rmal values of vulcanizates in amounts proportional to the volumecontent and properties of the added ingredients. Since thespecific gravity of neoprene compounds is relatively low, beingas a rule between 1 and 2, the thermal capacity of neoprene onthe volume basis is low. The temperature rise on absorption ofenergy is, therefore, rapid. In comparison with rubber, however,the thermal conductivity is about 30 per cent higher. Neopreneis, therefore, a better damping material than rubber from thestandpoint of its damping action, its chemical stability when
474 TRANSACTIONS OF THE A.S.M.E. JULY, 1940heated, and its higher thermal conductivity, permitting morerapid dissipation of heat.It has been shown that the elastic characteristics of neoprenein which design engineers are interested are similar to those ofrubber. Greater damping action and a somewhat higher valuefor the ratio of dynamic to static moduli are, however, characteristic.The similarity permits the design and application of neoprenesprings by the same methods developed for rubber bymany investigators (2, 3, 7, 12, 16, 17).E l e c t r ic a l P r o p e r t ie s o f N e o p r e n eAlthough not related to the main subject of this paper, briefmention of the electrical properties of neoprene is warranted bythe occasional demand for combined electrical and mechanicalservice. The values given in Table 2 are roughly representativeof neoprene compounds which contain no fillers and only enoughadded ingredients to insure proper vulcanization.T A B L E 2E L E C T R IC A L P R O P E R T IE S O F N E O P R E N E A T 28 CD -o resistiv ity ...........................................................................................1 X 101!ohm -cmD ielectric con stant at 1000 cycles per sec.............................. .... 7 .5P ow er factor at 1000 cycles per s e c ............................................... 3 .0 per centD ielectric stren gth , rm s at 60 cycles per s e c ........................ .....800 v per m ilIndividual compositions will, of course, have different electricalproperties. The d-c resistivity, the dielectric constant, and thepower factor can be improved somewhat over the figures given inTable 2 by compounding. Compositions containing high proportionsof carbon black have lower values of d-c resistivity and dielectricstrength than those given in Table 2, and higher valuesof the dielectric constant and power factor.A d h e s io n o f N e o p r e n e t o M e t a lNeoprene compounds can be adhered firmly to brass and brassplatedmetals by vulcanization in direct contact with the brasssurface. Other commercial methods employ cements to obtainequally strong adhesion. Bond strengths above 1300 lb per sqin. in tension have been obtained under the most favorable conditions.P e r f o r m a n c eUnder normal operating conditions, the permanence of neoprenemountings is of a high order. They are not damaged bymillions of cycles of loading and unloading and they resist deteriorationfrom oils, chemicals, heat, sunlight, and oxidation. Abnormalconditions may be encountered, however, if mountingsare installed or operated incorrectly so that excessive temperaturerise occurs in the neoprene as the result of overstressing or excessivefrequency of operation. Although no general statement willapply to all conditions, a temperature of 65 C is a reasonablemaximum. If operation at higher temperatures is unavoidable,a commensurate reduction should be made in the unit load on themounting to compensate for loss in spring strength resulting fromthe abnormal temperature condition.The functional purpose of neoprene mountings is to isolate anddampen vibrations. The structural requirement is that themounting shall safely support a given load. If the mounting isoperated continuously at excessively elevated temperatures, itis inevitable that the modulus of the composition will graduallyincrease. The effect of this change will be to alter the characteristicsof the mounting, as a vibration isolator, without impairingthe ability of the mounting to carry the required load. Hence,although the functional purpose of the mounting may be impaired,the structural safety of the installation ordinarily remains unchanged.At low temperatures, neoprene temporarily acquires an abnormalhardness. The rate of hardening depends primarilyupon the temperature. Preliminary tests, at a temperature of40 F, have indicated that the modulus of neoprene type-E compositionsmay increase by a factor of 2 or 3 over a period of 5 days.Furthermore, the change will not occur if the mounting is innormal operation, since the mechanical working of the compoundwill prevent freezing. If a neoprene mounting has beenstiffened by freezing, tests have proved that the mounting willrecover its original characteristics quickly upon resumption ofoperation. It is believed that the rate of freezing increasesslightly as the temperature decreases to a value of about 20 F,and that below this temperature the rate of freezing decreases.A study of these points is in progress and more information willbe available in the future.B IBLIO G R A PH Y1 “ Synthetic Substances W ith Rubber-Like Properties,” byE. R . Bridgwater, Mechanical Engineering, vol. 60,1938, pp. 735-737.2 “ Rubber M ountings for Large Industrial M achines,” by S. H .Hahn, Product Engineering, vol. 8, 1937, pp. 59-62, 96—99.3 “ Rubber as a Spring M aterial,” by K . Oeser, Proceedings ofRubber Technology Conference, paper no. 47, London, 1938, pp.1092-1101.4 “ Zur Schalldammung von Federn und Dam m stoffen,” by E.M eyer and L. Keidel, Zeit. f iXr Technische Physik, vol. 18, 1937, pp.299-304.5 “ Air-Cooled Radial Aircraft-Engine Installation,” by P. A.Anderson, Trans. Society of Autom otive Engineers, vol. 31, 1936,pp. 431-450.6 “ Harshness in the Autom obile,” by H . A. H icks and G. H.Parker, S.A.E. Journal (Trans, sect.), vol. 39, Jan., 1939, pp. 1-7.7 “ Rubber Cushioning D evices,” by C. F. Hirshfeld and E. H.Piron, Trans. A .S.M .E ., vol. 59, 1937, pp. 471-491.8 “Effect of Oils and Chemicals on D u Prene (Neoprene) Compounds,"by O. M. H ayden and E . H . Krismann, Industrial and EngineeringChemistry, vol. 25, 1933, pp. 1219-1223.9 “Effect of Pigm entation on Neoprene Type G Compounds,”by N . L. C atton and D . F. Fraser, Industrial and Engineering Chemistry,vol. 31, August, 1939, pp. 956-960.10 “Oxidation of Rubber Exposed to Light,” by I. Williams,Industrial and Engineering Chemistry, vol. 18, 1926, pp. 367—369.11 “ A N ew Oscillograph for R outine Tests of Rubber andRubber-Like M aterials,” by F. L. Yerzley, Preprint 96, presentedat the A .S.T .M . Annual M eeting, Atlantic City, N . J., June, 1939,pp. 1-9.12 “ The M echanical Characteristics of Rubber,” by F. L.Haushalter, Trans. A .S.M .E ., vol. 61, Feb., 1939, pp. 149-158.13 “ Properties of Rubber Revealed by Mechanical T ests,” byF. L. Yerzley, A .S.T .M . Bulletin, August, 1939, pp. 31-34. Thisreference gives a brief analysis of m ethods of measuring hardness.14 “ Static and D ynam ic Properties of Rubber Under Compression,”b y C. W . K osten, Proceedings of the Rubber Technology Conference,London, 1938, paper no. 59, pp. 987-1002.15 “ Fatigue in Rubber,” by W . J. S. N aunton and J. R . S. Waring,Proceedings of the Rubber Technology Conference, London,1938, paper no. 53, pp. 805-820.16 “ Theory of Elastic Engine Supports,” by S. Rosenzweig,Trans. A .S.M .E ., vol. 61, Jan., 1939, pp. 31-36.17 “ Rubber M ountings,” by J. F. D . Smith, Journal of AppliedMechanics, Trans. A .S.M .E., vol. 60, 1938, p. A-13.DiscussionB. S. Cain.4 It would be helpful if the author could furnishsome of the characteristics of neoprene at low temperatures. Inparticular, is material available for use where some flexibilityis required over a wide range of temperatures, including a subzerorange?Stuart H. H ahn.5 This is another excellent presentation ofreasons why neoprene can be used for the construction of rubber4Assistant Engineer, Locom otive Division, Transportation EngineeringDepartm ent, General Electric Company, Erie, Pa. Mem.A .S.M .E .5 Physical Research Laboratory, The B. F . Goodrich Company,Akron, Ohio. M em. A .S.M .E.
YERZLEY—NEOPRENE AS A SPRING MATERIAL 475springs. This material, as well as several other modern syntheticrubber-like materials, has certain desirable properties forthis service.The value of the oil resistance and good aging properties ofneoprene is well known and appreciated by rubber technologists.However, the admitted tendency of the material to hardencontinuously upon exposure to elevated temperatures must bebalanced against its age resistance at elevated temperatureswhen spring service is to be considered.Many designers of rubber springs will disagree with the author’sthesis that damping characteristics greater than those of normalrubber compounds are desirable, particularly since high dampingusually is accompanied by increased creep. It is, unfortunately,true that low creep is rarely, if ever, a characteristic of compoundsof rubber and other rubber-like substances which have lowresilience (high damping). Available information on the creepresiliencerelationship for neoprene is even less complete thanthat for rubber compounds. It is hoped that the author willsoon be able to fill the need for such information.The addition to the literature of data on the dynamic modulusof neoprene and other compounds is welcome. It is unfortunatethat the author has not been able to extend his investigationsabove a frequency of about 4 cycles per sec, which is below theordinary range of resonance frequencies for the more commonrubber-spring designs. The modulus effective in determiningthe actual working transmissibility of such springs is the modulusat the impressed or forcing frequency, which is usually from 2.5to 10 times the resonance frequency.It is interesting to note that the data points, in the author’sFig. 9 which shows the resilience versus dynamic/static-modulusratio for neoprene and rubber compounds, appear to be groupeddistinctly into two categories which seem to distinguish the twomaterials. Although the rubber data are too limited to be conclusive,a curve giving a good fit to the available points wouldappear to intercept the 40 per cent resilience axis at a value muchlower than the intercept for the line shown, which fits the neoprenedata rather well.One most important property of rubber-like materials forspring service is the safe and economical stress to which they maybe subjected in service. The working stresses for compressiveuse are nearly always dictated by creep considerations so thatdeflections are ordinarily limited to values of about 20 per centor less. Failures due to actual fracture or cracking of the rubberare quite rare in such service. The determination of workingstress for service in shear is not nearly so simple. Some applicationswhich have proved practical in service have made use ofdeformations somewhat more than the thickness of the rubber(shear strain > 100 per cent thickness) and static or mean dynamicstresses in the region of 100 lb per sq in. are known to bepractical in certain limited classes of use, especially where compressivestrain perpendicular to shear adhesion areas is imposed.However, in no case does the actual breaking shear stress in continuousservice approach the breaking stress as determined byshort-time loading tests. It is important to the designer, whocontemplates the use of a material such as neoprene in spring service,to know what safe working loads may be applied to the materialif service over a given period at approximately known temperaturesis to be rendered without failure. The effect of temperatureincrease in reducing the strength of neoprene and rubbercannot be ignored.The author’s experience with poor standardization of thedurometer (type A) agrees with that of many others. Hisdescription of the calibration of his instrument adds to the valueof his hardness-versus-modulus curves, even though there aretheoretical objections to the method of calibration which he used.It also emphasizes the precautions which must be taken to avoidor compensate for the well-known shortcomings of the instrument.Tests and theoretical studies by another member of thislaboratory have indicated very clearly that the most reliable resultsmay be obtained only when the durometer is held in such away that the lightest possible pressure is obtained between therubber surface and the foot or disk surrounding the indenterpoint.The author seems to be guilty of overemphasis in saying thatthe slightly higher thermal conductivity of neoprene compoundsis sufficiently great to constitute an appreciable advantage of thissynthetic over natural rubber. The thermal conductivitiesof neoprene and rubber compounds suitable for spring serviceare all so low that any appreciable energy absorption producessizable temperature rises in both classes of materials. The conductivityof the softer rubber-spring stocks is about 0.95 Btu/(hr)(sq ft) (F/in.) or roughly 1/ SOo that of steel.An estimate of the temperature which might be produced inmountings made of a neoprene compound and used under conditionsof moderately severe vibration has been made for the followinghypothetical case:M achine weight, 2000 lbShear stress on mountings, 40 lb per sq in.Static deflection of m ountings, 1 in.Resilience of neoprene compound used in m ountings, 60 per centM agnitude of simple harmonic disturbing force, * 20 lbFrequency of disturbing force, resonant (approximately 190 cycles permin)For this particular case, the mean rate of temperature riseworks out to something like 3 F per min and, since the mountingswould necessarily have a thickness of 1 in. or more, the maximumtemperature in each mounting would probably attain a value ofabout 200 F after starting at 80 F and running for about 1 hr,if failure of the material did not occur before that, through thecombination of the weakening effects of temperature and thegradually increasing amplitude which would result as the dampingcoefficient decreased with increasing temperature. Hence,intentional operation at resonant frequency would be impractical,since the comparatively higher conductivity of neoprene stocksis still too low to permit their extensive use as shock absorbers.In some cases there has been a real need for a cool-runningrubber or synthetic compound for use in services where occasionalor even rather frequent shocks or dynamic-stress cycles are encountered.However, the solution of the problem in most cases,and probably in every case, has been the use of a compoundwhich possesses relatively high resilience with ordinary values ofthermal conductivity, rather than low resilience accompanied bythe maximum possible conductivity. It should be emphasizedthat thermal conductivities of all rubber-like materials are solow that they are unable to dissipate very much energy continuouslyexcept in the case of relatively small pieces.F. L. H a u s h a l t e r .6 The writer expected to learn from thispaper how high neoprene might be stressed as compared withrubber, without experiencing trouble from creep or drift. Ifneoprene springs are used to support a machine, what would bea reasonable estimate as to how much lower the machine wouldbe setting in a year’s time? Also, what would be the modulusor rate of the spring in a year and, possibly, in 3 or 10 years hence?If the springs are to be used in an atmosphere of elevated temperature,data on creep would be essential before choosing the stressat which the spring will function. Values of dynamic modulusversus static modulus for this material are useful enough, butwhat are these moduli after creep has taken place at elevatedtemperatures? We know that for rubber the values are appreci-• D evelopm ent Engineer, The B . F. Goodrich Company, Akron,Ohio.
476 TRANSACTIONS OF THE A.S.M.E. JULY, 1940ably higher, and it is reasonable to suppose that for neoprene thevalues would be still higher because it is the wa iter’s experiencethat neoprene compounds have greater creep than equivalentrubber compounds.The more work the writer does with springs made from rubber,or rubber-like materials, the more he is convinced that dampingis an unwanted characteristic in the material. About the onlyplace one would require a spring to operate at resonance wouldbe to counteract and neutralize the vibration of a body or member,the critical period of which was at that same frequency.Such applications are rare. About the only instance of this kindwhich the writer can recall occurred several years ago. In thiscase, the front wheels of an automobile developed a critical periodcausing bad wheel shimmy at a certain operating speed whentraveling on cobblestone pavement. This vibration, which wasin the horizontal plane, was neutralized by attaching a mass onthe end of a spring, which in turn was fastened to the tie rod.The spring was designed to give the suspended mass the sameresonant frequency as the wheels in the horizontal plane.In the vast majority of cases, it would certainly be ridiculousto want to isolate a vibrating body with springs and then have thesprings function at their point of resonance. If we wish to doany damping in passing through critical speeds, it can be donemuch more cheaply by using hydraulic shock absorbers. If wedo not operate springs in the resonant range, which Hull pointedout should not be less than a frequency ratio of 1.4, damping is adistinct disadvantage, for the energy consumed in damping increasesthe transmissibility through the mounting.Furthermore, the more damping there is in the material, themore creep will take place in the spring. The author has a goodopportunity to disprove this statement, but if Isaac Newton wrasright, it is very probable that, as compounds made from neopreneG are developed, which take on less and less creep, we shall findthat the hysteresis loss, or damping effect, will diminish accordingly.As for the argument on durometer and hardness, which seemsto be an endless one, as unscientific as this instrument appearsto be, the writer dislikes the thought of condemning it tothe scrap heap, for when properly used it certainly can pick outsmall differences in hardnesses of stocks in a comparative way.For the detection of these small changes in hardness, the writerwould not use the author’s method, but would depend upon thehuman hand. The writer was once confronted with the task ofmaking a rubber spring slightly stiffer than a previous spring,which meant an increase of about ‘/ , point in hardness on thedurometer. After using the Olsen hardness tester and the Pusey& Jones plastometer with conflicting results, the only way discoveredfor accomplishing this was to lay on a table disks of thepossible compounds of the same thickness, and go from one toanother with the durometer in hand. The stock was selectedin this way and, when the spring was made up, the shear-modulusvalue was found to be exactly that required. It is truly a difficultmatter to standardize durometers, but there is no reasonwhy we cannot calibrate one against the other. Undoubtedly,one who works constantly on the compounding of rubber andrubber-like materials soon acquires facility in the use of his owndurometer.J. F. D o w n i e S m i t h .7 The material given in this paper will,in the writer’s opinion, be welcomed by designers who are interestedin the application of rubber and rubber-like materialsin industry. It is hoped that more information of this type onother rubber-like materials will be made available in the nearfuture. At present the mechanical engineer feels rather at a7 E xecutive Engineer of Research, Edward G. Budd M anufacturingCompany, Philadelphia, Pa. Mem. A .S.M .E .loss when he is trying to determine the proper material to usefor a specific application.A short time ago the author gave the writer two samples ofneoprene and one of rubber each bonded to metal plates in theform shown in Fig. 13 of this discussion. In order to make aF ig . 13L o a d in g a n d U n l o a d in g C u r v e s o f N e o p r e n e a n dR u b b e r S a m p l e s B o n d e d t o M e t a l P l a t e scursory examination of each sample to see if it would be applicablein springs as used in experimental work, each sample wasloaded and unloaded quickly a few times. Then a loading curvewas taken in 7‘A min with the unloading curve taken in aboutthe same time. A second set of curves was then made withloading and unloading periods 6 times as great. The resultsare shown in Fig. 13.One of the neoprene samples, No. 1441 N-12, after the testswere completed, was found to be split, and could no longer berecommended as a spring. The other neoprene sample and therubber one were apparently satisfactory.It may be observed that one of the neoprene samples gave amuch greater variation between quick and slow loading than didthe rubber. At two shear stresses the percentage variations betweenthe two loading curves are as follows:
YERZLEY—NEOPRENE AS A SPRING MATERIAL 477A t 40 lb A t 60 lbper sq in. per sq in.1 For rubber No. 1333-34A 4 .4 2 .62 For neoprene No. 1441 N-12 4 .5 4 .83 For neoprene N o. 1441 N - ll 9 .9 8 .9The writer would like to ask the author if such results wouldalways be expected from typical rubber and neoprene springs,or if these samples are unusual in some way. If results of thistype are expected, would he consider them detrimental to theuse of neoprene as a spring?An additional point of concern is that none of the curves comesanywhere near the theoretical shear loading curve which mightbe expected from previously published data on rubber. Thistheoretical curve is based on the calibration of definite Shoredurometers against known moduli of elasticity in shear for rubber.Now all three of the curves shown in Fig. 13 check one anotherreasonably well, and one of the samples is of rubber andtwo are of neoprene so that the change from natural rubber to asynthetic rubber-like material is not the answer. One thoughtwhich arises is: “Does the size of the sample have an influenceon the rough relationship of durometer hardness and modulus ofelasticity in shear?” These particular samples are much smallerthan those ordinarily used by the writer, and it occurred to himthat this may explain the discrepancy to some extent.A u t h o r ’s C l o s u r eIn this paper, an attempt was made to summarize such portionsof the present knowledge of neoprene as might contribute to thedesign of springs. It is a paper on a spring material, however, andnot a detailed paper on springs or on vibration in engineering.The author attempted to cite adequate references, without givinga complete bibliography, on these topics as collateral reading foranyone sufficiently interested. The fact is appreciated by theauthor that the present knowledge of neoprene has limitations.In some respects, additional research and further years of experiencewill permit a more definite account in the future than ispossible today.Mr. Cain has asked a question particularly pertinent to outdoorservice. A specific answer would require definition of the expression“some flexibility.” At — 40 F neoprene compositionsof a high-grade mechanical type properly cured approximate thestiffness of hard leather but they are not brittle after exposurefor as long a period as 14 days. If this condition is considered tofall within the intended meaning of the question, neoprene isflexible at all low temperatures down to — 40 F for any length ofexposure. The change of modulus under these conditions would,of course, drastically alter the characteristics of a neoprene springand would be against its application in some cases. Stiffnessacquired by exposure to low temperatures can be overcome byheating from external sources, or by mechanical working.A detailed discussion of each of the points raised by Mr. Hahnand, in some cases, again by Mr. Haushalter would be inordinatelylong and involved. There seems to be peculiar disagreement inthe literature and among engineers as to what properties in rubberare desirable for some types of service. Every individualtaking part in such technical controversies as this has some realbasis for his views but, when the situation is viewed broadly, thearguments in good faith seem to arise from deductions based upondistinctly different types of service. The author has culled fromthe literature the outstanding reasons given for the use of rubberas a spring material under particular conditions. These reasonsare, therefore, advantages possessed by rubber springs over metallicsprings and are listed as such in the introduction to the paper.The same literature has pointed out further properties to be desired.Such properties, when possessed by neoprene, thus becomeadvantages of neoprene over natural rubber for particular conditionswhich have been adequately defined in the early part ofthe paper. It seems trite to point out that, where these conditionsdo not exist for either rubber or neoprene, other selections wouldbe made and that the selection of neoprene or rubber would sometimesbe based upon one or two outstanding characteristics, inspite of attendant disadvantages.The relatively high damping rate obtainable with neopreneis an advantage when relatively rapid damping is desirable. Inother cases a high rate of damping would be a distinct handicap.The author does not believe that any engineer could specify theproperties of an ideal spring system without including in the specificationa desirable range of damping rates. Although Rosenzweig(16) has discussed the advantage of damping at criticalfrequencies, the bulk of his paper is devoted to proof that, outsideof the critical range, damping is undesirable in the isolation ofvibration. Numerous other references could also be given whichcover the same point. The author has merely attempted to showthat neoprene increases the range of damping rates available withrubber-like materials beyond the limits feasible with rubber. Itis the job of designers to determine how much damping is requiredin a given case.Mr. Haushalter’s statement that spring systems are not designedto operate at resonance, apparently, is made withoutconsidering the present importance of dynamic balancers. Theexample of front-wheel shimmy on automobiles has been supplantedin industrial importance by a host of harmonic balancersin other applications. Those used on lightweight crankshaftsto reduce torsional vibration are particularly interesting. Combinationsof frictional and dynamic absorption offer the possibilityof effective refinements in design.Various authorities have suggested the desirability of dampingaction by rubber springs. Among them Haushalter, in a recentdiscussion,8 expressed himself as follows: “It would be very desirableto have a rubber spring with a high damping coefficientbut, with a compound giving this, the drift greatly increases. Acombination of high damping and low drift in a rubber stock isyet to be found. The two conditions, apparently, are diametricallyopposed. Work is still going on, however, and there are somepossibilities in this direction with synthetic rubber.”In his experience with neoprene, the author has noted frequentexceptions to the statement that there is a general correspondencebetween creep and resilience. In a current series of tests, forexample, two neoprene compounds, cured for the same length oftime and having the same compression moduli, have 78 and 76per cent resilience, respectively. However, in a shear-drift test,the former compound shows roughly twice the drift rate indicatedby the second. This is not an isolated case, but is a repetition ofa rather frequent occurrence. If the correlation were strictly truefor rubber, as it certainly is not for neoprene, long and expensivetests of creep could be dispensed with in favor of fast and relativelyinexpensive tests of resilience. Unfortunately, this is notthe case.Very properly, Mr. Hahn has pointed out that the thermal conductivityof rubber and of neoprene is relatively low. Manymechanical designs of rubber parts have failed because excessiveheat was developed in operation. Other things being equal, anyincrease in thermal conductivity will assist the dissipation ofenergy, but a 30 per cent increase can only offer help to a minorextent. The relative values of thermal conductivity are quiteincidental and, if the author is guilty of overemphasis, the pointis well taken.The use of neoprene commercially as a spring material is arelatively recent development and it is not possible, at the present8 “Rubber Cushioning D evices,” by C. F . Hirshfeld and E . H.Piron; discussion by F. L. Haushalter, Trans. A .S.M .E ., vol. 60,1938, p. 204.
478 TRANSACTIONS OF THE A.S.M.E. JULY, 1940time, to predict what will happen to a spring in 3 to 10 years.Yet, it is believed to be true that the best rubber compositionshave lower drift than the best neoprene compositions. However,the author knows that it is possible to produce neoprene compositionswhich compare very favorably with some of the rubbercompositions commercially used. Unfortunately, tests whichare now in progress at the du Pont rubber laboratories havenot yet progressed to the point where detailed presentation ispermissible.With reference to the discussion by Dr. Smith, the author considerscreep to be a type of dimensional instability and any typeof instability in a structural material is undesirable. It is indicatedby the tests that neoprene will creep more under dead loadduring the first hour than a comparable high-quality rubber undersimilar conditions. Since the neoprene samples under discussionare the best obtainable at the present time from thecreep standpoint, it is apparent that neoprene will creep moreduring the first hour than rubber. The fact that a defectivesample appeared to be better than an undamaged specimen issomewhat surprising and is probably an indication that a morereliable comparison between the compositions might be obtainedfrom a more extended test. It has been the author’s experiencethat the maximum discrepancy in rate of creep between properlyvulcanized neoprene and rubber compositions occurs during thefirst 24 hours.Inasmuch as the discrepancy in theory mentioned by Dr.Smith concerns a correlation of shear modulus with durometerhardness, it does not seem to be a matter of the greatest importance.If we remember that the correlation between elasticmoduli and durometer readings is at best an approximation,occasional departures should not be too disturbing. On the otherhand, data in the author’s personal files indicate that the publishedvalues of shear modulus referred to by Dr. Smith are about30 per cent low and this observation is confirmed by Dr. Smithin this case. It should be more disturbing if the size of thesamples has a large effect upon the value of the shear modulus,since this would vastly complicate the design of shear springsby requiring a shape or size factor. The author’s experience hasbeen more extensive with small samples than with large ones,but there is inclination to doubt that the size of shear mountingshas any great influence upon the modulus of a spring composition,provided each specimen is uniformly cured throughout its entirevolume.It is quite apparent that the introduction of rubber springs toindustry, particularly to the automotive industry, preceded thedevelopment of an adequate literature and engineering backgroundfor general purposes. Even today, data on rubber areextremely meager and without a satisfactory network of correlatingtheory. It is to be hoped that information on rubber andsimilar materials will develop more rapidly in the future and thatthe present mystery surrounding the mechanical properties ofthese materials will soon no longer exist.