Stress Concentration Produced by Holes and Notches
Stress Concentration Produced by Holes and Notches
Stress Concentration Produced by Holes and Notches

You also want an ePaper? Increase the reach of your titles
YUMPU automatically turns print PDFs into web optimized ePapers that Google loves.
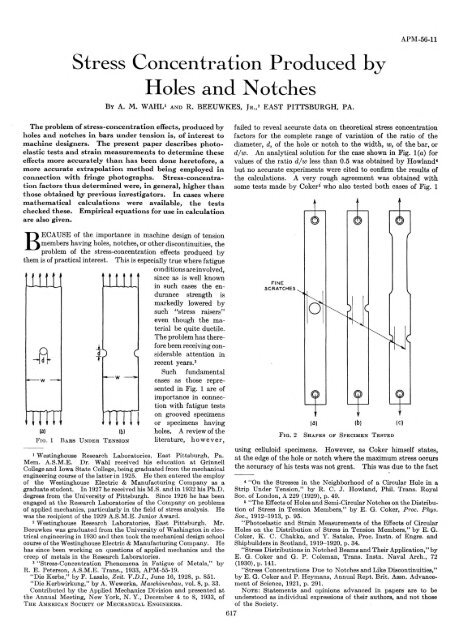
618 TRANSACTIONS OF TH E AMERICAN SOCIETY OF MECHANICAL ENGINEERS(a) Before LoadingF i g . 3that the compensation method was used to determine the stress,a method that is particularly difficult to use at a localized point ofstress concentration. Coker’s results, nevertheless, were valuableas a first attack on the problem.Tests using an extensometer were also made a long time ago<strong>by</strong> Preuss.6 These are again not as accurate as might be desiredbecause of the finite gage length required <strong>and</strong> because of the lackof sensitivity in extensometers of short gage length. These tests,however, do represent an excellent pioneering attack on the problemof photoelastic stress determination.More recently, since the present investigation was started, thecase represented <strong>by</strong> Fig. 1 (a) was studied photoelastically <strong>by</strong> A.Hennig7 using specimens made of optical glass. The results heobtained agree quite well with those obtained herein for values ofd/w less than about 0.7.Because of the lack of accurate data on stress-concentrationfactors for these cases it was decided to make some additionalphotoelastic tests <strong>and</strong> strain measurements. The fringe method,6 E. Preuss, Forschungsarbeiten (M itteilungen ilber Forschungsarbeiten),V .D .I., no. 126, 1912, <strong>and</strong> no. 134, 1913.7 “ Polarisationsoptische Spannungsuntersuehungen am gelochtenZugstab und am N ietloch,” b y A. Hennig, Forschung a u f dem GebeiteIngenieurwessens, V .D .I., vol. 4, no. 2, p. 53.S p e c i m e n W i t h H i g h E d g e S t r e s s(b) A fter Loadingas developed <strong>by</strong> Tuzi,8 Mesmer,9 Frocht,10 Solakian <strong>and</strong> Karelitz,11<strong>and</strong> Baud12 was applied. Tests were made on bakelitespecimens of the shape shown in Figs. 1 <strong>and</strong> 2 to cover thecomplete range from d/w = 0 to d/w = 1. In addition sometests were made on a large steel specimen having a hole with adiameter almost equal to the width <strong>and</strong> of a size large enough sothat accurate strain measurements could be made with Huggenbergerextensometers.T e s t S p e c i m e n sThe types of test specimens used are shown in Fig. 2.It will8 Z. Tuzi, Inst. Phys. <strong>and</strong> Chem. Research, Tokyo, vol. 8, p. 247,<strong>and</strong> vol. 12, p. 21. See also footnote 10, discussion to Dr. F rocht’spapers.9 “Vergleichende Spannungsoptische Untersuchungen und FliessVersuche u n ter K onzentriertem D ruck,” <strong>by</strong> G. M esmei, Zeit. fu rTechnische Mechanik und Thermodynamik, V .D .I., vol. 1, nos. 2 <strong>and</strong> 3,Berlin, 1930.10 “R ecent Advances in P hotoelasticity,” <strong>by</strong> M. M. Frocht,A.S.M .E. T rans., 1931, APM-53-11.“K inem atography in P hotoelasticity,” <strong>by</strong> M. M. Frocht, A.S.M .E.T rans., 1932, APM-54-9.11 “ Photoelastic Study of Shearing <strong>Stress</strong>es in Keys <strong>and</strong> Keyways,”b y A. G. Solakian <strong>and</strong> G. B. K arelitz, A.S.M .E. T rans., 1932,APM-54-10.12 R. V . B aud, Jour. Optical Soc. A m ., vol. 21, 1931, p. 119.
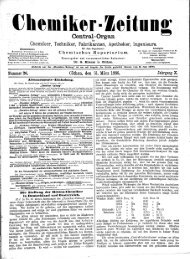
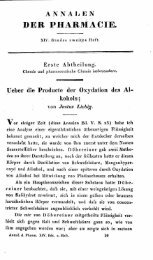
e noted that in each case the test piece was designed so that thestress was substantially uniform along a considerable portion ofthe specimen. By plotting the loads on the specimen againstfringe order in the uniformly stressed portion, a calibration curvecould be obtained thus permitting the determination of the stressper fringe for the material. In some cases a calibration bar inbending, such as employed <strong>by</strong> other investigators, was used butthe results obtained in this manner were practically the same asthose obtained <strong>by</strong> using the aforementioned method which waseasier to apply in this case <strong>and</strong> which in our opinion was fully asaccurate. The specimen shown in Fig. 2(c) permits the calibrationto be made at a higher stress in the straight portion withoutproducing an excessive stress in the minimum section at thenotch.On each of the test specimens fine scratches were madeparallel to the axis of the specimen <strong>and</strong> in close proximity to thehole or notch. The purpose of these scratches was to permit theexact determination of the true edge of the hole or notch on thephotograph. This was done <strong>by</strong> measuring the distance from thescratch to the edge of the hole or notch on the actual specimenusing a microscope or a comparator. Then, knowing this distance<strong>and</strong> the actual magnification, the location of the true edgecould be accurately determined on the photograph. It wasnecessary to know this location accurately since in most cases thestress gradient near the edge was fairly steep <strong>and</strong> in consequence aslight error in the location of the edge would make a relativelyAPPLIED MECHANICS APM-56-11 619great difference in the magnitude of the measured stress. In allcases, as will be discussed later, it was found necessary to extrapolatethe stress difference curve to the true edge, which in eachcase was found to be slightly inside the apparent edge as shown<strong>by</strong> the photographs. (See Figs. 6 to 8.)The test specimens were prepared from specimens of bakeliteannealed <strong>by</strong> a process similar to that used <strong>by</strong> Mesmer,9 Frocht,10<strong>and</strong> Solakian <strong>and</strong> Karelitz.11 It was necessary to select certainof the best pieces of bakelite for use in preparing specimens, sinceit was found that some of the samples retained residual stresses ofconsiderable magnitude even after repeated annealing. This isin agreement with results obtained <strong>by</strong> Tuzi8 <strong>and</strong> indicates that itis of importance to get material suitable for annealing in order toobtain satisfactory results, particularly when high accuracy isdesired.The test specimens were prepared <strong>by</strong> first annealing them <strong>and</strong>then machining them to size, care being taken to see that the finalmachining cuts were very light so as to introduce as little residualstress near the edge as possible. Precautions were taken also tocarry out the photoelastic tests as soon as possible after completionof the machining operation since it was found that in a shorttime, the specimens would develop an edge stress which makesthe determination of the maximum stress very difficult, if notimpossible. This is illustrated <strong>by</strong> Fig. 3 which shows two photographsof a specimen, in the loaded <strong>and</strong> unloaded condition, <strong>and</strong>having the edge effect in both. The edge effect was produced <strong>by</strong>(a) Before LoadingF i g . 4(b) A fter LoadingS p e c i m e n W i t h P r a c t i c a l l y N o E d g e S t r e s s
620 TRANSACTIONS OF TH E AM ERICAN SOCIETY OF MECHANICAL ENGINEERSF i g . 6 B a r W i t h S m a l l N o t c h F i g . 7 B a r W i t h M e d i u m - S i z e d N o t c h
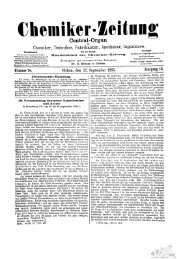
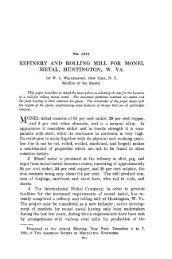
ather heavy machining cuts <strong>and</strong> <strong>by</strong> allowing the specimen tost<strong>and</strong> a few days before testing. It may be readily seen that asudden discontinuity in the stress near the edge such as exists inthis particular specimen would make an accurate extrapolationof the stress curve to the true edge almost impossible.Fig. 4 shows two pictures of a specimen machined <strong>and</strong> testedwith these precautions in mind. I t may be seen that <strong>by</strong> carefulattention to these details such edge effects may be practicallyeliminated. The scratches mentioned previously are plainlyvisible both in these two pictures <strong>and</strong> the two shown in Fig. 3.P r o c e d u r e i n M a k in g T e s t s a n d D e t e r m i n i n g R e s u l t sIn carrying out the tests monochromatic light was employed,a jnercury vapor lamp with an appropriate filter being used.The specimens were stressed at 3000 to 3500 lb per sq in. in themost highly stressed portions. This is approximately the proportionallimit for the material. Photographs were then taken ofthe fringes. A view of one of the specimens mounted in thephotoelastic apparatus is shown in Fig. 5. Typical photographsof various specimens tested are shown on Figs. 6, 7, <strong>and</strong> 8. At thetime of making the photographic exposures, a calibration curve tofind the stress per fringe was taken <strong>by</strong> loading the specimen <strong>and</strong>observing the fringe order of a uniformly stressed portion of thespecimen as mentioned previously. This curve in all cases wasfound to be practically a straight line.In working up the results the mean stress at the minimumAPPLIED MECHANICS APM-56-U 621F i g . 1 C u r v e s o f F r i n g e O r d e r V s .M a r k sD i s t a n c e F r o m S c r a t c hF i g . 1 0S t r e s s C o n c e n t r a t i o n F a c t o r V s . d/w f o r F l a t B a rW i t h H o l eF i g . 8B a r W i t h L a r g e H o l iF i g . 11S t r e s s C o n c e n t r a t i o n F a c t o r V s . d/w f o r F l a t B a rW i t h N o t c h
the difficulty of making optical tests on such a specimen, it wasdecided to make measurements on a steel model as shown on Fig.13, using an extensometer with a gage length of 0.3 in. <strong>and</strong> a holeof 4-in. diameter in a 4Vs-in. wide plate (d/w = 0.97). It wasfound possible to place the extensometer points on the inside ofthe hole as indicated in Fig. 12, which shows the relative size ofthe hole as compared to the gage length. Since it is known thatfor such a thin section the stress distribution must be linear, thestress concentration factor may be found <strong>by</strong> dividing the stressreadings on the inside of the hole <strong>by</strong> the average value betweenthe stress obtained on the outside (see Fig. 13) <strong>and</strong> that obtainedon the inside (see Fig. 12). The stress on the inside was foundto be 28,100 lb per sq in. <strong>and</strong> that on the outside only 1400 lb persq in., giving K = 1.91 for a load of 450 lb. As a check, themean stress across the minimum section could be found from theknown loads. The maximum stress measured on the inside atpoints, d, divided <strong>by</strong> this mean stress then gives the stress-concentrationfactor. The two methods gave results agreeingwithin 1 per cent, the average value of K being 1.92. In O rd e r toeliminate inaccuracies due to a slight eccentricity of loadingaverage values on opposite sides of the specimen were used.This value of K is roughly in agreement with results obtained <strong>by</strong>Coker <strong>and</strong> Filon,13 who mention that the stress on the outside ofthe bar seems to approach zero as d/w approaches unity, whichwould correspond to K — 2.Curves between load <strong>and</strong> stress on the inside of the hole(points d, Fig. 12) were found to be linear. The correspondingcurves for points a <strong>and</strong> b were found to be roughly linear, althoughthe exact shape of the curve at these points was very hard todetermine because of the very small stresses involved. Measurementsof the distance between points a <strong>and</strong> b (Fig. 12) indicatethat these points approach each other during loading, the relationbetween load <strong>and</strong> deflection being again roughly linear. It maybe seen that during loading the inward movement of these pointsis such as to increase the stresses on the outside (at points a <strong>and</strong> 6),there<strong>by</strong> reducing the stress concentration factor K below thatwhich would be obtained for very small deformations, such as areassumed in elastic theory. It is possible that this is the reasonfor the value of K being 1.92, as obtained, rather than a highervalue. In case the hole diameter so closely approaches thewidth of the bar that the minimum section becomes an infinitelythin filament, then for any finite deformation, this filament maymove inward sufficiently to allow of a uniform stress distribution,thus giving if = 1. For infinitely small deformations relative tothe thickness of this filament, however, K may still be equal to 2.The tests nevertheless indicate that, for a value of d/w =0.97, K = 1.92 with stresses on the order of those possible in engineeringmaterials such as steel. They also indicate that thecurve does not drop down to unity as fast as would appear fromthe curve given <strong>by</strong> Hennig (see Fig. 10).C o n c l u s i o n sThe present tests on bars with holes agree closely with themathematical results obtained <strong>by</strong> Howl<strong>and</strong>. This agreementalso suggests that the photoelastic method described, if precautionsto avoid undesirable edge effects are taken, offers anaccurate means to determine stress concentration factors forvarious machine parts.The results indicate that for large holes having a diameternearly equal to the width of the bar the stress concentrationfactor is not far from 2 in cases where the lateral displacements ofthe minimum section of the bar are small compared to the thicknessof this section.11 “Photoelasticity,” <strong>by</strong> Coker <strong>and</strong> Filon, Cambridge Univ.Press, 1931, p. 486.APPLIED MECHANICS APM-56-11 623The results obtained on bars with semi-circular notches indicatein general higher stress-concentration factors than thoseobtained <strong>by</strong> using the results obtained <strong>by</strong> previous investigators.This is to be expected, considering the difficulty of using thephotoelastic compensation method right at the edge of a specimenor of applying extensometers with short gage lengths. The factthat the compensation method tends to give an average valuenear a localized point of stress concentration, rather than thepeak value, also tends to explain this difference.Empirical equations are given for calculating the stress-concentrationfactors both for tension bars with holes <strong>and</strong> for barswith semi-circular notches.A c k n o w l e d g m e n tThe authors are indebted to R. E. Peterson, at whose suggestionthe investigation was made, <strong>and</strong> to Drs. Nadai <strong>and</strong> Timoshenkofor valuable advice <strong>and</strong> suggestions.DiscussionO. J. H o r g e r . 14 The authors have presented the stress-concentrationfactors over a complete range in a satisfactory manner.The test procedure is accepted as giving accurate results whichexplain the deviation from previous data <strong>and</strong> in this respect theauthors should be commended.While these concentration factors are of importance to thedesign engineer the presentation of this data is only the beginningof a study which should be pursued. Design problems ofteninvolve two stress-concentration factors, one due to shape <strong>and</strong> theother due to material. The present tendency toward reducedweights <strong>and</strong> costs of machine parts requires accurate knowledgeof the factor of safety <strong>and</strong> dem<strong>and</strong>s consideration of these twofactors separately. “Dauerfestigkeit <strong>and</strong> Konstruktion,” in 1932,<strong>by</strong> Dr. A. Thum <strong>and</strong> W. Buchmann discusses this phase <strong>and</strong> givesome data.The extrapolation method employed is a worthy step in photoelasticanalysis. After reading a preliminary report of thispaper extrapolation was followed in an experiment made <strong>by</strong> thewriter. Contrary to the findings of the authors the true edgewas not always found inside the apparent edge. In one case thedistance from the scratch to the edge on the model was 0.115 cmwhile the apparent edge measured 0.253 cm <strong>and</strong> in the samephotograph directly opposite, the true position on the modelMeameasured 0.482 cm against 0.443 cm on the photograph.surements were made with a comparator.M. M. F r o c h t . 15 The paper <strong>by</strong> Messrs. Wahl <strong>and</strong> Beeuwkesmay, for the purpose of discussion, be divided into two parts:one part dealing with a reexamination of factors of stress concentrationfor two important engineering cases, <strong>and</strong> the otherpart dealing with suggestions for the determination of vagueboundaries <strong>and</strong> the more accurate evaluation of boundary fringeorders.The writer has had difficulties in determining the true boundarysimilar to those experienced <strong>by</strong> the authors but he has foundit possible to eliminate these difficulties <strong>and</strong> to obtain stresspatterns in which the true boundary is clearly visible. Such astress pattern is shown in Fig. 14. In order to determine theaccuracy with which the boundary can be shown, two scratcheswere drawn on the model. One of these scratches was veryfine <strong>and</strong> was subsequently determined to be in an interval ofno more than 0.0025 in. from the edge, the other scratch was14 Ann Arbor, Mich.16 Photoelastic Laboratory, Dept, of Mechanics, Carnegie Instituteof Technology, Pittsburgh, Pa.
624 TRANSACTIONS OF TH E AM ERICAN SOCIETY OF MECHANICAL ENGIN EERSconsiderably larger starting at 0.004 in. from the edge <strong>and</strong> havinga width of about 0.006 in. These dimensions were determinedvery carefully when the edge of the model was machined after thephotographs were taken. The larger of the two scratches isclearly visible in Fig. 14. The finer scratch can also be seen <strong>and</strong>is located between the w'hite arrow-heads to the left of themodel. Fig. 15 shows a stress pattern against a white back-straight lines. There is a twofold advantage to the use of thecircle over the straight line scratches: it calls for only one measurement<strong>and</strong> it gives greater accuracy.W ith respect to the results proper, the writer computed thestress concentration factor, for a ratio —d= -,1w 5of a bakelite speci-men 0.625 in. X 0.188 in. thick with a 1/s in. hole, <strong>and</strong> the averageof two values for two different loads was 2.52, against 2.51 given<strong>by</strong> the authors’ formula. The agreement between the authors’curve <strong>and</strong> that of Howl<strong>and</strong> lends additional strength to the reliabilityof the results.The writer observes with interest that the authors determinedthe fringe value from a pure tension rather than from a pure bendingtest. This agrees with the procedure adopted in our morerecent work. Experience has shown that it is simpler to determinethe fringe value from a tension or compression strip, <strong>and</strong>that the results are also more consistent. There is a specialmerit to it if the model in which the stresses are studied, as is thecase in this instance, can be utilized as its own calibration piece.F ig . 1 4 B a k e l i t e M o d e l i n C o m p r e s s i o n(Showing true boundary against a black background. Arrow-heads pointto fine scratch on the edge of model.)ground instead of the conventional black background, from whichit can be seen that this procedure adds to the clearness of theboundary. Inspection of the left edge reveals clearly the presenceof even the fine scratch engraved on the boundary.The writer prefers to take all the necessary precautions toobtain stress patterns in which the boundaries can clearly be seenrather than to determine these from engraved lines as suggested<strong>by</strong> the authors.The determination of boundaries from engraved lines <strong>and</strong> ofboundary fringe-orders from extrapolation is in reality a muchmore difficult procedure than would seem to be the case on firstthought. In the first place, the distance between scratcheschanges with the load so that for accurate determination of thescale of magnification these measurements should be carried outafter the load is applied <strong>and</strong> just before photographing the pattern.Also, extrapolation is not a unique <strong>and</strong> definite procedure,so that the results would probably vary with the investigator.The procedure of extrapolation may introduce errors as great orgreater than the ones it is trying to correct. However, if it isdesired to determine the boundary-fringe value <strong>by</strong> extrapolationit is suggested that, in tension members with holes or fillets, acircle concentric with the hole be inscribed rather than twoF i g . 15 B a k e l i t e M o d e i . i n C o m p r e s s i o n(Show ing'true boundary against a white background. Arrow-heads pointto fine scratch on the edge of model.)In connection with the question of fringe-value determination,the writer wishes to make two suggestions—first, that this valuecan be determined with great accuracy in a tension or compressionmember <strong>by</strong> means of a good photometer, such as the photoelectric-celltype, there<strong>by</strong> removing eye-strain <strong>and</strong> the subjectiveelement of the observer; <strong>and</strong>, second, that fringe value be definedas the change in maximum shear stress necessary to cause achange from black to the next black or white to the next white,at any given point in a model of the given material 1 in. thick.At present the fringe value is associated not only with the material,but also with the thickness of the model. To obtain thefringe value for any particular model, it would only be necessary
to divide the fringe value for that material <strong>by</strong> the thickness ofthe model. This would simplify matters considerably <strong>and</strong> permitof easy comparison of relative optical sensitivities of differentmaterials.A u t h o r s ’ C l o s u r eDr. Frocht suggests that, <strong>by</strong> taking necessary precautions,the boundary of the test specimen may be made clearly visibleon the photograph <strong>and</strong> that it is preferable to determine thetrue edge from such a photograph rather than <strong>by</strong> means of theextrapolation procedure used <strong>by</strong> the authors. In addition, asevidence of cases where the boundary is defined with sufficientclearness, he submits the photographs of Figs. 14 <strong>and</strong> 15. Afterexamining these photographs, however, the authors do not feelthat the edges were defined with greater clearness near the filletsthan was the case in most of the tests made <strong>by</strong> them; it is alsotheir opinion that the use of the extrapolation method would increasethe accuracy of the determination of the peak stresses inthe fillets of the models shown on Figs. 14 <strong>and</strong> 15.In connection with the use of the extrapolation procedure,Dr. Frocht mentions that the distance between the engravedlines on the specimen would change when the load is applied,<strong>and</strong> this would involve an error in determining the scale of magnification.However, it can be shown that this error is negligiblefor such stresses as are practicable with bakelite. For example,in most of the specimens used <strong>by</strong> the authors, the scratches employedto determine the magnification ratio were about 1 in.apart while the contraction due to the applied stress amountedto about 0.001 in. as computed from the known values of stress<strong>and</strong> elastic constants. This would correspond to an error of0.1 per cent, a negligible value. Even if the stresses used weredoubled, the percentage error would still be only 0.2 per cent.Since the distance between the scratch <strong>and</strong> the edge is measuredin the unstressed condition, there is a further error in locating theboundary on the extrapolation curves, due to the contraction ofthe stressed material between the scratch <strong>and</strong> the boundary.The error in fringe order due to this cause may also be shown tobe of negligible importance. Calculating the contraction fromthe known stresses <strong>and</strong> multiplying <strong>by</strong> the magnification ratio,the amount of error in locating the boundary on the extrapolationcurves is obtained. From this, <strong>by</strong> reference to actual test curves,the error in fringe order may be found. Several tests werechecked <strong>by</strong> the authors <strong>and</strong> in no case was the error due to thiscause over 0.2 per cent. Hence, it may be concluded that errorsAPPLIED MECHANICS APM-56-11 625in the extrapolation procedure due to lateral contraction of thestressed material are negligible, at least for engineering purposes.It is true, as Dr. Frocht says, that extrapolation is not a definite<strong>and</strong> unique procedure, <strong>and</strong> that there will be some variationwith different investigators. The authors have found, however,that such variations are relatively small, particularly when comparedto the possible errors resulting when the peak fringe valuesare determined merely <strong>by</strong> inspection. This checks with the experienceof Dr. Weibel16 of the University of Michigan who foundthat much more consistent results could be obtained <strong>by</strong> the useof the extrapolation method than had been possible without it.For these reasons, the authors believe that a considerable improvementin the accuracy of stress concentration determinationis made possible <strong>by</strong> the use of this method.With regard to the use of circular lines engraved on the specimen,as suggested <strong>by</strong> Dr. Frocht, the authors believe this wouldbe of advantage in the case of fillets in tension or bending wherethe peak stress is at an unknown location along the fillet. In thecases tested <strong>by</strong> the authors, where the peak stress is always atthe minimum section, the use of a straight line proved to be verysatisfactory. It should be noted that it is rather difficult tomake a fine circular scratch concentric with the fillet or hole,unless a special tool is used, while it is very easy to inscribe astraight line. The authors found that, for best results, an extremelyfine scratch was desirable since if a coarse one were useda further error in estimating the center of the black line on thephotographs was introduced.With regard to Mr. Horger’s statement that design problemsinvolve two stress concentration factors, one due to shape <strong>and</strong>the other due to material, it may be of interest to note that incertain cases, particularly as regards large specimens of highstrength alloy steels, there appears to be some tendency for thefatigue stress concentration factors to approach those found <strong>by</strong>photoelastic or mathematical methods.17 In such cases, then,these two stress-concentration factors mentioned <strong>by</strong> Mr. Horgermay be considered as identical. The photoelastic test values, inthese instances, would then give information of direct value todesigners. The authors agree, however, that considerable additionalwork is desirable on these <strong>and</strong> similar questions.16 E. E. Weibel, “Studies in Photoelastic <strong>Stress</strong> Determination,”A.S.M.E. Trans., vol. 56, 1934, paper APM-56-13.17 Note especially the discussion <strong>by</strong> Mr. R. E. Peterson of Dr.Weibel’s paper, A.S.M.E. Trans., vol. 56, 1934, APM-56-13.