Test Results: Ford PCM Downloads Compared to Instrumented
Test Results: Ford PCM Downloads Compared to Instrumented
Test Results: Ford PCM Downloads Compared to Instrumented
- No tags were found...

You also want an ePaper? Increase the reach of your titles
YUMPU automatically turns print PDFs into web optimized ePapers that Google loves.
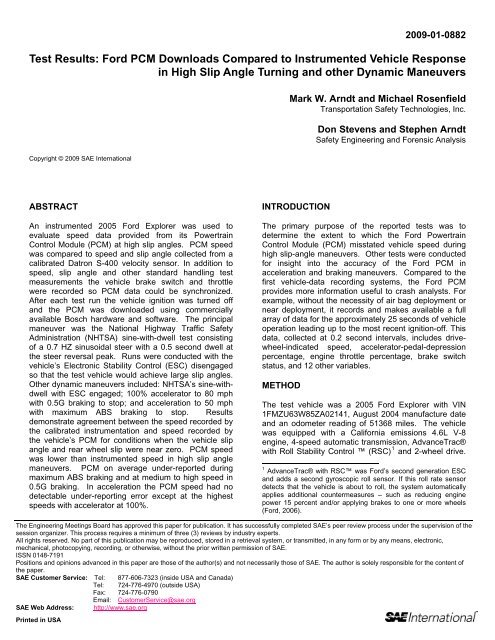
2009-01-0882<strong>Test</strong> <strong>Results</strong>: <strong>Ford</strong> <strong>PCM</strong> <strong>Downloads</strong> <strong>Compared</strong> <strong>to</strong> <strong>Instrumented</strong> Vehicle Responsein High Slip Angle Turning and other Dynamic ManeuversCopyright © 2009 SAE InternationalMark W. Arndt and Michael RosenfieldTransportation Safety Technologies, Inc.Don Stevens and Stephen ArndtSafety Engineering and Forensic AnalysisABSTRACTAn instrumented 2005 <strong>Ford</strong> Explorer was used <strong>to</strong>evaluate speed data provided from its PowertrainControl Module (<strong>PCM</strong>) at high slip angles. <strong>PCM</strong> speedwas compared <strong>to</strong> speed and slip angle collected from acalibrated Datron S-400 velocity sensor. In addition <strong>to</strong>speed, slip angle and other standard handling testmeasurements the vehicle brake switch and throttlewere recorded so <strong>PCM</strong> data could be synchronized.After each test run the vehicle ignition was turned offand the <strong>PCM</strong> was downloaded using commerciallyavailable Bosch hardware and software. The principalmaneuver was the National Highway Traffic SafetyAdministration (NHTSA) sine-with-dwell test consistingof a 0.7 HZ sinusoidal steer with a 0.5 second dwell atthe steer reversal peak. Runs were conducted with thevehicle’s Electronic Stability Control (ESC) disengagedso that the test vehicle would achieve large slip angles.Other dynamic maneuvers included: NHTSA’s sine-withdwellwith ESC engaged; 100% accelera<strong>to</strong>r <strong>to</strong> 80 mphwith 0.5G braking <strong>to</strong> s<strong>to</strong>p; and acceleration <strong>to</strong> 50 mphwith maximum ABS braking <strong>to</strong> s<strong>to</strong>p. <strong>Results</strong>demonstrate agreement between the speed recorded bythe calibrated instrumentation and speed recorded bythe vehicle’s <strong>PCM</strong> for conditions when the vehicle slipangle and rear wheel slip were near zero. <strong>PCM</strong> speedwas lower than instrumented speed in high slip anglemaneuvers. <strong>PCM</strong> on average under-reported duringmaximum ABS braking and at medium <strong>to</strong> high speed in0.5G braking. In acceleration the <strong>PCM</strong> speed had nodetectable under-reporting error except at the highestspeeds with accelera<strong>to</strong>r at 100%.INTRODUCTIONThe primary purpose of the reported tests was <strong>to</strong>determine the extent <strong>to</strong> which the <strong>Ford</strong> PowertrainControl Module (<strong>PCM</strong>) misstated vehicle speed duringhigh slip-angle maneuvers. Other tests were conductedfor insight in<strong>to</strong> the accuracy of the <strong>Ford</strong> <strong>PCM</strong> inacceleration and braking maneuvers. <strong>Compared</strong> <strong>to</strong> thefirst vehicle-data recording systems, the <strong>Ford</strong> <strong>PCM</strong>provides more information useful <strong>to</strong> crash analysts. Forexample, without the necessity of air bag deployment ornear deployment, it records and makes available a fullarray of data for the approximately 25 seconds of vehicleoperation leading up <strong>to</strong> the most recent ignition-off. Thisdata, collected at 0.2 second intervals, includes drivewheel-indicatedspeed, accelera<strong>to</strong>r-pedal-depressionpercentage, engine throttle percentage, brake switchstatus, and 12 other variables.METHODThe test vehicle was a 2005 <strong>Ford</strong> Explorer with VIN1FMZU63W85ZA02141, August 2004 manufacture dateand an odometer reading of 51368 miles. The vehiclewas equipped with a California emissions 4.6L V-8engine, 4-speed au<strong>to</strong>matic transmission, AdvanceTrac®with Roll Stability Control (RSC) 1 and 2-wheel drive.1 AdvanceTrac® with RSC was <strong>Ford</strong>’s second generation ESCand adds a second gyroscopic roll sensor. If this roll rate sensordetects that the vehicle is about <strong>to</strong> roll, the system au<strong>to</strong>maticallyapplies additional countermeasures – such as reducing enginepower 15 percent and/or applying brakes <strong>to</strong> one or more wheels(<strong>Ford</strong>, 2006).The Engineering Meetings Board has approved this paper for publication. It has successfully completed SAE’s peer review process under the supervision of thesession organizer. This process requires a minimum of three (3) reviews by industry experts.All rights reserved. No part of this publication may be reproduced, s<strong>to</strong>red in a retrieval system, or transmitted, in any form or by any means, electronic,mechanical, pho<strong>to</strong>copying, recording, or otherwise, without the prior written permission of SAE.ISSN 0148-7191Positions and opinions advanced in this paper are those of the author(s) and not necessarily those of SAE. The author is solely responsible for the content ofthe paper.SAE Cus<strong>to</strong>mer Service: Tel: 877-606-7323 (inside USA and Canada)Tel: 724-776-4970 (outside USA)Fax: 724-776-0790Email: Cus<strong>to</strong>merService@sae.orgSAE Web Address: http://www.sae.orgPrinted in USA
<strong>Ford</strong>’s AdvanceTrac® with RSC will be referred <strong>to</strong> asElectronic Stability Control (ESC) from this point forward.The tires were Michelin Cross Terrain P235/70R16inflated <strong>to</strong> 35 PSI at the front and rear. The tires weremounted <strong>to</strong> alloy OEM 16X7 rims with a 44 mm offset.Prior <strong>to</strong> fitment for testing the vehicle was researched,inspected and measured by a certified body shop <strong>to</strong>assure no prior collision or major repair and res<strong>to</strong>red orrepaired <strong>to</strong> compliance with OEM specification by acertified mechanic.As tested, the vehicle’s weight was 4867 lbs (F/R:2515/2352). This included the driver (175 lbs) and theinstrumentation (77.5 lbs) which was placed on the rightfront seat. The vehicle was fitted with an AB Dynamicssteering robot. Calibrated instruments measured speed,slip angle and yaw rate. In addition, wheel brake linepressure, brake switch status, <strong>PCM</strong> - vehicle speedoutput (<strong>PCM</strong> - VSO) and accelera<strong>to</strong>r pedal position weresimultaneously recorded at 200Hz. Brake switch statuswas moni<strong>to</strong>red through a wire connected <strong>to</strong> a switch atthe brake pedal. Gas pedal position was moni<strong>to</strong>red fromthe vehicle’s pedal potentiometer. <strong>PCM</strong> - VSO wasmoni<strong>to</strong>red by feeding the <strong>PCM</strong> pulse output signal 2through a DataForth isolation/conversion module.Velocity was measured with a Datron S-400 velocitysensor and a VBOX20SL Differential GPS datalogger.The Datron S-400 velocity sensor is an optical sensorthat measures longitudinal and lateral velocity every4ms, calculates slip angle over a range of ±40 degreesand provides an analog output. The Datron S-400 wasprogrammed at the default setting <strong>to</strong> preprocess datausing a 32 point moving average. Correction for Centerof Gravity (CG) offset and time delay was made <strong>to</strong> theDatron velocity and slip angle measurements asdescribed by the instrument’s manufacturer (Haus,2002; Neudecker, 2004). The VBOX20SL DifferentialGPS datalogger is a vehicle speed sensor which uses aGPS engine <strong>to</strong> calculate vehicle speed 20 times asecond using the Doppler effect (frequency shift of theGSP satellite carrier signal). The output is notinterpolated, and represents a true 20Hz update of thevehicle's speed. The VBOX Speed sensor is designed <strong>to</strong>output velocity as an analog voltage. The VBOX20SL’santennas were mounted on the roof over the vehicle'sCG. A 31.5ms time correction was applied <strong>to</strong> the VBOXdata for time delays due <strong>to</strong> processing latenciesdescribed by the instrument’s manufacturer (Lau, 2008).Signals from all instruments, velocity sensors andvehicle circuits were recorded with an onboard dataacquisition system at 200 samples per second. Velocityand slip angle data from the onboard instrumentationwere post processed with a 6Hz, 12-pole, phaselessdigital Butterworth filter and zeroed.Figure 1. Sine-with-dwell steer profile.Prior <strong>to</strong> tire break-in and testing, tire pressures were set<strong>to</strong> the manufacturer’s recommended 35 PSI pressure atthe front and rear. Tires were broken-in using pro<strong>to</strong>coldictated by the National Highway Traffic SafetyAdministration’s (NHTSA’s) New Car AssessmentProgram (NCAP) fishhook test procedure. The sametires were used in all testing and were not rotated orchanged. Tire pressure was moni<strong>to</strong>red but not changed<strong>to</strong> ensure that no pressure loss occurred from test <strong>to</strong>test.The test maneuver used for the high slip angle speedcomparison was NHTSA’s 0.7 Hz, sine-with-dwellmaneuver (NHTSA, 2006). The AB Dynamics steeringrobot generated the same steering inputs for each runwhile the driver controlled the initial speed. The steermagnitude was 174.9 degrees. <strong>Test</strong>s were conducted at50 mph and throttle was dropped prior <strong>to</strong> steer initiation.The maneuver was chosen because it was known <strong>to</strong>cause yaw response associated with spinout 3 withoutthe intervention of ESC. Steer magnitude wasdetermined by conducting pre-tests with ESC off atincrementally greater steer magnitudes until spinou<strong>to</strong>ccurred. Figure 1 shows the steer profile. The pretestsare lettered F, G and H and results were notanalyzed or presented. Three identical tests wereconducted with ESC off. The ESC off condition wasproduced by turning off the stability control switch on thevehicle console. Non-actuation of the system wasconfirmed by observing the warning lamp in theinstrument cluster and by moni<strong>to</strong>ring individual wheelbrake line pressures.2 The <strong>PCM</strong>-VSO is moni<strong>to</strong>red by wiring <strong>to</strong> pin C175B pin 1 ckt 679(GY/BK) VSS + (middle connec<strong>to</strong>r) on the <strong>PCM</strong>. This was a pulseoutput, and the conversion module changed this <strong>to</strong> a voltage.3 Spin out was defined as the failure of a vehicle’s measured yawrate <strong>to</strong> drop below 35 percent and 20 percent of its peak at 1seconds and 1.75 seconds, respectively. Time zero was thesteering wheel’s return <strong>to</strong> zero (NHTSA, 2006).
A listing of all tests is provided in Table 1. Otherconducted tests included:• Three (3) tests with ESC on with identical speedand steer <strong>to</strong> the ESC off maneuvers,• three (3) tests with ABS engaged from 60 mph<strong>to</strong> nominally 80 mph including phases with theaccelera<strong>to</strong>r pedal at 100% followed by braking<strong>to</strong> s<strong>to</strong>p at a nominal deceleration of 0.5G and• three (3) tests with ABS engaged <strong>to</strong> 50 mph atapproximately 0.2G acceleration followed bymaximum braking <strong>to</strong> full s<strong>to</strong>p.All tests were conducted on flat roadway and parking lotsurfaces at the Southwestern International Racewaynear Tucson, Arizona. <strong>Test</strong>ing at high slip angles andmax braking were conducted on a flat asphalt surfacewith 0.9 or greater friction, determined pursuant <strong>to</strong> theASTM surface friction characterization pro<strong>to</strong>col. Thehighway speed tests were conducted on a straight andlevel high coefficient of friction roadway with a traveledasphalt surface.At the conclusion of each test run the ignition was turnedoff, preserving the last 25 seconds of s<strong>to</strong>red accessibledata in the <strong>PCM</strong>. <strong>PCM</strong> data was downloaded usingcommercially available Bosch hardware and software.The data was then time-corrected from its raw form.Time synchronization of the <strong>PCM</strong> data with thecalibrated instrumentation data was performed bycomparing the brake switch status signals for each dataset. In both data sets, brake switch status wasBoolean, either “on” or “off”. The instrumentationrecorded data at 0.005 second intervals, 40 times therate of the <strong>PCM</strong>. At brake application, the moni<strong>to</strong>redbrake circuit voltage dropped from approximately fivevolts <strong>to</strong> zero volts in less than 0.01 seconds (one or twotime steps). In the <strong>PCM</strong> data the switch status changesduring 0.2 seconds. The two data streams weresynchronized by aligning the time of the last indication ofbrakes-off in the <strong>PCM</strong> data plus 0.1 seconds with thetime of the last indication of brakes-off in the unfilteredmoni<strong>to</strong>red brake circuit data.The synchronizing method had a potential error of ±0.1seconds. The synchronizing method was similar <strong>to</strong> priorpublished work (Ruth, 2008) except aftersynchronization was established the prior 20 calibratedvelocity data points were not averaged. The highersample rate of the calibrated instruments produced 40speed measurements for every <strong>PCM</strong> measurement.Because dynamic tests were conducted and thepotential for up <strong>to</strong> ±0.1 seconds of synchronization error,uncertainty in the calibrated speed measurement forcomparison <strong>to</strong> the <strong>PCM</strong> speed measurement occurred.For example: the calculated speed change at 0.8Gbraking in 0.1 seconds was 1.75 mph (2.82 kph). Inaddition <strong>to</strong> the uncertainty associated with the syncTable 1. List of tests.error, there were minor, but cumulative uncertaintiesassociated with the accuracy of the calibrated instrument(0.1%) and the vehicle speed sensor (measured <strong>to</strong>1/128 of a mile per hour and reported <strong>to</strong> a resolution of0.1 mph.) The resulting uncertainty was called thespeed sync uncertainty and the <strong>PCM</strong> speed error syncuncertainty. The sync uncertainty effectively forms aspeed sync uncertainty band around the calibratedspeed measurement determined by finding the minimumand maximum speed from the prior 20 and following 19calibrated speed measurements.The <strong>PCM</strong> speed error was calculated by subtractingcalibrated speed from <strong>PCM</strong> speed at the sync time(<strong>PCM</strong> speed error = <strong>PCM</strong> speed - calibrated speed).The <strong>PCM</strong> speed error sync uncertainty was determinedfrom the difference between the calibrated speed andthe minimum and maximum speed of correspondingspeed sync uncertainty at the sync time. Negativespeed difference indicates less than the calibratedspeed. <strong>PCM</strong> speed error was not calculated atcalibrated speeds below 5 mph because as the vehiclestarts and comes <strong>to</strong> a s<strong>to</strong>p, pitching and other fac<strong>to</strong>rsinfluencing the instruments introduced measured speedand slip angle values that did not represent the truemotion of the vehicle.
One purpose of the testing was the evaluation of acorrection fac<strong>to</strong>r for <strong>PCM</strong> speeds in high slip angle tests.Thus, the correction fac<strong>to</strong>r: corrected <strong>PCM</strong> speed =<strong>PCM</strong> speed / COS(slip angle), was applied <strong>to</strong> the <strong>PCM</strong>speed in the high slip angle tests. This method ofinterpreting tire motion and forces was consistent withreconstruction methods described by Orlowski(Orlowski, 1987) and restated by Martinez (Martinez,1996) in which a correction fac<strong>to</strong>r is utilized <strong>to</strong> calculatethe drag of a freely rotating (no brakes applied) tire whena vehicle is side slipping: ueff = u * sin(slip angle)(where, ueff is the coefficient of friction from the lateralcomponent of tire forces and u is the sliding frictionbetween the road and tire). Since the rear tire is alignedwith the longitudinal axis of the vehicle and its free (nobrakes applied) rotation rate is proportional <strong>to</strong> the <strong>PCM</strong>speed measured at the output of the transmission, the<strong>PCM</strong> output speed is assumed equal <strong>to</strong> the longitudinalvehicle velocity component.RESULTSBoth a Datron S-400 and a VBOX20SL Differential GPSfor measuring speed and slip angle were used in testing;however, after analysis only Datron calibrated speedwas used. Speed reported by the VBox was essentiallyidentical <strong>to</strong> the Datron for all conditions in all tests. TheDatron was chosen for numerous reasons including: intwo of the high slip angle tests the recorded slip anglefrom the VBox differed substantially from the Datron anddiscussion with instrument manufacturers did not explaindifferences; The raw recorded signals of the Datronwere within its specified linear range of operation; therewas a general familiarity and usage his<strong>to</strong>ry with theDatron; and finally, the Datron had a generalacceptability in vehicle handling testing and a calibrationrecord traced <strong>to</strong> international standard.A chart of calibrated Datron speed and <strong>PCM</strong> speedversus time and a chart of <strong>PCM</strong> speed error versus timefor all tests utilized in the analysis presented in thispaper are in the Appendix. The charts with speedsversus time also display the speed sync uncertainty asupper and lower bands about the calibrated speed line.The Charts with <strong>PCM</strong> speed error also display thedifference in minimum and maximum speed associatedwith the speed sync uncertainty. Interpretation of theupper and lower lines on the chart with <strong>PCM</strong> speed errorwas: <strong>PCM</strong> speed error was detectable for results thatfall above or below the lines of <strong>PCM</strong> speed error syncuncertainty. Detectable <strong>PCM</strong> speed error was thedifference between <strong>PCM</strong> speed error and thecorresponding <strong>PCM</strong> speed error sync uncertainty at thesync time.HIGH SLIP ANGLE WITHOUT ESC - The charts in theAppendix for high slip angle without ESC tests, I-1701,J-1702 and N-1706, showed the highest speed errorsoccurred at high slip angles. When the <strong>PCM</strong> speed wasdivided by the cosine of the slip angle, the resulting errorcompared <strong>to</strong> the instrumentation speed generally fellwithin the speed sync uncertainty for the time ofincreasing slip angle. The quality of correction and thestability of speed sync uncertainty for decreasing slipangle was lower and probably caused by inaccuracies inthe measured slip angle due <strong>to</strong> vehicle oscillationscaused by wheel hopping, body roll and other motionsgenerated during the decreasing slip angle phase of theside slipping vehicle.The maximum measured <strong>PCM</strong> speed error was -5.44mph (-8.75 kph) in test J-1702 in a decreasing slip anglephase at 15.6 mph (25.1 kph) and 18.7 degrees slipangle. The maximum recorded <strong>PCM</strong> speed error in adecreasing slip angle phase should be discountedbecause of vehicle oscillations that influenced velocitiesrecorded by the Datron sensors. The maximum <strong>PCM</strong>speed error during an increasing slip angle phase was-4.60 mph (-7.40 kph) in test J-1702 at 27.1 mph (43.6kph) and 33.3 degrees slip angle. The maximumdetectable <strong>PCM</strong> speed error was -3.67 mph (-5.91 kph)in test N-1706 in an increasing slip angle phase at 29.9mph (48.1 kph) and 33.2 degrees slip angle. The firsttest, I-1701, had a speed signal drop that was probablyassociated with the Datron’s optical sensors moving <strong>to</strong>ofar from the ground and out of its operating range atpeak slip angle.HIGH SLIP ANGLE WITH ESC - The charts for sinewith-dwelltests with ESC engaged are shown in theAppendix K-1703, L-1704 and M-1705. In addition <strong>to</strong>the substantial ESC effect on preventing oversteer,these charts show the momentary discontinuity in <strong>PCM</strong>speed due <strong>to</strong> ESC interventions. The ESC interventionapplied individual wheel brake’s causing slipping of therear tires. With ESC enabled the maximum <strong>PCM</strong> speederror was -6.24 mph (-10.04 kph) in test M-1705 at 37.0mph (59.3 kph) and 10.3 degree slip angle. Themaximum detectable <strong>PCM</strong> speed error was at the sameFigure 2. Analysis of <strong>PCM</strong> speed error in 60 mph <strong>to</strong> 80 mph at100% accelera<strong>to</strong>r.
Figure 3. Analysis of <strong>PCM</strong> speed error in 80 mph <strong>to</strong> 5 mphbraking at 0.5G.point and was -5.03 mph (-8.09 kph). If the six datapoints obviously associated with ESC intervention wereeliminated, the maximum <strong>PCM</strong> speed error was -2.44mph (-3.93 kph) in test L-1704 at 41.0 mph (65.98 kph)and 7.9 degree slip angle. The maximum detectable<strong>PCM</strong> speed error was at the same point and was -1.13mph (-1.82 kph).80 MPH ACCELERATING AND BRAKING DYNAMICMANEUVERS - Analysis of the braking and acceleratingdynamic maneuvers plotted <strong>PCM</strong> speed error versuscalibrated speed. Since each of these dynamicmaneuvers was at a nominally constantacceleration/deceleration rate, <strong>PCM</strong> speed error syncuncertainty was plotted as a value representing the 85thpercentile of the <strong>PCM</strong> speed error sync uncertaintyvariance. Plotted <strong>PCM</strong> speed error values that liebetween the upper and lower bounds have nodetectable error, whereas plotted <strong>PCM</strong> speed errorvalues that lie below the lower bound and above theupper bound are referred <strong>to</strong> as detectable speed errors.The 80 mph tests included phases with the accelera<strong>to</strong>rpedal at 100%, followed by braking <strong>to</strong> s<strong>to</strong>p at a nominaldeceleration of 0.5G, and were analyzed for thesephases. The first phase was during acceleration fromnominally 60 mph <strong>to</strong> 80 mph when the accelera<strong>to</strong>r pedalwas recorded at 100% by the <strong>PCM</strong>. Analysis is shownin Figure 2. In the acceleration phase from 60 mph <strong>to</strong> 80mph at 100% accelera<strong>to</strong>r the <strong>PCM</strong> speed error wasbelow the 85th percentile <strong>PCM</strong> speed error syncuncertainty upper bound for all readings and above thelower bound except for some readings above 73.7 mph(118.6 kph). A linear relationship between <strong>PCM</strong> speedand calibrated speed was determined for the speedFigure 4. Analysis of <strong>PCM</strong> speed error in 5 mph <strong>to</strong> 50 mph at0.2G acceleration.range of 60 mph <strong>to</strong> 80 mph as: calibrated speed (mph) =1.04 * <strong>PCM</strong> speed - 2.53 mph, R² = 0.999. A linearrelationship forced through zero intercept wasdetermined as: calibrated speed (mph) = <strong>PCM</strong> speed, R 2= 0.998. The maximum <strong>PCM</strong> speed error was -0.83mph (-1.34 kph) in test C-1202 at 79.8 mph (128.4 kph).The maximum detectable <strong>PCM</strong> speed error was -0.67mph (-1.08 kph) in test D-1203 at 79.4 mph (127.8 kph).The second phase was continuous braking from 80 mph<strong>to</strong> s<strong>to</strong>p at a nominal deceleration of 0.5G. Analysis isshown in Figure 3. For the entire speed range duringthe 0.5G braking, calculated <strong>PCM</strong> speed error wasdetectable below the <strong>PCM</strong> speed error sync uncertainty.A linear relationship between <strong>PCM</strong> speed and calibratedspeed was determined for the speed range of 80 mph <strong>to</strong>5 mph as: calibrated speed (mph) = 1.04 * <strong>PCM</strong> speed +0.60 mph, R 2 = 0.999. A linear relationship forcedthrough zero intercept was determined as: calibratedspeed (mph) = 1.05 * <strong>PCM</strong> speed, R 2 = 0.999. Themaximum <strong>PCM</strong> speed error was -5.38 mph (-8.67 kph)in test E-1204 at 69.3 mph (111.5 kph). The maximumdetectable <strong>PCM</strong> speed error was at the same point andwas -4.34 mph (-6.98 kph).50 MPH ACCELERATING AND MAXIMUM BRAKINGDYNAMIC MANEUVERS - <strong>Test</strong>s involving acceleration<strong>to</strong> 50 mph followed by maximum ABS braking <strong>to</strong> full s<strong>to</strong>pwere also analyzed in two phases. Analysis below 5mph was not conducted. The first phase wasacceleration from 0 mph <strong>to</strong> nominally 50 mph atapproximately 0.2G. The accelera<strong>to</strong>r pedal wasrecorded by the <strong>PCM</strong> in the range of 29.0% <strong>to</strong> 52.5%.Analysis is shown in Figure 4. In the acceleration phaseof the 50 mph tests, the <strong>PCM</strong> speed error was above the
85th percentile <strong>PCM</strong> speed error sync uncertainty lowerbound for all readings. The <strong>PCM</strong> speed error was belowthe 85th percentile <strong>PCM</strong> speed error sync uncertaintyupper bound for all but six readings. The maximumdetectable <strong>PCM</strong> speed error above the 85th percentile<strong>PCM</strong> speed error sync uncertainty was 0.09 mph (0.14kph) in test O-1205 at 23.8 mph (38.2 kph). Theseresults showed a relationship where <strong>PCM</strong> speedequaled calibrated speed.The second phase was the maximum ABS brakingphase from nominally 50 mph <strong>to</strong> s<strong>to</strong>p. The charts in theAppendix, O-1205, P-1206 and Q-1207 - show theresults. In the maximum ABS braking phase, the <strong>PCM</strong>speed error was below the 85th percentile <strong>PCM</strong> speederror sync uncertainty upper bound for all readings andthe maximum <strong>PCM</strong> speed error was -5.30 mph (-8.53kph) in test O-1205 at 24.7 mph (39.8 kph). Themaximum detectable <strong>PCM</strong> speed error was at the samepoint and was -3.7 mph (-6.0 kph). The second andthird largest <strong>PCM</strong> speed errors were -4.58 mph (-7.37kph) in test P-1206 at 39.2 mph (63.1 kph) and -4.37mph (-7.03 kph) in test O-1205 at 10.1 mph (16.3 kph),respectively. The average <strong>PCM</strong> speed error was -2.35mph (-3.78 kph). The average detectable <strong>PCM</strong> speederror was -1.35 mph (-2.17 kph). For the entire range oftest speeds some of the <strong>PCM</strong> speed errors were withinthe <strong>PCM</strong> speed error sync uncertainty. A possible <strong>PCM</strong>speed error of -4 mph (-7 kph) was measured inmaximum ABS braking.DISCUSSIONIn this study, results reported as detectable <strong>PCM</strong> speederror were preferred <strong>to</strong> results reported as <strong>PCM</strong> speederror with a +/- uncertainty. Since uncertainty wasassociated with synchronization of the two signals,reporting an uncertainty in the speed error may havemisrepresented the accuracy of the <strong>PCM</strong>. Uncertaintywas caused by an artifact of the test and analysis versusa know deficit in the <strong>PCM</strong> speed.<strong>Test</strong>s with ESC turned off resulted in transient oversteer.Oversteer was recorded in yaw rate and slip angle andresulted in greater roll angles and complex oscilla<strong>to</strong>rybehavior of the vehicle. The effect of oscilla<strong>to</strong>ry vehiclemotions was best observed in the decreasing slip anglephase of speed and slip angle plots for tests I-1701, J-1702 and N-1706. <strong>Test</strong> J-1702 resulted in an outriggercontact. The testing did not characterize the handling orrollover performance of the vehicle with or without ESCsince tire changing and test sequencing procedureswere not utilized. The speed and slip angle record fortest I-1701 had a drop that was probably associated withthe Datron optical sensor moving <strong>to</strong>o far from the groundand out of its operating range due <strong>to</strong> the vehicle’soversteer induced roll and oscilla<strong>to</strong>ry motions.The correction applied <strong>to</strong> <strong>PCM</strong> speed of the without ESCvehicle in the turn induced high slip angle tests wasconsistent with the method for analyzing effectivevehicle deceleration in non-braked high slip angle speedreconstruction. The correction improved <strong>PCM</strong> speed inthe increasing slip angle phase of the test when vehicleoscillations did not influence velocity sensor’s motionand measured vehicle speeds. Reconstruction slipangle analysis based upon tire mark measurementsprobably would effectively damp the measured vehicleoscillation in decreasing slip angle motion, and mayimprove a correction in this application. Applying a slipangle correction <strong>to</strong> <strong>PCM</strong> recorded speeds for vehicleswithout ESC should increase accuracy of <strong>PCM</strong> speed forportions of vehicle motion when the slip angle isincreasing and absent braking.In testing with ESC enabled, speed error was associatedwith ESC intervention. The <strong>Ford</strong> Explorer involved in thetest was equipped with RSC, which was a secondgeneration ESC system that may provide a moreaggressive intervention. It is not known if the speederrors from the subject vehicle with ESC actuation wouldbe expected for all vehicles with ESC. Correction ofspeed error with ESC did not improve the <strong>PCM</strong> speedbecause the speed error is associated with wheel slipfrom brake applications in the ESC intervention. <strong>PCM</strong>speed from vehicles with ESC in aggressive turninduced maneuvers should be evaluated withconsideration <strong>to</strong> ESC intervention related error. A <strong>Ford</strong><strong>PCM</strong> download which provides recorded speed every0.2 seconds appears <strong>to</strong> provide enough data that anaccurate speed trend can be discriminated.Analysis of maximum braking with ABS tests showed themaximum detectable <strong>PCM</strong> speed error was -3.7 mph(-6.0 kph) at 24.7 mph (39.8 kph) and that a -4 mph (-7kph) <strong>PCM</strong> speed error was measured at a variety ofinstances along the 50 mph <strong>to</strong> 5 mph speed range. Themaximum detectable percent error was -15.0% at 24.7mph (39.8 kph). <strong>Results</strong> reported by Reust (2008)described <strong>PCM</strong> speeds underreported during maximumbrake application with an ABS system by approximately0.5% <strong>to</strong> 14.3% for <strong>PCM</strong> speeds of 20 mph or higher.For all testing, most of the calculated <strong>PCM</strong> speed errorswere within bands of uncertainty or below. Thisoccurrence was consistent with the operation of acalibrated vehicle speed sensor that operates bysensing rotation at the output of the transmission. Thesix positive speed errors measured above the 85thpercentile <strong>PCM</strong> speed error sync uncertainty upperbound in the 5 mph <strong>to</strong> 50 mph tests at approximately0.2G acceleration were less than 0.5%, 0.09 mph (0.14kph) in test O-1205 at 23.8 mph (38.2 kph). The verysmall positive detectable <strong>PCM</strong> speed errors in the 0.2Gacceleration are also due <strong>to</strong> the relatively narrow band ofspeed sync uncertainty associated with low decelerationand low acceleration dynamics. Some additional positive<strong>PCM</strong> speed errors were detected; however these errorsprincipally appear <strong>to</strong> be associated with transitionscaused by accelera<strong>to</strong>r or brake application and/or mayoccur randomly. The 5 sample per second rate of the
<strong>Ford</strong> <strong>PCM</strong> should allow for discrimination of significantspeed errors.ACKNOWLEDGMENTSReviewers of this paper are acknowledged for theirsubstantial contribution <strong>to</strong> improved interpretation andpresentation of the test results.REFERENCES<strong>PCM</strong> speed error sync uncertainty - The differencebetween the calibrated speed at sync time and theminimum and maximum speed of corresponding speedsync uncertainty.Detectable <strong>PCM</strong> speed error - The difference betweena corresponding <strong>PCM</strong> speed error sync uncertainty and<strong>PCM</strong> speed error.APPENDIX1. <strong>Ford</strong> Mo<strong>to</strong>r Co., (January 19, 2006), http://media.ford.com/article_display.cfm?article_id=20679.2. Haus, J., (2002), “Slip Angle Measurement with anS-sensor and a yaw rate sensor,” Corrsys-Datron,EW-B-02-0016.3. Neudecker, Frank, (June 25, 2004), “The Influenceof Signal Smoothing Filters on Brake <strong>Test</strong>Accuracy,” Corrsys-Datron, VT-TR-001.4. National Highway Traffic Safety Administration,(September 2006), “Development of ElectronicStability Control (ESC) Performance Criteria,” DOTHS 809 974.5. Orlowski, K., (March 1989), “Reconstruction ofRollover Collisions,” SAE 890857.6. Martinez, E., (1996), “A Primer on theReconstruction and Presentation of RolloverAccidents,” SAE 960647.7. Lau, J., (May 8, 2008), Personal Correspondence.8. Ruth, R., (2008, Spring), “Dynamic accuracy ofPowertrain Control Module (<strong>PCM</strong>) Event DataRecorders During ABS Braking,” Collision, pp. 44-47.9. Ruest, T., (2008, Spring), “The Accuracy of Speedrecorded by a <strong>Ford</strong> <strong>PCM</strong> and the Effect of Brake,Yaw and Other Fac<strong>to</strong>rs,” Collision, pp. 48-51, 58, 59.CONTACTMark W. ArndtTransportation Safety Technologies, Inc.1725 E. Hermosa Vista DriveMesa, AZ 85203480-964-9266marndt@transport-safety.comDEFINITIONS, ACRONYMS, ABBREVIATIONS<strong>PCM</strong> speed error - The difference between <strong>PCM</strong> speedand calibrated Datron speed at the sync time.Calculated by subtracting calibrated speed from <strong>PCM</strong>speed at the sync time (<strong>PCM</strong> speed error = <strong>PCM</strong> speed- calibrated speed.)Speed sync uncertainty - Determined by finding theminimum and maximum calibrated speed from the prior20 and following 19 calibrated speed measurements (-0.100 seconds <strong>to</strong> +0.095 seconds) at sync time for each0.2 second <strong>PCM</strong> interval.
Appendix. <strong>Test</strong> I-1701.
Appendix. <strong>Test</strong> J-1702.
Appendix. <strong>Test</strong> N-1706.
Appendix. <strong>Test</strong> K-1703.
Appendix. <strong>Test</strong> L-1704.
Appendix. <strong>Test</strong> M-1705.
Appendix. <strong>Test</strong> C-1202.
Appendix. <strong>Test</strong> D-1203.
Appendix. <strong>Test</strong> E-1204.
Appendix. <strong>Test</strong> O-1205.
Appendix. <strong>Test</strong> P-1206.
Appendix. <strong>Test</strong> Q-1207.