C166/ST10 CrossView Pro Debugger User's Manual - Tasking
C166/ST10 CrossView Pro Debugger User's Manual - Tasking
C166/ST10 CrossView Pro Debugger User's Manual - Tasking
- No tags were found...

You also want an ePaper? Increase the reach of your titles
YUMPU automatically turns print PDFs into web optimized ePapers that Google loves.
MA019−041−00−00Doc. ver.: 10.164<strong>C166</strong>/<strong>ST10</strong> v8.7<strong>CrossView</strong> <strong>Pro</strong> <strong>Debugger</strong>User’s <strong>Manual</strong>
A publication ofAltium BVDocumentation DepartmentCopyright © 2007 Altium BVAll rights reserved. Reproduction in whole or part is prohibitedwithout the written consent of the copyright owner.TASKING is a brand name of Altium Limited.The following trademarks are acknowledged:FLEXlm is a registered trademark of Macrovision Corporation.Intel is a trademark of Intel Corporation.Motorola is a trademark of Motorola, Inc.MS−DOS and Windows are registered trademarks of Microsoft Corporation.IBM is a trademark of International Business Machines Corp.SUN is a trademark of Sun Microsystems, Inc.UNIX is a registered trademark of X/Open Company, Ltd.All other trademarks are property of their respective owners.Data subject to alteration without notice.http://www.tasking.comhttp://www.altium.com
CONTENTSIVTable of ContentsCONTENTS
Table of ContentsVOVERVIEW1−11.1 Introduction . . . . . . . . . . . . . . . . . . . . . . . . . . . . . . . . . 1−31.2 <strong>CrossView</strong> <strong>Pro</strong>’s Features . . . . . . . . . . . . . . . . . . . . . . 1−31.3 Source Level Debugging . . . . . . . . . . . . . . . . . . . . . . . 1−81.4 How <strong>CrossView</strong> <strong>Pro</strong> Works . . . . . . . . . . . . . . . . . . . . 1−91.5 <strong>C166</strong>/<strong>ST10</strong> <strong>Pro</strong>gram Development . . . . . . . . . . . . . . 1−111.6 Getting Started . . . . . . . . . . . . . . . . . . . . . . . . . . . . . . . 1−131.6.1 Before Starting . . . . . . . . . . . . . . . . . . . . . . . . . . . . . . . 1−131.6.2 Setting Up the Execution Environment . . . . . . . . . . . 1−141.6.3 Starting <strong>CrossView</strong> <strong>Pro</strong> . . . . . . . . . . . . . . . . . . . . . . . . 1−151.6.3.1 <strong>CrossView</strong> <strong>Pro</strong> Target Settings . . . . . . . . . . . . . . . . . . 1−161.6.3.2 Configuring <strong>CrossView</strong> <strong>Pro</strong> . . . . . . . . . . . . . . . . . . . . 1−241.6.3.3 Loading Symbolic Debug Information . . . . . . . . . . . 1−251.6.4 Executing an Application . . . . . . . . . . . . . . . . . . . . . . 1−281.6.5 Debugging an Application . . . . . . . . . . . . . . . . . . . . . 1−301.6.6 <strong>CrossView</strong> <strong>Pro</strong> Output . . . . . . . . . . . . . . . . . . . . . . . . 1−321.6.7 Exiting <strong>CrossView</strong> <strong>Pro</strong> . . . . . . . . . . . . . . . . . . . . . . . . . 1−331.6.8 What You May Have Done Wrong . . . . . . . . . . . . . . 1−341.6.9 Building Your Executable . . . . . . . . . . . . . . . . . . . . . . 1−351.6.9.1 Using EDE . . . . . . . . . . . . . . . . . . . . . . . . . . . . . . . . . . 1−351.6.9.2 Using the Control <strong>Pro</strong>gram . . . . . . . . . . . . . . . . . . . . . 1−421.6.9.3 Using the Makefile . . . . . . . . . . . . . . . . . . . . . . . . . . . . 1−45SOFTWARE INSTALLATION2−12.1 Introduction . . . . . . . . . . . . . . . . . . . . . . . . . . . . . . . . . 2−32.2 Note about Filenames . . . . . . . . . . . . . . . . . . . . . . . . . 2−32.3 Configuring the X Windows Motif Environment . . . 2−32.4 Using X Resources . . . . . . . . . . . . . . . . . . . . . . . . . . . . 2−4COMMAND LANGUAGE3−13.1 Introduction . . . . . . . . . . . . . . . . . . . . . . . . . . . . . . . . . 3−33.2 <strong>CrossView</strong> <strong>Pro</strong> Expressions . . . . . . . . . . . . . . . . . . . . 3−33.3 Constants . . . . . . . . . . . . . . . . . . . . . . . . . . . . . . . . . . . 3−4• • • • • • • •
Table of ContentsVII4.7.2 Mouse/Menu/Command Equivalents . . . . . . . . . . . . 4−394.8 Using the On−line Help . . . . . . . . . . . . . . . . . . . . . . . 4−404.8.1 Accessing On−line Help . . . . . . . . . . . . . . . . . . . . . . . 4−404.8.2 Using MS−Windows Help . . . . . . . . . . . . . . . . . . . . . . 4−40CONTROLLING PROGRAM EXECUTION5−15.1 Source Positioning . . . . . . . . . . . . . . . . . . . . . . . . . . . . 5−35.1.1 Changing the Viewing Position . . . . . . . . . . . . . . . . . 5−45.1.2 Changing the Execution Position . . . . . . . . . . . . . . . 5−55.1.3 Synchronizing the Execution and Viewing Positions 5−75.2 Controlling <strong>Pro</strong>gram Execution . . . . . . . . . . . . . . . . . 5−85.2.1 Starting the <strong>Pro</strong>gram . . . . . . . . . . . . . . . . . . . . . . . . . . 5−85.2.2 Halting and Continuing Execution . . . . . . . . . . . . . . 5−95.2.3 Single−Step Execution . . . . . . . . . . . . . . . . . . . . . . . . . 5−95.2.4 Stepping through at the Machine Level . . . . . . . . . . 5−125.3 Notes About <strong>Pro</strong>gram Execution . . . . . . . . . . . . . . . . 5−145.4 Searching through the Source Window . . . . . . . . . . 5−145.4.1 Searching for a Function . . . . . . . . . . . . . . . . . . . . . . . 5−145.4.2 Searching for a String . . . . . . . . . . . . . . . . . . . . . . . . . 5−155.4.3 Jumping to a Source Line . . . . . . . . . . . . . . . . . . . . . . 5−16ACCESSING CODE AND DATA6−16.1 Introduction . . . . . . . . . . . . . . . . . . . . . . . . . . . . . . . . . 6−36.2 Accessing Variables . . . . . . . . . . . . . . . . . . . . . . . . . . . 6−36.2.1 Viewing Variables, Structures and Arrays . . . . . . . . . 6−36.2.2 Changing Variables . . . . . . . . . . . . . . . . . . . . . . . . . . . 6−76.2.3 The l Command . . . . . . . . . . . . . . . . . . . . . . . . . . . . . . 6−106.3 Expressions . . . . . . . . . . . . . . . . . . . . . . . . . . . . . . . . . 6−116.3.1 Evaluating Expressions . . . . . . . . . . . . . . . . . . . . . . . . 6−116.3.2 Monitoring Expressions . . . . . . . . . . . . . . . . . . . . . . . 6−126.3.3 Formatting Data . . . . . . . . . . . . . . . . . . . . . . . . . . . . . . 6−146.3.4 Displaying Memory . . . . . . . . . . . . . . . . . . . . . . . . . . . 6−156.3.5 Displaying Memory Addresses . . . . . . . . . . . . . . . . . . 6−17• • • • • • • •
VIIITable of Contents6.4 Displaying Disassembled Instructions . . . . . . . . . . . . 6−186.4.1 Intermixed Source and Disassembly . . . . . . . . . . . . . 6−196.5 The Stack . . . . . . . . . . . . . . . . . . . . . . . . . . . . . . . . . . . 6−206.5.1 How the Stack is Organized . . . . . . . . . . . . . . . . . . . . 6−206.5.2 The Stack Window . . . . . . . . . . . . . . . . . . . . . . . . . . . 6−216.5.3 Listing Locals and Parameters of a Function . . . . . . 6−236.5.4 Low−level Viewing the Stack . . . . . . . . . . . . . . . . . . . 6−236.6 Trace Window . . . . . . . . . . . . . . . . . . . . . . . . . . . . . . . 6−256.6.1 Trace Window Setup . . . . . . . . . . . . . . . . . . . . . . . . . . 6−256.7 Register Window . . . . . . . . . . . . . . . . . . . . . . . . . . . . . 6−276.7.1 Register Window Setup . . . . . . . . . . . . . . . . . . . . . . . . 6−276.7.2 Editing Registers . . . . . . . . . . . . . . . . . . . . . . . . . . . . . 6−29BREAKPOINTS AND ASSERTIONS7−1CONTENTS7.1 Introduction to Breakpoints . . . . . . . . . . . . . . . . . . . . 7−37.1.1 Code Breakpoints . . . . . . . . . . . . . . . . . . . . . . . . . . . . 7−37.1.2 Data Breakpoints . . . . . . . . . . . . . . . . . . . . . . . . . . . . . 7−77.1.3 Listing and Jumping to Breakpoints . . . . . . . . . . . . . 7−87.2 Setting Breakpoints . . . . . . . . . . . . . . . . . . . . . . . . . . . 7−87.2.1 Data Breakpoints over a Range of Addresses . . . . . 7−117.2.2 Temporary Breakpoints . . . . . . . . . . . . . . . . . . . . . . . 7−127.2.3 Breakpoint Names . . . . . . . . . . . . . . . . . . . . . . . . . . . . 7−137.2.4 Setting the Count . . . . . . . . . . . . . . . . . . . . . . . . . . . . . 7−147.2.5 Sequence Breakpoints . . . . . . . . . . . . . . . . . . . . . . . . 7−157.3 Deleting Breakpoints . . . . . . . . . . . . . . . . . . . . . . . . . 7−167.4 Enabling/Disabling Breakpoints . . . . . . . . . . . . . . . . 7−177.5 Breakpoint Commands . . . . . . . . . . . . . . . . . . . . . . . . 7−197.5.1 Attaching Conditionals to a Breakpoint . . . . . . . . . . 7−217.5.2 Attaching Macros to a Breakpoint . . . . . . . . . . . . . . . 7−217.5.3 Attaching Strings to a Breakpoint . . . . . . . . . . . . . . . 7−227.6 Suppressing Breakpoint Messages . . . . . . . . . . . . . . . 7−227.7 Up−level Breakpoints . . . . . . . . . . . . . . . . . . . . . . . . . 7−237.8 Patches . . . . . . . . . . . . . . . . . . . . . . . . . . . . . . . . . . . . . 7−257.8.1 Patching Code out of a <strong>Pro</strong>gram . . . . . . . . . . . . . . . . 7−25
Table of ContentsIX7.8.2 Patching Code into a <strong>Pro</strong>gram . . . . . . . . . . . . . . . . . . 7−267.8.3 Replacing Code in a <strong>Pro</strong>gram . . . . . . . . . . . . . . . . . . 7−267.9 Diagnostic Output and Statistical Information . . . . . 7−277.10 Assertions . . . . . . . . . . . . . . . . . . . . . . . . . . . . . . . . . . . 7−287.10.1 Assertion Mode . . . . . . . . . . . . . . . . . . . . . . . . . . . . . . 7−287.10.2 Defining an Assertion . . . . . . . . . . . . . . . . . . . . . . . . . 7−297.10.3 Editing an Assertion . . . . . . . . . . . . . . . . . . . . . . . . . . 7−317.10.4 Activating and Suspending Assertions . . . . . . . . . . . 7−317.10.5 Deleting Assertions . . . . . . . . . . . . . . . . . . . . . . . . . . . 7−327.10.6 Using Assertions . . . . . . . . . . . . . . . . . . . . . . . . . . . . . 7−337.10.7 Gathering Statistics with Assertions . . . . . . . . . . . . . . 7−35DEFINING AND USING MACROS8−18.1 <strong>CrossView</strong> <strong>Pro</strong> Macros . . . . . . . . . . . . . . . . . . . . . . . . 8−38.2 Defining Macros . . . . . . . . . . . . . . . . . . . . . . . . . . . . . . 8−38.2.1 Listing Macros . . . . . . . . . . . . . . . . . . . . . . . . . . . . . . . 8−58.2.2 Redefining a Macro . . . . . . . . . . . . . . . . . . . . . . . . . . . 8−58.2.3 Saving Macro Definitions to a File . . . . . . . . . . . . . . 8−68.2.4 Loading Macro Definitions from a File . . . . . . . . . . . 8−78.2.5 Deleting Macros . . . . . . . . . . . . . . . . . . . . . . . . . . . . . . 8−88.3 Macro Parameters . . . . . . . . . . . . . . . . . . . . . . . . . . . . 8−98.4 Redefining Existing <strong>CrossView</strong> <strong>Pro</strong> Commands . . . . 8−108.5 Using the Toolbox . . . . . . . . . . . . . . . . . . . . . . . . . . . . 8−118.5.1 Opening the Toolbox . . . . . . . . . . . . . . . . . . . . . . . . . 8−118.5.2 Connecting Macros to the Toolbox . . . . . . . . . . . . . . 8−118.5.3 Removing a Macro Connection . . . . . . . . . . . . . . . . . 8−12COMMAND RECORDING & PLAYBACK9−19.1 Recording Commands . . . . . . . . . . . . . . . . . . . . . . . . . 9−39.1.1 Entering Comments . . . . . . . . . . . . . . . . . . . . . . . . . . . 9−49.1.2 Suspend Recording . . . . . . . . . . . . . . . . . . . . . . . . . . . 9−59.1.3 Resume Recording . . . . . . . . . . . . . . . . . . . . . . . . . . . . 9−59.1.4 Check Recording Status . . . . . . . . . . . . . . . . . . . . . . . 9−6• • • • • • • •
XTable of Contents9.1.5 Close File for Recording . . . . . . . . . . . . . . . . . . . . . . . 9−69.1.6 Command Recording Example . . . . . . . . . . . . . . . . . 9−79.2 Playing Back Command Files . . . . . . . . . . . . . . . . . . 9−89.2.1 Setting the Type of Playback . . . . . . . . . . . . . . . . . . . 9−99.2.2 Calling Other Playback Files . . . . . . . . . . . . . . . . . . . 9−99.2.3 Quitting Playback Mode . . . . . . . . . . . . . . . . . . . . . . . 9−109.3 Command Line Batch <strong>Pro</strong>cessing . . . . . . . . . . . . . . . 9−109.4 Logging . . . . . . . . . . . . . . . . . . . . . . . . . . . . . . . . . . . . . 9−129.4.1 Setting up Logging . . . . . . . . . . . . . . . . . . . . . . . . . . . 9−139.4.2 Recording Commands and Logging Screen Output 9−159.4.3 Command Window Log File Example . . . . . . . . . . . 9−159.4.4 Suspending and Resuming Output Log . . . . . . . . . . 9−159.4.5 Closing the Output Log File . . . . . . . . . . . . . . . . . . . . 9−179.5 Startup Options . . . . . . . . . . . . . . . . . . . . . . . . . . . . . . 9−189.6 <strong>CrossView</strong> <strong>Pro</strong> Command History Mechanism . . . . . 9−19I/O SIMULATION10−1CONTENTS10.1 Introduction . . . . . . . . . . . . . . . . . . . . . . . . . . . . . . . . . 10−310.2 I/O Streams . . . . . . . . . . . . . . . . . . . . . . . . . . . . . . . . . 10−310.2.1 Setting Up File I/O Streams . . . . . . . . . . . . . . . . . . . . 10−410.2.2 Redirecting I/O Streams . . . . . . . . . . . . . . . . . . . . . . . 10−610.3 File System Simulation . . . . . . . . . . . . . . . . . . . . . . . . 10−710.3.1 File System Simulation Libraries . . . . . . . . . . . . . . . . 10−810.4 Debug Instrument I/O . . . . . . . . . . . . . . . . . . . . . . . . 10−910.5 The Terminal Window . . . . . . . . . . . . . . . . . . . . . . . . 10−1010.5.1 Terminal Window Keyboard Mappings . . . . . . . . . . 10−10SPECIAL FEATURES11−111.1 Transparency Mode . . . . . . . . . . . . . . . . . . . . . . . . . . . 11−311.2 RTOS Aware Debugging . . . . . . . . . . . . . . . . . . . . . . . 11−411.3 Coverage . . . . . . . . . . . . . . . . . . . . . . . . . . . . . . . . . . . . 11−611.4 <strong>Pro</strong>filing . . . . . . . . . . . . . . . . . . . . . . . . . . . . . . . . . . . . 11−811.4.1 Function <strong>Pro</strong>filing . . . . . . . . . . . . . . . . . . . . . . . . . . . . 11−9
Table of ContentsXIII2.4 <strong>CrossView</strong> <strong>Pro</strong> DDE Specific Optionsand Commands . . . . . . . . . . . . . . . . . . . . . . . . . . . . . . A−282.4.1 Command Line Options . . . . . . . . . . . . . . . . . . . . . . . A−282.4.2 Commands . . . . . . . . . . . . . . . . . . . . . . . . . . . . . . . . . . A−282.5 Examples . . . . . . . . . . . . . . . . . . . . . . . . . . . . . . . . . . . A−292.5.1 Evaluating an Expression . . . . . . . . . . . . . . . . . . . . . . A−292.5.2 Reading Target Memory . . . . . . . . . . . . . . . . . . . . . . . A−302.5.3 Writing Into Target Memory . . . . . . . . . . . . . . . . . . . . A−312.5.4 Requesting Current File and Line Number . . . . . . . . A−322.5.5 Using <strong>CrossView</strong> <strong>Pro</strong> as Pure Server . . . . . . . . . . . . . A−32CROSSVIEW EXTENSION LANGUAGE (CXL)B−11 Introduction . . . . . . . . . . . . . . . . . . . . . . . . . . . . . . . . . B−32 The Syntax of CXL . . . . . . . . . . . . . . . . . . . . . . . . . . . . B−42.1 Variables . . . . . . . . . . . . . . . . . . . . . . . . . . . . . . . . . . . . B−62.2 Base Types . . . . . . . . . . . . . . . . . . . . . . . . . . . . . . . . . . B−62.3 Compound Types . . . . . . . . . . . . . . . . . . . . . . . . . . . . B−72.4 Pointers . . . . . . . . . . . . . . . . . . . . . . . . . . . . . . . . . . . . . B−72.5 Constants and Expressions . . . . . . . . . . . . . . . . . . . . . B−82.6 Operators . . . . . . . . . . . . . . . . . . . . . . . . . . . . . . . . . . . B−82.7 Functions . . . . . . . . . . . . . . . . . . . . . . . . . . . . . . . . . . . B−92.8 File Inclusion . . . . . . . . . . . . . . . . . . . . . . . . . . . . . . . . B−93 Predefined Functions . . . . . . . . . . . . . . . . . . . . . . . . . B−103.1 Mathematical functions . . . . . . . . . . . . . . . . . . . . . . . . B−103.2 Array and String functions . . . . . . . . . . . . . . . . . . . . . B−113.3 I/O functions . . . . . . . . . . . . . . . . . . . . . . . . . . . . . . . . B−113.4 Graph functions . . . . . . . . . . . . . . . . . . . . . . . . . . . . . . B−133.5 Miscellaneous functions . . . . . . . . . . . . . . . . . . . . . . . B−17SOUND SUPPORT (MS−Windows)C−1• • • • • • • •
XIVTable of ContentsCONTENTSROM/RAM MONITORMon−11 Introduction . . . . . . . . . . . . . . . . . . . . . . . . . . . . . . . . . Mon−32 Executable Name . . . . . . . . . . . . . . . . . . . . . . . . . . . . . Mon−33 General Operation . . . . . . . . . . . . . . . . . . . . . . . . . . . . Mon−34 Restrictions . . . . . . . . . . . . . . . . . . . . . . . . . . . . . . . . . . Mon−45 The RAM and ROM Debug Monitor . . . . . . . . . . . . . Mon−55.1 Monitor Configurations . . . . . . . . . . . . . . . . . . . . . . . . Mon−55.1.1 RAM Debug Monitor . . . . . . . . . . . . . . . . . . . . . . . . . . Mon−55.1.2 ROM Debug Monitor Using Dual Vector Table . . . . Mon−115.1.3 ROM Debug Monitor Using Memory Switch . . . . . . Mon−135.2 Resources used by the Debug Monitors . . . . . . . . . . Mon−145.3 Rebuilding the Debug Monitors . . . . . . . . . . . . . . . . Mon−165.3.1 Debug Monitor Configuration Parameters . . . . . . . . Mon−185.4 Debug Monitor Interface Description . . . . . . . . . . . . Mon−215.4.1 Initialization . . . . . . . . . . . . . . . . . . . . . . . . . . . . . . . . . Mon−215.4.2 Conventions . . . . . . . . . . . . . . . . . . . . . . . . . . . . . . . . . Mon−215.4.3 Command Set . . . . . . . . . . . . . . . . . . . . . . . . . . . . . . . . Mon−236 The Target Configuration File . . . . . . . . . . . . . . . . . . Mon−357 Building your Application . . . . . . . . . . . . . . . . . . . . . Mon−408 Connecting to the Target Board . . . . . . . . . . . . . . . . Mon−418.1 RS−232 . . . . . . . . . . . . . . . . . . . . . . . . . . . . . . . . . . . . . . Mon−418.2 CAN (Windows Only) . . . . . . . . . . . . . . . . . . . . . . . . . Mon−438.3 CAN Interface Messages . . . . . . . . . . . . . . . . . . . . . . . Mon−458.4 Connection <strong>Pro</strong>cess Messages . . . . . . . . . . . . . . . . . . Mon−478.5 Connection <strong>Pro</strong>blems . . . . . . . . . . . . . . . . . . . . . . . . . Mon−499 Troubleshooting the Debug Monitor . . . . . . . . . . . . Mon−5010 Target Board Application Notes . . . . . . . . . . . . . . . . . Mon−5210.1 Ertec EVA165, EVA167 and EVA167AA . . . . . . . . . . . Mon−5510.2 Rigel RMB−165, RMB−167, RMB−167SRand RMB−167CRI . . . . . . . . . . . . . . . . . . . . . . . . . . . . . Mon−5610.3 I+ME C167C Board . . . . . . . . . . . . . . . . . . . . . . . . . . . Mon−5610.3.1 Debug Monitors . . . . . . . . . . . . . . . . . . . . . . . . . . . . . . Mon−5610.3.2 Connection . . . . . . . . . . . . . . . . . . . . . . . . . . . . . . . . . . Mon−5610.4 PHYTEC MM−165, MM−167CR and MM−167CW . . . Mon−57
Table of ContentsXV10.4.1 Boot <strong>Pro</strong>gram . . . . . . . . . . . . . . . . . . . . . . . . . . . . . . . . Mon−5710.4.2 Connection . . . . . . . . . . . . . . . . . . . . . . . . . . . . . . . . . . Mon−5710.5 PHYTEC KC−161, KC−163, KC−164 and KC−167 . . . Mon−5810.6 TQ−Components STK16X/STK16XU Starter Kits . . . Mon−58SIMULATORSim−11 Introduction . . . . . . . . . . . . . . . . . . . . . . . . . . . . . . . . . Sim−32 Executable Name . . . . . . . . . . . . . . . . . . . . . . . . . . . . . Sim−33 Supported Features . . . . . . . . . . . . . . . . . . . . . . . . . . . Sim−33.1 Mapping Memory . . . . . . . . . . . . . . . . . . . . . . . . . . . . Sim−34 Peripheral Simulation . . . . . . . . . . . . . . . . . . . . . . . . . Sim−44.1 Peripheral Support . . . . . . . . . . . . . . . . . . . . . . . . . . . Sim−44.2 Scenario Scripting Using CXL . . . . . . . . . . . . . . . . . . . Sim−64.3 Peripheral Examples . . . . . . . . . . . . . . . . . . . . . . . . . . Sim−85 Target Configuration File . . . . . . . . . . . . . . . . . . . . . . Sim−96 Restrictions and Implementation Details . . . . . . . . . Sim−11ON−CHIP DEBUG SUPPORTOCDS−11 Introduction . . . . . . . . . . . . . . . . . . . . . . . . . . . . . . . . . OCDS−32 Supported Hardware . . . . . . . . . . . . . . . . . . . . . . . . . . OCDS−33 Additional System Requirements . . . . . . . . . . . . . . . . OCDS−34 Installation . . . . . . . . . . . . . . . . . . . . . . . . . . . . . . . . . . OCDS−44.1 Hardware Installation OCDS via the Parallel Port . . OCDS−44.2 Hardware Installation OCDS via DAS . . . . . . . . . . . . OCDS−44.3 Software Installation . . . . . . . . . . . . . . . . . . . . . . . . . . OCDS−44.4 Configuring <strong>CrossView</strong> <strong>Pro</strong> . . . . . . . . . . . . . . . . . . . . OCDS−55 OCDS Breakpoints . . . . . . . . . . . . . . . . . . . . . . . . . . . . OCDS−56 The Target Configuration File . . . . . . . . . . . . . . . . . . OCDS−67 Infineon Board OCDS Interface Circuit . . . . . . . . . . OCDS−97.1 The Infineon JTAG connector . . . . . . . . . . . . . . . . . . OCDS−117.1.1 The connector Layout . . . . . . . . . . . . . . . . . . . . . . . . . OCDS−117.1.2 Implementation Considerations . . . . . . . . . . . . . . . . . OCDS−13• • • • • • • •
CONTENTSXVITable of ContentsINDEX
<strong>Manual</strong> Purpose and StructureXVIIMANUAL PURPOSE AND STRUCTUREPURPOSEThis manual is aimed at users of the <strong>CrossView</strong> <strong>Pro</strong> debugger for the<strong>C166</strong>/<strong>ST10</strong> microcontroller family. It assumes that you are familiar withprogramming the <strong>C166</strong>/<strong>ST10</strong>.MANUAL STRUCTURERelated PublicationsConventions Used In This <strong>Manual</strong>CHAPTERS1. OverviewHighlights specific <strong>CrossView</strong> <strong>Pro</strong> features and capabilities, and showshow to compile code for debugging.2. Software InstallationDescribes how to install <strong>CrossView</strong> <strong>Pro</strong> on your system.3. Command LanguageDetails the syntax of <strong>CrossView</strong> <strong>Pro</strong>’s command language.4. Using <strong>CrossView</strong> <strong>Pro</strong>Describes the basic methods of invoking, operating, and exiting<strong>CrossView</strong> <strong>Pro</strong>.5. Controlling <strong>Pro</strong>gram ExecutionDescribes the various means of program execution.6. Accessing Code and DataDescribes how to view and edit the variables in your source program.7. Breakpoints and AssertionsDescribes breakpoints and assertions.• • • • • • • •
XVIII<strong>Manual</strong> Purpose and Structure8. Defining and Using MacrosDescribes how to simplify a complicated procedure by creating a"shorthand" macro which can be used to execute any sequence of<strong>CrossView</strong> <strong>Pro</strong> or C language commands and expressions.9. Command Recording & PlaybackDescribes the record and playback functions of <strong>CrossView</strong> <strong>Pro</strong>.10. I/O SimulationDescribes how to simulate your input and output using File SystemSimulation (FSS), File I/O (FIO) or Debug Instrument I/O (DIO).11. Special FeaturesDescribes special features of <strong>CrossView</strong> <strong>Pro</strong>, such as the TransparencyMode, RTOS Aware Debugging, Coverage, <strong>Pro</strong>filing and theBackground Mode.12. Debugging NotesContains some notes about debugging in special situations.MANUAL STRUCTURE13. Command ReferenceAn alphabetical list of all <strong>CrossView</strong> <strong>Pro</strong> commands. Consult thischapter for specifics and the exact syntax of any <strong>CrossView</strong> <strong>Pro</strong>command.14. Error MessagesContains <strong>CrossView</strong> <strong>Pro</strong> error messages and gives advice for correctingthem.15. GlossaryDefines the most common terms used in embedded systemsdebugging.
<strong>Manual</strong> Purpose and StructureXIXAPPENDICESA. Interprocess CommunicationContains a description of the COM interface and the DDE interface.B. <strong>CrossView</strong> Extension Language (CXL)Contains a description of the syntax of CXL scripts.C. Sound Support (MS−Windows)Describes how to add sound to <strong>CrossView</strong> <strong>Pro</strong> events underMS−Windows.ADDENDUMExecution EnvironmentContains information specific to your particular type of target system.• • • • • • • •
XX<strong>Manual</strong> Purpose and StructureRELATED PUBLICATIONS• The C <strong>Pro</strong>gramming Language (second edition) by B. Kernighan andD. Ritchie (1988, Prentice Hall)• ANSI X3.159−1989 standard [ANSI]• ISO/IEC 9899:1999(E), <strong>Pro</strong>gramming languages − C [ISO/IEC]• <strong>C166</strong>/<strong>ST10</strong> Cross−Assembler, Linker/Locator, Utilities User’s <strong>Manual</strong>[TASKING, MA019−000−00−00]• <strong>C166</strong>/<strong>ST10</strong> C Cross−Compiler User’s <strong>Manual</strong>[TASKING, MA019−002−00−00]• <strong>C166</strong>/<strong>ST10</strong> C++ Compiler User’s <strong>Manual</strong> [TASKING, MA019−012−00−00]• <strong>C166</strong> User’s <strong>Manual</strong> [Infineon Technologies]• C167 User’s <strong>Manual</strong> [Infineon Technologies]• <strong>ST10</strong> Family <strong>Pro</strong>gramming <strong>Manual</strong> [STMicroelectronics]• <strong>C166</strong>S v2.0 / Super10 User’s <strong>Manual</strong> [Infineon Technologies /STMicroelectronics]• Evaluation board <strong>Manual</strong>s [Miscellaneous vendors]MANUAL STRUCTURE
<strong>Manual</strong> Purpose and StructureXXICONVENTIONS USED IN THIS MANUALNotation for syntaxThe following notation is used to describe the syntax of command lineinput:bolditalicsType this part of the syntax literally.Substitute the italic word by an instance. For example:filenamemeans: type the name of a file in place of the wordfilename.{ } Encloses a list from which you must choose an item.[ ] Encloses items that are optional.| Separates items in a list. Read it as OR.... You can repeat the preceding item zero or more times.For examplecommand [option]... filenameThis line could be written in plain English as: execute the commandcommand with the optional options option and with the file filename.• • • • • • • •
XXII<strong>Manual</strong> Purpose and StructureIllustrationsThe following illustrations are used in this manual:This is a note. It gives you extra information.This is a warning. Read the information carefully.This illustration indicates actions you can perform with the mouse.This illustration indicates keyboard input.This illustration can be read as See also". It contains a reference toanother command, option or section.MANUAL STRUCTURE
CHAPTEROVERVIEW1
Overview1−31.1 INTRODUCTIONThis chapter highlights many of the features and capabilities of <strong>CrossView</strong><strong>Pro</strong>, including an Introduction to Source Level Debugging and the<strong>C166</strong>/<strong>ST10</strong> Development Environment.This chapter also contains the section Getting Started, which shows youhow to compile a program to work with the debugger.1.2 CROSSVIEW PRO’S FEATURES<strong>CrossView</strong> <strong>Pro</strong> is TASKING’s high−level language debugger. <strong>CrossView</strong> <strong>Pro</strong>is a real−time, source−level debugger that lets you debug embeddedmicroprocessor systems at your highest level of productivity. Its powerfulcapabilities include:• Multi−Window Graphical User Interface• C and Assembly level debugging• C Expression Evaluation including Function Calls• Breakpoints (both hardware and software)• <strong>Pro</strong>be Points• Assertions (software data breakpoints)• C−trace, Instruction Trace• I/O Simulation (IOS)• Data Monitoring• Single Stepping• Coverage• <strong>Pro</strong>filing• Macros• Flexible Record & Playback Facilities• Real−Time Kernel Support• On−line context sensitive Help• Documentation• • • • • • • •
1−4Chapter 1Multi−Window InterfaceThis interface uses your host’s native windowing system, so that youalready know how to open, close and resize windows. With windows youcan keep track of information concerning registers, the stack, andvariables. <strong>CrossView</strong> <strong>Pro</strong> automatically updates each window wheneverexecution stops.You have great freedom in designing a suitable display. You can hide andresize the various windows if you choose.Statement EvaluationYou can enter C expressions, <strong>CrossView</strong> <strong>Pro</strong> commands or anycombination of the two for <strong>CrossView</strong> <strong>Pro</strong> to evaluate. You may also callfunctions defined in your source code from the command line. Expressionevaluation is an ideal way to test subroutines by passing them samplevalues and checking the results.BreakpointsBreakpoints halt program execution and return control to you. There areseveral types of breakpoints: code, data, instruction count, cycle count,timer and sequence.Code breakpoints let you halt the program at critical junctures of programexecution and observe values of important variables.You may place data breakpoints to determine when memory addresses areread from, written to, or both. With data breakpoints, you can easily trackthe use and misuse of variables.OVERVIEWAn instruction count breakpoint halts the program after a specified numberof instructions have been executed; a cycle count breakpoint stops theprogram after a number of CPU cycles; a timer breakpoint stops theprogram after a number of micro seconds or ticks and sequencebreakpoints stop the program when a number of breakpoints are hit in aspecified sequence.Data breakpoints, instruction count breakpoints, cycle count breakpointsand timer breakpoints are not available for all execution environments,please check the Addendum.
Overview1−5<strong>Pro</strong>be Point BreakpointsA breakpoint can be treated as a probe point. When a probe pointbreakpoint is hit, the associated commands are executed and programexecution is continued. <strong>Pro</strong>be points are used with File I/O simulation andsequence breakpoints.AssertionsA powerful assertion mechanism lets you catch hard−to−find−errors. Anassertion is a command, or series of commands, executed after every lineof source code. You may use assertions to test for all sorts of errorconditions throughout the entire length of your program.C−Trace<strong>CrossView</strong> <strong>Pro</strong> has a separate window that displays the most recentlyexecuted C statements or machine instructions. This feature uses theexecution environment’s trace buffer along with symbolic informationgenerated during compilation. This feature is depending on the executionenvironment.I/O Simulation (IOS)With I/O simulation you can debug programs before the actual input andoutput devices are present. <strong>CrossView</strong> <strong>Pro</strong> can read input data from thekeyboard or a file, or can send output to a window or a file. You canview the data in several formats, including hexadecimal and character. Youcan have an unlimited number of simulated I/O ports, which can beassociated with the screen and displayed in windows.Data MonitoringYou may place variables and expressions in the Data window, where<strong>CrossView</strong> <strong>Pro</strong> updates their values when execution stops.Single SteppingWith <strong>CrossView</strong> <strong>Pro</strong>, you can single step through your code at sourcelevel or at assembly level, into or over procedure calls. Running yourprogram one line at a time lets you check variables and program flow.• • • • • • • •
1−6Chapter 1CoverageWhen a command such as StepInto or Continue executes the application,<strong>CrossView</strong> <strong>Pro</strong> traces all memory access, i.e. memory read, memory writeand instruction fetch. Through code coverage you can find executed andnon−executed areas of the application program. Areas of unexecutedcode may exist because of programming errors or because of unnecessarycode. It may be that your program input, your test set, is incomplete; Itdoes not cover all paths in the program. Data coverage allows you toverify which memory locations, i.e. which variables, are accessed duringprogram execution. Additionally, you can see stack and heap usage. Theavailability of this feature depends on the execution environment.<strong>Pro</strong>filing<strong>Pro</strong>filing allows you to perform timing analysis on your software. Twoforms of profiling are implemented in <strong>CrossView</strong> <strong>Pro</strong>.Function profiling, also called cumulative profiling, gives you timinginformation about a particular function or set of functions. <strong>CrossView</strong> <strong>Pro</strong>shows: the number of times a function is called, the time spent in thefunction, the percentage of time spent in the function, and theminimum/maximum/average time spent in the function. The timing resultsinclude the time spent in functions called by the profiled function.Code range profiling presents timing information about a consecutiverange of program instructions. <strong>CrossView</strong> <strong>Pro</strong> displays the time consumedby each line (source or disassembly) in the Source Window. Next to this,the <strong>Pro</strong>file Report dialog shows the time spend in each function. Thetiming results do not include the time consumed in functions called by theprofiled function.OVERVIEWThe availability of profiling depends on the execution environment.Function profiling can be supported if the execution environment providesa clock that starts and stops whenever execution starts and stops. Coderange profiling heavily relies on special profiling features in the executionenvironment. Normally code range profiling is only supported byinstruction set simulators.
Overview1−7MacrosMacros let you store and recall complex commands and expressions with aminimal number of keystrokes. You can store macros in a "toolbox",making it possible to execute complex functions with the touch of amouse button. You can also place macros in command lists of breakpointsand assertions. You can use flow control statements within macros, andmacros can call other macros, allowing you to construct arbitrarilycomplex sequences. Macros can accept multiple parameters, be saved andloaded from files and can even rename existing <strong>CrossView</strong> <strong>Pro</strong> commands.Record & PlaybackAt any time, you can record the commands you type, and optionally theiroutput, to a file. You can also play back files of commands all at once orin a single−step playback mode. These functions are helpful for setting upstandardized debugging tests or to save results for later study orcomparison.Kernel Support<strong>CrossView</strong> <strong>Pro</strong> supports RTOS (Real−Time Operating System) awaredebugging for various kernels. Since each kernel is different, the RTOSaware features are not implemented in the <strong>CrossView</strong> <strong>Pro</strong> executable, butin a library that will be loaded at run−time by <strong>CrossView</strong> <strong>Pro</strong>. The amountof windows and dialogs and their contents is kernel dependent.On−Line HelpWhen you click on a Help button or when you press the F1 function keyin an active window, the <strong>CrossView</strong> <strong>Pro</strong> help system opens at theappropriate section. From this point, you can also access the rest of thehelp system.Documentation<strong>CrossView</strong> <strong>Pro</strong> has a comprehensive set of documentation for both newand experienced users. The manual includes an installation guide,description of debugging with <strong>CrossView</strong> <strong>Pro</strong>, error messages, and acommand reference section. The documentation tries to cover a widerange of expertise, by making few assumptions about the technicalexperience of the reader.• • • • • • • •
1−8Chapter 11.3 SOURCE LEVEL DEBUGGING<strong>CrossView</strong> <strong>Pro</strong> is a source level debugger. Source level means thatdebugging works on the actual C code or assembly code. <strong>CrossView</strong> <strong>Pro</strong>can deal with global and local variables that are both statically anddynamically allocated variables. Therefore, it can deal with compiledaddresses of variables that move around the stack. <strong>CrossView</strong> <strong>Pro</strong> knowsthe compiler’s addressing conventions for variables of any type.The Debugging EnvironmentAll debugging configurations follow a similar pattern. There is a hostsystem where the debugger runs, and a target system (usually anexecution environment), where the program being debugged runs. Theremay also be a probe that can plug into the actual hardware of theembedded system being designed.<strong>CrossView</strong> <strong>Pro</strong> provides a high−level interface between you, the user,working at the host system and a program running at the target system(execution environment). This means that you may issue commands thatrefer directly to the variables, source files, and line numbers as theyappear in the source program. You can do this because <strong>CrossView</strong> <strong>Pro</strong>uses symbol information generated during compilation to translate thehigh−level commands that you type into a series of low level instructionsthat the target system understands. Using Generic Debug Instrument (GDI)calls towards a shared library for the simulator, or using a connectionbetween the host and target, <strong>CrossView</strong> <strong>Pro</strong> finds out information aboutthe state of the target program and then tells the target to perform therequested actions.OVERVIEWA host−target arrangement can perform functions beyond the reach oftraditional software−based debuggers. Since the target contains the actualchip, <strong>CrossView</strong> <strong>Pro</strong> can observe its operations without interfering. Theexistence of <strong>CrossView</strong> <strong>Pro</strong> and the host is invisible to the target program.This means that the program under debug runs exactly the same as thefinal program will in a real embedded system (except for real−timesituations like timings).
Overview1−9With <strong>CrossView</strong> <strong>Pro</strong>, you may also take advantage of any advancedcapabilities of your target hardware through emulator mode (transparencymode). In transparency mode you can communicate with the target as ifthe host system were a terminal directly connected to the target. You canenter and leave transparency mode freely without restarting the debuggeror the target system. <strong>CrossView</strong> <strong>Pro</strong> therefore does not interfere with thenormal operation of the target hardware. Thus the debugger is a powerfulaccessory to the machine−level debugging that you might do with thetarget system alone. The transparency mode is not available for allexecution environments (such as an evaluation board).1.4 HOW CROSSVIEW PRO WORKSAlthough it is not necessary to know how <strong>CrossView</strong> <strong>Pro</strong> performs itsdebugging, you may be curious how <strong>CrossView</strong> <strong>Pro</strong> works.Whenever you enter a debugger command, <strong>CrossView</strong> <strong>Pro</strong> obtainsinformation from or controls the execution environment by sendingappropriate commands over the host−target link. A typical session may gosomething like this:1. Highlight initval and click on the Show Expression button in theSource Window.Figure 1−1: Show selected source expression• • • • • • • •
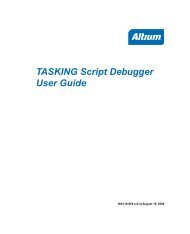
1−10Chapter 12. <strong>CrossView</strong> <strong>Pro</strong> converts this action into a command. Depending onpreferences you have set, the variable is shown in the Data Window or theExpression Evaluation dialog is shown.3. <strong>CrossView</strong> <strong>Pro</strong> consults the symbol table to deduce the type and addressof initval. Suppose initval is a variable of type int which lies atabsolute location 100.4. The debugger forms a command asking the target system to read twobytes starting at address 100 (the size of an int equals 2).5. <strong>CrossView</strong> <strong>Pro</strong> then transmits the command to the target system andreceives the response.6. <strong>CrossView</strong> <strong>Pro</strong> interprets the response, and for example determines thatinitval equals 17.7. <strong>CrossView</strong> <strong>Pro</strong> then displays initval=17 since it knows initval’s type.OVERVIEWFigure 1−2: <strong>CrossView</strong> <strong>Pro</strong> Command OutputThis is a simplified example, many <strong>CrossView</strong> <strong>Pro</strong> commands requireseveral complex transactions, but all take place without you being awareof them.
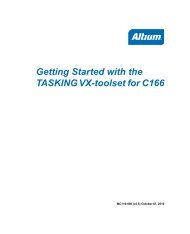
Overview1−111.5 <strong>C166</strong>/<strong>ST10</strong> PROGRAM DEVELOPMENTThe <strong>CrossView</strong> <strong>Pro</strong> debugger package is part of a toolchain that providesan environment for modular program development and debugging. Thefigure below shows the structure of the toolchain. The toolchain containsthe following programs:cc166cp166c166m166a166l166ar166d166dmp166mk166The control program can build an absolute loadable filestarting with an input file of any stage. With a C source file asinput, cc166 calls c166, a166 and l166 with the appropriatecommand line arguments.The C++ compiler which translates C++ source into C sourcesuitable for the C compiler. Must be ordered separately.The C crosscompiler which translates a C source programinto a highly optimized assembly source file.A string−macro preprocessor allowing macro substitution, fileinclusion and conditional assembly, according to the MacroPreprocessor Language.The assembler program which produces an object file from agiven assembly file.A linker/locator combining objects and object libraries intotasks or several tasks into one target load file.A librarian program, which can be used to create andmaintain object libraries.A utility to disassemble absolute object files and relocatableobject files.A dumper utility to report the contents of an object file.A program builder which uses a set of dependency rules in a’makefile’ to build only the parts of an application which areout of date.• • • • • • • •
1−12Chapter 1C++ source file.cc .ccmC source file.cinvocation fileC++ compilercp166.ic.icmerror list file .err.sif.sifglobal storage optimizergso166.gsoC compilerc166assembly file.srcassemblera166.asmassembly source file.asmmacro preprocessorm166Invocation filelist filelist file .mplerror list file .mpe.lstarchiverar166object library.liberror list file .erlcontrol programcc166relocatable objectmodule .objlinker l166link stagelinked objectmodule .lnolinker l166locate stageabsolute objectmodule a.outinvocation fileprint file .lnlinvocation filemap file .mapOVERVIEWMotorola S Formattersrec166IEEE Formatterieee166Intel Hex Formatterihex166Motorola S−records IEEE−695 load module.abs Intel Hex−records<strong>CrossView</strong> <strong>Pro</strong><strong>Debugger</strong>xfw166Figure 1−3: <strong>C166</strong>/<strong>ST10</strong> development flow<strong>C166</strong>/<strong>ST10</strong>executionenvironment
Overview1−13ieee166ihex166srec166xfw166A program which formats an absolute (located) TASKINGa.out file to the IEEE695 format which has full high levellanguage debugging support. The IEEE695 format is used by<strong>CrossView</strong> <strong>Pro</strong>.A facility to translate an absolute (located) TASKING a.out fileinto Intel Hex Format for (E)PROM programmers. No symbolinformation.A facility to translate an absolute (located) TASKING a.out fileinto Motorola S Format for (E)PROM programmers. Nosymbol information.The <strong>CrossView</strong> <strong>Pro</strong> debugger using <strong>C166</strong>/<strong>ST10</strong> executionenvironments such as evaluation boards.For a full description of all available utility programs see the chapterUtilities in the <strong>C166</strong>/<strong>ST10</strong> Cross−Assembler, Linker/Locator, Utilities User’s<strong>Manual</strong>.1.6 GETTING STARTED1.6.1 BEFORE STARTINGBefore using <strong>CrossView</strong> <strong>Pro</strong>, there are several things that you must do:• Install the <strong>CrossView</strong> <strong>Pro</strong> software. Directions for your particularsystem are found in the Software Installation chapter.• Configure your execution environment as described in theExecution Environment addendum.• Compile the program that you want to debug. A brief descriptionof this process is outlined in the section Building Your Executablelater in this chapter.For the purpose of getting you started quickly, we have supplied you witha demo program that you can debug. The demo program is demo.abs.• • • • • • • •
1−14Chapter 11.6.2 SETTING UP THE EXECUTION ENVIRONMENTThe following only applies to ROM monitor and emulator versions of<strong>CrossView</strong> <strong>Pro</strong>.In order for the host and execution environment to communicate, a properconnection must exist between the two machines. Here are someimportant considerations:• Use the correct kind of RS232 cable. Note there are at least twotypes of cables, null modem and direct. Consult the executionenvironment’s manual for the correct type.• Make sure the execution environment is configured to communicatewith the host at the baud rate that <strong>CrossView</strong> <strong>Pro</strong> expects.Evaluation boards usually have an auto baud rate detection. Thehighest possible baud rate for the PC is 19200 baud. The defaultbaud rate is 9600.• Use the correct ports on both the execution environment and host.Many machines have two ports. If you use a different port on thehost than the default (COM1 for PC), you will have to use a specialstartup switch, −D. See the startup options of the Using <strong>CrossView</strong><strong>Pro</strong> chapter.• See the addendum for details on the connection to the executionenvironment.From EDE you can select an execution environment in the ExecutionEnvironment page of the <strong>CrossView</strong> <strong>Pro</strong> entry in the <strong>Pro</strong>ject | <strong>Pro</strong>jectOptions dialog.OVERVIEW
Overview1−151.6.3 STARTING CROSSVIEW PROTo invoke <strong>CrossView</strong> <strong>Pro</strong>, select it from the Windows Start menu or clickon the Debug application button from EDE. <strong>CrossView</strong> <strong>Pro</strong> starts up andopens the command window, source window and other windows.BreakpointToggleLocal ToolbarMenu BarMain ToolbarMainStatus BarLocalToolbarsSource WindowStatus BarFigure 1−4: Command Window• • • • • • • •
1−16Chapter 1<strong>CrossView</strong> <strong>Pro</strong> can be passed the name of an execution (*.abs) file.When you invoke <strong>CrossView</strong> <strong>Pro</strong> from EDE, EDE automatically passes thename of the absolute file (project.abs) of the current project. If do notuse EDE you can do this from a command line, but the native windowingsystem often provides alternatives. Usually this involves dragging theprogram to be debugged onto the <strong>CrossView</strong> <strong>Pro</strong> executable from theWindows Explorer, and dropping it there or associating <strong>CrossView</strong> <strong>Pro</strong> tobe the application to start when double−clicking an .abs icon. <strong>CrossView</strong><strong>Pro</strong> will start and load the symbol information from that file.1.6.3.1 CROSSVIEW PRO TARGET SETTINGSYou can specify specific <strong>CrossView</strong> <strong>Pro</strong> startup settings in the TargetSettings dialog.To open the Target Settings dialog:• From the Target menu, select Settings...The Target Settings dialog box appears as shown in figure 1−5.OVERVIEWFigure 1−5: <strong>CrossView</strong> <strong>Pro</strong> Target Settings
Overview1−17You can set the following items in this dialog:• Select a target configuration containing some target specificconfiguration items. See the text below for more information.• Select the CPU type (optional).• Specify the source directories for <strong>CrossView</strong> <strong>Pro</strong>. Click on theConfigure... button to change the list of source directories.Target ConfigurationThe available targets are described by the target configuration files (*.cfgin the etc subdirectory). These targets include evaluation boards,emulator boards or instruction set simulators (sim*.cfg). The targetconfiguration files are text files and can be edited with any text editor.Empty lines, lines consisting of only white space are allowed. Commentstarts at an exclamation−sign (’!’) and ends at the end of the line.An information line has the following synopsis:[! comment] field: [subfield =] field−valuefieldsubfieldfield−valuecommentone of the keywords described belowthe usage of this part depends on the value of field, seebelowthe value assigned to the fieldoptional comment• • • • • • • •
1−18Chapter 1The fields listed in the configuration file are:OVERVIEWFieldtitlecpu_typeregister_filedebug_instrument_moduleradmDescriptionThe full name of the configuration. Thisname will be displayed in the Targetconfiguration field of the TargetSettings dialog.The name of the CPU present on thetarget board. <strong>CrossView</strong> <strong>Pro</strong> knows fourtypes of CPUs, 167, 167mac, ext2macand ext22mac. ’167’ represents theextended architecture, like the C161,C163, C164, C165 and C167 families.’167mac’ represents the extendedarchitecture including the MACcoprocessor, like the <strong>ST10</strong>x262 and<strong>ST10</strong>x272 families. ’ext2mac’ representsthe second extended architectures likethe XC16x and Super10. ’ext22mac’represents the enhanced Super10architectures.The filename of the register file (*.def)to be used for the CPU on the target.When this field is omitted <strong>CrossView</strong> <strong>Pro</strong>uses the default reg.def as register file.This register file contains debuginformation for <strong>CrossView</strong> <strong>Pro</strong> like which(E)SFR registers are present and atwhich location.The name of the Debug Instrument(using GDI) used for debugging:’disim166’ for the instruction setsimulator, ’dieva166’ for a target boardconnection using a serial or CANinterface, ’diocds166’ for target boardsthat use the OCDS interface via theparallel port and ’gdi2das’ for targetboards that use the OCDS interface viaDAS.The name of the Debug Instrument(using KDI) used for RTOS awaredebugging. (optional).
Overview1−19For FLASH programming support the following items can be added to thislist:Fieldflash_monitorflash_direct_accessflash_device_numflash_workspaceflash_vendor0flash_chip0flash_width0flash_chips0flash_base_address0DescriptionThe filename of the FLASH programingmonitor, used for flashing files (forexample a ROM monitor) in an EPROM.When set to TRUE, <strong>CrossView</strong> <strong>Pro</strong>performs flash operations using targetmemory read/write accesses. WhenFALSE, <strong>CrossView</strong> <strong>Pro</strong> downloads aFLASH programming monitor to thetarget and executes this program toperform the flash operations.The FLASH device number.The code address where the FLASHprogramming monitor must be loaded.The name of the FLASH device vendor.The name or type of FLASH device.The width (in bits) per FLASH device.The number of FLASH devices used.The start address of the memory rangethat will be covered by the FLASHdevice.For the instruction set simulator (ISS) the following items can be added tothis list:Fieldmap_irammap_sfrmap_ramDescriptionThe range where the simulator shouldsimulate internal RAM memory. Multipleranges can be separated by commas ’,’.The range where the simulator shouldsimulate the SFRs and/or ESFRs.Multiple ranges can be separated bycommas ’,’.The range where the simulator shouldsimulate external RAM memory. Multipleranges can be separated by commas ’,’.• • • • • • • •
1−20Chapter 1Fieldmap_rompsm_dll_nameDescriptionThe range where the simulator shouldsimulate external ROM memory. Multipleranges can be separated by commas ’,’.The name of the pheripheral simulationmodule: ’psm166’.For the ROM monitor the following items can be added to this list:OVERVIEWFieldbslackbootmonitorDescriptionThe bootstrap loader identification byte ofthe CPU on the board. When <strong>CrossView</strong><strong>Pro</strong> receives this byte from the boardwhen making connection, it starts thebootstrap sequence. Please check yourchip manual, chapter ’Bootstrap loader’for the definition of this identification byte.You can specify multiple identificationbytes, by separating them with commas.The filename of the boot program fortarget boards using a bootstrap loader.<strong>CrossView</strong> <strong>Pro</strong> searches the bootprogram in the etc directory of theproduct or in the current workingdirectory. The field can be omitted whenthe ROM Monitor is placed in ROM orFLASH. When this field is omitted,<strong>CrossView</strong> <strong>Pro</strong> will issue an error whenthe target board requests bootstraploading.The filename of the monitor program fortarget boards using a RAM debugmonitor to be downloaded on the boardusing a bootstrap program. <strong>CrossView</strong><strong>Pro</strong> searches the monitor program in theetc directory of the product or in thecurrent working directory. The field canbe omitted when the ROM Monitor isplaced in ROM or FLASH. When this fieldis omitted, <strong>CrossView</strong> <strong>Pro</strong> will issue anerror when the target board requestsbootstrap loading.
Overview1−21Fieldsysconiniteinitreservereset_periodrs232_reset_pinrs232_reset_levelrs232_reset_hold_levelrs232_bootstrap_pinrs232_bootstrap_levelrs232_bootstrap_hold_levelDescriptionThe initialization value for the SYSCONregister. This entry is here for backwardscompatibility only. The SYSCON registercan now be initialized usinginit.syscon.Initialize the register specified in thesubfield with the value specified infield−value. The register name in subfieldmust be known by <strong>CrossView</strong> <strong>Pro</strong>, i.e.,must be specified in the register file. Youcan specify multiple registers byseparating them with commas ’,’.Initialize the register specified in thesubfield with the value specified infield−value before the EINIT instruction isexecuted. Up to 6 registers can beinitialized before EINIT. The registername in subfield must be known by<strong>CrossView</strong> <strong>Pro</strong>, i.e., must be specified inthe register file. You can specify multipleregisters by separating them withcommas ’,’.The reserved memory ranges (from − to)for monitor resources. EDE uses this fieldto generate RESERVE MEMORY locatorcontrols. You can specify multiple rangesby separating them with commas ’,’.A period in milliseconds to hold the resetlevel at the required level.The name of the RS232−pin to reset thetarget, for example RTS.The level when the reset is active.The hold level when the reset is active.The name of the RS232−pin to set thetarget in bootstrap mode, for exampleDTR.The level when the BSL pin is active.The hold level when the BSL pin isactive.• • • • • • • •
1−22Chapter 1For the JTAG/OCDS connection via parallel port, the following items canbe added to this list:OVERVIEWFieldmonitorJtagDriverRegisterFileinitPeripheralsStopDescriptionThe filename of the monitor program fortarget boards using a JTAG/OCDS debuginterface. When this field is omitted,<strong>CrossView</strong> <strong>Pro</strong> will issue an error. For theC165UTAH board this is the filem167ocds.sre.The filename of the JTAG API interface.This interface communicates with the<strong>CrossView</strong> <strong>Pro</strong> ’diocds166’ Debuginstrument (DI) on one side and theactual JTAG driver (installed as a service)on the other side. This driver actuallycommunicates with target board via theparallel port.The filename of the register list file(*.dat) to be used for OCDS interface.This register file contains registerinformation for the Debug Instrument likewhich (E)SFR registers are present andat which location. This file must be usedalong with the register_file entrywhich contains the register informationfor <strong>CrossView</strong> <strong>Pro</strong>.Initialize the register specified in thesubfield with the value specified infield−value. The register name in subfieldmust be known by <strong>CrossView</strong> <strong>Pro</strong>, i.e.,must be specified in the register file. Youcan specify multiple registers byseparating them with commas ’,’.When set to 1, peripherals will bestopped when hitting a breakpoint. Bydefault, peripherals will not be stoppedupon a breakpoint. For theC161U/C165UTAH you should alsospecify the suspending peripherals withinthe clock control registers S0CLC,SSCCLC, GPTCLC, RTCCLC,EPECCLC, USBCLC, IOMCLC. For theXC16x you should specify thesuspending perihperals in the OPSENregister.
Overview1−23FieldResetDelayCableChipResetClientValuereserveDescriptionA delay in miliseconds for <strong>CrossView</strong> <strong>Pro</strong>after a target reset. When you useOCDS, <strong>CrossView</strong> <strong>Pro</strong> resets the target.However, <strong>CrossView</strong> <strong>Pro</strong> cannot detect ifthe reset is released when a capacitor isused inside the reset circuit on the board.JTAG cable number to the chip where theOCDS module is located. The valueshould always be 0.By default the OCDS interface performs aChip Reset with the reset pin (RSTIN) ofthe chip. You can disable this by settingthe value to zero.JTAG I/O mode OCDS module number.The value should always be 2.The reserved memory ranges (from − to)for OCDS monitor resources. EDE usesthis field to generate RESERVEMEMORY locator controls. You canspecify multiple ranges by separatingthem with commas ’,’.For OCDS via DAS the following items can be added to this list:FieldRegisterFileinitDescriptionThe filename of the register list file(*.dat) to be used for OCDS interface.This register file contains registerinformation for the Debug Instrument likewhich (E)SFR registers are present andat which location. This file must be usedalong with the register_file entrywhich contains the register informationfor <strong>CrossView</strong> <strong>Pro</strong>.Initialize the register specified in thesubfield with the value specified infield−value. The register name in subfieldmust be known by <strong>CrossView</strong> <strong>Pro</strong>, i.e.,must be specified in the register file. Youcan specify multiple registers byseparating them with commas ’,’.• • • • • • • •
1−24Chapter 1FieldResetDelayDASserverAccessPortTerminateServerreserveDescriptionA delay in miliseconds for <strong>CrossView</strong> <strong>Pro</strong>after a target reset. When you useOCDS, <strong>CrossView</strong> <strong>Pro</strong> resets the target.However, <strong>CrossView</strong> <strong>Pro</strong> cannot detect ifthe reset is released when a capacitor isused inside the reset circuit on the board.The name of the used DAS server, whichmust be run and/or installed on theconnected host.The connection to the device. For theUSB server USBx means access via xand the USB of the device.When TerminateServer != 0, if a server isstarted by the debug instrument, thisserver is also terminated on exit.The reserved memory ranges (from − to)for OCDS monitor resources. EDE usesthis field to generate RESERVEMEMORY locator controls. You canspecify multiple ranges by separatingthem with commas ’,’.Notes:• Fields not required for the target can be omitted.• <strong>CrossView</strong> <strong>Pro</strong> searches for the *.cfg files in the current directory andin the etc directory.1.6.3.2 CONFIGURING CROSSVIEW PROOVERVIEWYou may have to configure <strong>CrossView</strong> <strong>Pro</strong> to talk to the emulator or ROMmonitor. If you have a simulator version this step is not needed and theassociated menu item is grayed. To configure <strong>CrossView</strong> <strong>Pro</strong>:• From the Target menu, select Communication Setup...The Communication Setup dialog box appears as shown in figure1−6.
Overview1−25Figure 1−6: Setting up <strong>CrossView</strong> <strong>Pro</strong> Communications• Adjust the communication parameters (baud rate and I/O port) tomatch your hardware configuration.• Close the dialog box by clicking on the OK button.• The settings in this dialog (and other dialogs) will be saved onexiting <strong>CrossView</strong> <strong>Pro</strong>, when the Save desktop and target settingscheck box in the Save tab of the Options dialog is set. This dialogalways appears on exiting <strong>CrossView</strong> <strong>Pro</strong>.From EDE you can set the communication parameters in the RAM/ROMMonitor Comunication Setup page of the <strong>CrossView</strong> <strong>Pro</strong> entry in the<strong>Pro</strong>ject | <strong>Pro</strong>ject Options dialog.1.6.3.3 LOADING SYMBOLIC DEBUG INFORMATIONYou must tell <strong>CrossView</strong> <strong>Pro</strong> which program that you want to debug. Todo this:• From the File menu, select Load Symbolic Debug Info...The Load Symbolic Debug Info dialog box appears, as shown infigure 1−7.• Type in the path and file name of the program that you want todebug, or click on the Browse... button to bring up a file selectiondialog box. In our example we are using demo.abs. Note that inmost cases you will want to set the code bias field to 0x0000.• • • • • • • •
1−26Chapter 1• If your program accepts command line arguments you can enterthem as a comma separated list.• Set the Download image too check box by clicking on it, if youwant to download the image of your absolute object file to thetarget. You can decide to postpone downloading to the target. Inthat case you can select Download Application... from the Filemenu any time afterwards.• Set the Reset target system check box if you want to reset thetarget system to its initial state. You can decide to postpone resettingthe target. In that case you can select Reset Target System fromthe Run menu afterwards.• Set the Goto main check box if you want to execute the startupcode. This automatically enables the Reset application check box.You can decide to postpone going to the main function. In thatcase you can execute a high−level single step afterwards.• When you click on the Communication setup... button (ifavailable), the Communication Setup dialog box appears as shownin figure 1−6. With the Target Settings... button you can open theTarget Settings dialog. Please check the information in these dialogsbefore downloading an application.• When you click on the Load button, the program’s symbol file willbe loaded into the debugger and, if you have set the Downloadimage too check box, the image of your absolute object file will bedownloaded.• Clicking on Cancel ignores all actions.OVERVIEW
Overview1−27<strong>CrossView</strong> <strong>Pro</strong> remembers all previously saved settings. In this case, theLoad Symbolic Debug Info dialog already contains the previously savedconfiguration, so you only have to click the Load button to perform youractions.Figure 1−7: Loading Symbolic Debug InformationCompare Application / Verify downloadYou can use the File | Compare Application... dialog to check if a filematches the downloaded application. This can be useful when yourprogram has changed some of your code. If you enable the Verifydownload check box in the Load Symbolic Debug Info dialog, <strong>CrossView</strong><strong>Pro</strong> does this comparison automatically after a download.• • • • • • • •
1−28Chapter 11.6.4 EXECUTING AN APPLICATIONTo view your source while debugging, the Source Window must be open.To open this window,• From the View menu, select Source | Source linesBefore starting execution you have to reset the target system to its initialstate. The program counter, stack pointer and any other registers must beset to their initial value. The easiest way to do this is:• Set the Reset target system check box and the Goto main checkbox in the Load Symbolic Debug Info dialog box. (See the previoussection) Goto main automatically enables the Reset applicationcheck box.Depending on your execution environment a target system reset may haveundesired side effects. For this reason, the target system is reset before thecode is downloaded to the target.If you have not checked these items:• From the Run menu, select Reset Target System• From the Run menu, select Reset Application• Execute a high−level single step (either into or over) using thetoolbar in the Source Window (or F11/F10).The first single step executes the startup code and stops at the first line ofcode in main(). You should see your program’s source code.Another way of getting there is:OVERVIEW• Set a breakpoint at the entry of in main() by clicking on abreakpoint toggle at the left side of the text in the Source Window.See figure 1−8.• Start the application with Run | Reset Application and Run |Run.To set a breakpoint:• Click on a breakpoint toggle (as shown in figure 1−8) to set or toremove a breakpoint. A green colored toggle shows that nobreakpoint is set. A red colored toggle shows that a breakpoint isinstalled. An orange colored toggle shows that an installedbreakpoint is disabled.
Overview1−29Due to compiler optimizations it is possible that a C statement doesnot translate in any executable code. In this case you cannot set abreakpoint at such a C statement. No breakpoint toggle is shown inthis case.BreakpointTogglesCoverageMarkers<strong>Pro</strong>filingCurrentExecution PositionStatusBarFigure 1−8: Getting ControlNow it is time to execute your program:• From the Run menu, select RunIn the Source Window the current execution position (the statement at theaddress identified by the current value of the program counter) ishiglighted in blue. As a result, when execution stops, the line you set abreakpoint on is highlighted. You can now single step through yourprogram using the Step Into and Step Over buttons in the SourceWindow. Or you may choose to execute the rest of the program (or atleast until the next breakpoint) with the Run button.At any point you can interrupt the emulator and regain control by clickingon the Halt button in either the Source Window or the CommandWindow.For more information on executing a program, see the chapter Controlling<strong>Pro</strong>gram Execution.• • • • • • • •
1−30Chapter 11.6.5 DEBUGGING AN APPLICATIONWhen debugging your application you probably want to see the callingsequence of your program, and inspect the contents of variables and datastructures used within your program.To see the calling sequence of your program the Stack Window must beopen. The stack window shows the functions that are currently on thestack. To open the stack window,• From the View menu, select StackTo see the value of the local variables of a function,• From the View menu, select Data | Watch Locals WindowOVERVIEWFigure 1−9: Watch variables
Overview1−31To inspect the value of global variables and data structures,• Double−click on the variable name in the Source Window.Depending on preferences you have set, the variable is shown in the DataWindow as shown in figure 1−9 or the dialog displayed in figure 1−10 isshown.Figure 1−10: Expression evaluationPointers, structures and arrays displayed in the data window have acompact and expanded form. The compact form for a structure is just, while the expanded form shows all the fields. The compactform of a pointer is the value of the pointer, while the expanded formshows the pointed−to object. The compact form is indicated by putting a’+’ at the start of the display. (i.e., the object is expandable), while a ’−’indicates the expanded form (i.e., the object is contractible). Nesting issupported, so structures within structures can likewise be expanded, adinfinitum.To expand a pointer, structure or an array:• Double−click on the ’+’ in the Data Window• • • • • • • •
1−32Chapter 11.6.6 CROSSVIEW PRO OUTPUTNearly every <strong>CrossView</strong> <strong>Pro</strong> command can be given using the graphicaluser interface. These commands and the debugger’s response is logged inthe Command Output Window which is the upper part of the CommandWindow. Alternatively, <strong>CrossView</strong> <strong>Pro</strong> commands can be entered directly(without using the menu system) in the command edit field of thecommand window.To open the Command Window:• From the View menu, select Command | <strong>CrossView</strong>Figure 1−11 shows an example of the Command Window. Commands canbe typed into the command edit field (bottom field) or selected from thecommand history list (middle field) and edited then executed. The topfield is referred to as the Command Output Window. Each command,echoed from the command edit field, is displayed with a ’>’ prefix.<strong>CrossView</strong>’s response to the command is displayed below the command.<strong>CrossView</strong> Command<strong>CrossView</strong> ResponseOutput WindowOVERVIEWCommand Edit FieldCommand History ListFigure 1−11: <strong>CrossView</strong> <strong>Pro</strong> Command OutputYou can choose to clear the command edit field after executing acommand. From the File menu, select Options... and select the Desktoptab. Enable the Clear command line after executing command checkbox. You can use the clear command to clear the Output Window.
Overview1−331.6.7 EXITING CROSSVIEW PROTo quit a debugging session:• From the File menu, select Exit or close the Command Window.• In the Options dialog that appears, select in the Save tab theoptions you want to be saved for another debug session.• Click on the Exit button in the Options dialog.If you selected one or more items in the Options dialog, your settings willbe saved in the initialization file xvw.ini. This file is located in thestartup directory.Workspace filesIf you have set the Save desktop and target settings check box in theSave tab, <strong>CrossView</strong> <strong>Pro</strong> will create a workspace file (.cws) for eachdebugged or loaded application. The settings will be restored in afollowing debug session. If <strong>CrossView</strong> <strong>Pro</strong> cannot find a workspace file fora loaded application it uses the default workspace file xvw.cws in the etcdirectory.A <strong>CrossView</strong> <strong>Pro</strong> workspace file contains:• Window positions and sizes• Local toolbars status• Main toolbar configuration• Monitored variables in Data windows• Memory window settings• Terminal window settings• Coverage and profiling display settings in the Source window• Color settings• • • • • • • •
1−34Chapter 11.6.8 WHAT YOU MAY HAVE DONE WRONGMost problems in starting up <strong>CrossView</strong> <strong>Pro</strong> for a debugging session stemfrom improperly setting up the execution environment or from animproper connection between the host computer and the executionenvironment. Some targets will require you to enter transparency mode toset the execution environment for a debugging session. Check the notesfor your particular execution environment.Here are some other common problems:• Specifying the wrong device name when invoking the debugger.• Specifying a baud rate different from the one the executionenvironment is configured to expect.• Not supplying power to the execution environment or an attachedprobe.• Using the wrong kind of RS232 cable.• Plugging the cable into an incorrect port on the executionenvironment or host. Some target machines and hosts have severalports.• Installation of a device driver or resident application that uses thesame communications port on the host system.• The port may already be in use by another user on some UNIXhosts, or being allocated by a login process.• Specifying no or an invalid CPU type with the −C option.OVERVIEW
Overview1−351.6.9 BUILDING YOUR EXECUTABLEThe subdirectory xvw in the examples subdirectory contains a demoprogram for the <strong>C166</strong>/<strong>ST10</strong> toolchain.In order to debug your programs, you will have to compile, assemble, linkand locate them for debugging using the TASKING <strong>C166</strong>/<strong>ST10</strong> tools. Youcan do this with one call to the control program or you can use EDE, theEmbedded Development Environment (which uses a project file) or youcan call the makefile from the command line.If you want to build a complete <strong>C166</strong>/<strong>ST10</strong> executable application, themodule containing the C function main() is treated like a reset task andtherefore must be linked with C startup code. All tasks must be linked witha library, that contains, among run time routines, functions such asprintf(). The C startup code is included in the C libraries delivered withthe c166 compiler package for all memory models supported. In this case,we are using the small model, because this is the default memory modelof c166. See the <strong>C166</strong>/<strong>ST10</strong> C Cross−Compiler User’s <strong>Manual</strong> for detailedinformation on memory models and startup code.1.6.9.1 USING EDEEDE stands for "Embedded Development Environment" and is theWindows oriented Integrated Development Environment you can use withyour TASKING toolchain to design and develop your application.To use EDE on the demo program, located in the subdirectory xvw in theexamples subdirectory of the <strong>C166</strong>/<strong>ST10</strong> product tree, follow the stepsbelow.A detailed description of the process creating the sample programdemo.abs is described below. This procedure is outlined as a guide foryou to build your own executables for debugging.How to Start EDEYou can launch EDE by double−clicking on the EDE shortcut on yourdesktop.• • • • • • • •
1−36Chapter 1The EDE screen provides you with a menu bar, a toolbar (commandbuttons) and one or more windows (for example, for source files), a statusbar and numerous dialog boxes.<strong>Pro</strong>ject OptionsCompile Build Rebuild Debug On−line <strong>Manual</strong>s<strong>Pro</strong>ject WindowContains severaltabs for viewinginformation aboutprojects and otherfiles.Document WindowsUsed to view and edit files.Output WindowContains several tabs to displayand manipulate results of EDEoperations. For example, to viewthe results of builds or compiles.How to Select a ToolchainEDE supports all the TASKING toolchains. When you first start EDE, thecorrect toolchain of the product you purchased is selected and displayedin the title of the EDE desktop window.If you have more than one TASKING product installed and you want tochange toolchains, do the following:OVERVIEW1. From the <strong>Pro</strong>ject menu, select Select Toolchain...The Select Toolchain dialog appears.
Overview1−372. Select the toolchain you want. You can do this by clicking on a toolchainin the Toolchains list box and click OK.If no toolchains are present, use the Browse... or Scan Disk... button tosearch for a toolchain directory. Use the Browse... button if you know theinstallation directory of another TASKING product. Use the Scan Disk...button to search for all TASKING products present on a specific drive.Then return to step 2.How to Open an Existing <strong>Pro</strong>jectFollow these steps to open an existing project:1. From the <strong>Pro</strong>ject menu, select Set Current −>.2. Select the project file to open. For the demo program select the filedemo.pjt, located in the subdirectory xvw in the examples subdirectoryof the <strong>C166</strong>/<strong>ST10</strong> product tree. If you have used the defaults, the filedemo.pjt is in the directory installation−dir\examples\xvw.How to Load/Open FilesThe next two steps are not needed for the demo program because the filesaddone.asm and demo.c are already open. To load the file you want tolook at:1. From the <strong>Pro</strong>ject menu, select Load Files...The Choose <strong>Pro</strong>ject Files to Edit dialog appears.• • • • • • • •
1−38Chapter 12. Choose the file(s) you want to open by clicking on it. You can selectmultiple files by pressing the or key while you click on afile. With the key you can make single selections and with the key you can select everything from the first selected file to the fileyou click on. Then click OK.This launches the file(s) so you can edit it (them).Check the directory paths1. From the <strong>Pro</strong>ject menu, select Directories...The Directories dialog appears.OVERVIEW2. Check the directory paths for programs, include files and libraries. You canadd your own directories here, separated by semicolons.
Overview1−393. Click OK.How to Build the Demo ApplicationThe next step is to compile the file(s) together with its dependent files soyou can debug the application.Steps 1 and 2 are optional. Follow these steps if you want to specifyadditional build options such as to stop the build process on errors and tokeep temporary files that are generated during a build.1. From the Build menu, select Options...The Build Options dialog appears.2. Make your changes and press the OK button.3. From the Build menu, select Scan All Dependencies.4. Click on the Execute ’Make’ command button. The following button isthe execute Make button which is located in the toolbar.If there are any unsaved files, EDE will ask you in a separate dialog if youwant to save them before starting the build.• • • • • • • •
1−40Chapter 1How to View the Results of a BuildOnce the files have been processed you can inspect the generatedmessages.You can see which commands (and corresponding output captured) whichhave been executed by the build process in the Build tab:TASKING program builder vx.y rz Build nnn SN 00000000Compiling and assembling demo.cPreprocessing addone.asmAssembling addone.srcPreprocessing start.asmAssembling start.srcLinking and locating to demo.outConverting demo.out to demo.abs in IEEE−695 formatHow to Start the <strong>CrossView</strong> <strong>Pro</strong> <strong>Debugger</strong>Once the files have been compiled, assembled, linked, located andformatted they can be executed by <strong>CrossView</strong> <strong>Pro</strong>.To execute <strong>CrossView</strong> <strong>Pro</strong>:1. Click on the Debug application button. The following button is theDebug application button which is located in the toolbar.<strong>CrossView</strong> <strong>Pro</strong> is launched. <strong>CrossView</strong> <strong>Pro</strong> will automatically download thecompiled file for debugging.OVERVIEWHow to Start a New <strong>Pro</strong>jectWhen you first use EDE you need to setup a project space and add a newproject:1. From the File menu, select New <strong>Pro</strong>ject Space...The Create a New <strong>Pro</strong>ject Space dialog appears.2. Give your project space a name and then click OK.The <strong>Pro</strong>ject <strong>Pro</strong>perties dialog box appears.3. Click on the Add new project to project space button.The Add New <strong>Pro</strong>ject to <strong>Pro</strong>ject Space dialog appears.
Overview1−414. Give your project a name and then click OK.The <strong>Pro</strong>ject <strong>Pro</strong>perties dialog box then appears for you to identify the files tobe added.5. Add all the files you want to be part of your project. Then press the OKbutton. To add files, use one of the 3 methods described below.• If you do not have any source files yet, click on the Add new file toproject button in the <strong>Pro</strong>ject <strong>Pro</strong>perties dialog. Enter a new filenameand click OK.• To add existing files to a project by specifying a file pattern click onthe Scan existing files into project button in the <strong>Pro</strong>ject <strong>Pro</strong>pertiesdialog. Select the directory that contains the files you want to add toyour project. Enter one or more file patterns separated by semicolons.The button next to the Pattern field contains some predefinedpatterns. Next click OK.• To add existing files to a project by selecting individual files click onthe Add existing files to project button in the <strong>Pro</strong>ject <strong>Pro</strong>pertiesdialog. Select the directory that contains the files you want to add toyour project. Add the applicable files by double−clicking on them or byselecting them and pressing the Open button.The new project is now open.6. From the <strong>Pro</strong>ject menu, select Load Files... to open the files you want onyour EDE desktop.EDE automatically creates a makefile for the project. EDE updates themakefile every time you modify your project.• • • • • • • •
1−42Chapter 11.6.9.2 USING THE CONTROL PROGRAMA detailed description of the process creating the sample programdemo.abs is described below. This procedure is outlined as a guide foryou to build your own executables for debugging.In order to debug your programs, you will have to compile, assemble, linkand locate them for debugging using the TASKING c166 compiler packagefollowing the procedure outlined below:1. Compile your modules with −g (generate debug symbols).2. Assemble your modules with DEBUG (generate debug symbols).3. Locate with the RESERVE MEMORY control for the specific executionenvironment.4. Format the output of the locate stage into IEEE−695 format.5. Download image part of absolute IEEE−695 file to the target, usually as an<strong>CrossView</strong> <strong>Pro</strong> command line option (−i).The program is now ready to be debugged with <strong>CrossView</strong> <strong>Pro</strong>.You can do this with one call to the control program.1. Make the subdirectory xvw of the examples directory the current workingdirectory.2. Be sure that the directory of the binaries is present in the PATHenvironment variable when you work from a command prompt instead offrom EDE.3. Compile, assemble, link and locate the modules using one call to thecontrol program cc166:OVERVIEWcc166 −s −g −Ot −ieee demo.c addone.src demo.ilo−o demo.absThe −s option puts the C source text as comments into the outputassembly source files.The −g option instructs the compiler to generate symbolic debugginginformation. This option must always be specified when debugging with<strong>CrossView</strong> <strong>Pro</strong>.
Overview1−43The −Ot option is needed only to demonstrate the deliberate bug indemo.c. Normally you can omit this option.The −ieee option specifies the IEEE Std. 695 format.The −o option specifies the name of the output file.To compile for the C167 also specify the −x option. This enables allfeatures of the C167.The command in step 3 generates the object files demo.obj andaddone.obj, the locator map file demo.map and the absolute output filedemo.abs. The file demo.abs is in the IEEE Std. 695 format, and candirectly be used by <strong>CrossView</strong> <strong>Pro</strong>. No separate formatter is needed.Now you have created all the files necessary for debugging with<strong>CrossView</strong> <strong>Pro</strong> using one call to the control program.If you want to see how the control program calls the compiler, assembler,linker and locator, you can use the −v0 option or −v option. The −v0option only displays the invocations without executing them. The −voption also executes them.cc166 −s −g −Ot −ieee demo.c addone.srcdemo.ilo −o demo.abs −v0The control program shows the following command invocations withoutexecuting them (UNIX output):demo.c:+ c166 demo.c −o /tmp/cc6825c.src −e −s −g −Ot+ a166 /tmp/cc6825c.src TO demo.obj NOPRaddone.src:+ a166 addone.src TO addone.obj NOPR+ l166 LNK TO /tmp/cc6825e.lno demo.obj addone.obj 166/c166s.lib166/fp166s.lib 166/rt166s.lib+ l166 LOC TO /tmp/cc6825f.out /tmp/cc6825e.lno PR(demo) @demo.ilo+ ieee166 /tmp/cc6825f.out demo.absThe −e option removes output files after errors occur. The NOPRassembler control suppresses list file generation. The TO control has thesame function as the −o option of the other tools, and specifies the outputfilename. The PR control of the locator specifies the basename of the mapfile.• • • • • • • •
1−44Chapter 1The demo.ilo file contains the following locator invocation controls:RESERVE MEMORY(00200h to 00FFFh0FCC0h to 0FCDFh0FD00h to 0FD4Bh; Monitor code and data; Monitor register bank; Monitor data)SECSIZE( <strong>C166</strong>_US( +40 ) )NOCHECKCLASSES; No classes checkThe RESERVE control reserves areas used by the several debug monitors.The SECSIZE control increases the user stack size because the demoprogram contains a recursive function. The NOCHECKCLASSES controltells the locator not to check if all classes have a CLASSES control.The memory regions 0200h to 0FFFh, 0FCC0h to 0FCDFh and 0FD00h to0FD4Bh must be reserved by the locator, because this area is used byseveral debug monitors. See the addendum for more details on theexecution environment.As you can see, the tools use temporary files for intermediate results. Ifyou want to keep the intermediate files you can use the −tmp option. Thefollowing command makes this clear.cc166 −s −g −Ot −ieee demo.c addone.srcdemo.ilo −o demo.abs −v0 −tmpThis command produces the following output:OVERVIEW+ c166 demo.c −o demo.src −e −s −g −Ot+ a166 demo.src TO demo.obj NOPRaddone.src:+ a166 addone.src TO addone.obj NOPR+ l166 LNK TO demo.lno demo.obj addone.obj 166/c166s.lib 166/fp166s.lib166/rt166s.lib+ l166 LOC TO demo.out demo.lno PR(demo) @demo.ilo+ ieee166 demo.out demo.absAs you can see, if you use the −tmp option, the assembly source files andlinker output file will be created in your current directory also.Of course, you will get the same result if you invoke the tools separatelyusing the same calling scheme as the control program.As you can see, the control program automatically calls each tool with thecorrect options and controls.
Overview1−451.6.9.3 USING THE MAKEFILEThe subdirectories in the examples directory each contain a makefilewhich can be processed by mk166.To build the demo example follow the steps below. This procedure isoutlined as a guide for you to build your own executables for debugging.1. Make the subdirectory xvw of the examples directory the current workingdirectory.This directory contains a makefile for building the demo example. It usesthe default mk166 rules.2. Be sure that the directory of the binaries is present in the PATHenvironment variable.3. Compile, assemble, link and locate the modules using one call to theprogram builder mk166.mk166This command will build demo.abs for the C16x/<strong>ST10</strong> architecture usingthe file makefile.To see which commands are invoked by mk166 without actuallyexecuting them, type:mk166 −nThis command produces the following output:TASKING <strong>C166</strong>/<strong>ST10</strong> program builder vx.yrz Build nnnCopyright years Altium BV Serial# 00000000c166 −w183 −x −s −g −Ot demo.ca166 demo NOPRm166 addonea166 addone NOPR EXTENDl166 LINK demo.obj, addone.obj, ext/c166s.lib, ext/rt166s.lib TO demo.lnol166 LOCATE demo.lno TO demo.out @demo.iloieee166 demo.out demo.absThe −x option, the EXTEND control and the extended library in themakefile are used to specify the C16x/<strong>ST10</strong>.To remove all generated files type:mk166 clean• • • • • • • •
OVERVIEW1−46Chapter 1
CHAPTERSOFTWAREINSTALLATION2
INSTALLATION2−2Chapter 2CHAPTER2
Software Installation2−32.1 INTRODUCTIONThis chapter describes additional notes for running the <strong>CrossView</strong> <strong>Pro</strong>debugger under the X Windows environment on UNIX.Installation of the TASKING <strong>CrossView</strong> <strong>Pro</strong> debugger is part of theinstallation of the TASKING C Compiler/Assembler toolchain, which isdescribed in chapter Software Installation of the C Cross−Compiler User’s<strong>Manual</strong>.2.2 NOTE ABOUT FILENAMESMembers of the <strong>CrossView</strong> <strong>Pro</strong> family of debuggers use the followingname convention for their executables:xfw1662.3 CONFIGURING THE X WINDOWS MOTIFENVIRONMENTTo run the Motif version of <strong>CrossView</strong> <strong>Pro</strong> on a Sun, you must define theenvironment variable LD_LIBRARY_PATH to where the library filelibMrm.a resides. For example:LD_LIBRARY_PATH=/usr/dt/libexport LD_LIBRARY_PATH<strong>CrossView</strong> <strong>Pro</strong> uses a binary resource file for appearance−relatedspecifications for windows, menus, dialog boxes, and strings to beaccessed at run−time. The name of the resource file has the same name asthe executable but with .uid extension. Be sure that the .uid file ispresent in one of the following directories:• the current directory• the directory specified by the UIDPATH environment variableThe environment variable UIDPATH specifies the path used by Motif tolocate the resource (.uid) file. If not set, it is set to a default value. Theresource file is installed in the same directory as the associated executable.So, you should set UIDPATH as follows (Bourne shell syntax):UIDPATH=path_to_uid/%Uexport UIDPATH• • • • • • • •
2−4Chapter 2Replace path_to_uid by the path to the directory in which the resourcefile is installed. The %U is required.For more details refer to MrmOpenHierarchy in the OSF/Motif<strong>Pro</strong>grammer’s Reference manual.2.4 USING X RESOURCESX toolkit resources specify GUI object (widget) attributes. Resources arespecified in either the .Xdefaults file or in application class−specificfiles.The .Xdefaults file is (typically) loaded into the X server at the start ofthe session. Any changes take effect only in a new session, or after usingxrdb. Alternatively, application class resource files may be used.Application resource files have the same name as the executable<strong>CrossView</strong> <strong>Pro</strong> version they refer to (first letter NOT capitalized).Application resource files must be present either in the directory specifiedby the HOME environment variable, or in the app−defaults directory.The app−defaults directory is typically located under /usr/lib/X11.X recognizes various environment variables for specifying paths to theapplication resource files. For more information, consult the chapter on Xresources in O’Reilly’s X Toolkit Intrinsics <strong>Pro</strong>gramming <strong>Manual</strong> and yoursystem documentation.INSTALLATIONThe X resource specification allows either global (loosely) boundspecifications (*foreground: black) or per−widget instancespecifications (*button.foreground: black).The following list shows the relevant widgets used by the Motif version of<strong>CrossView</strong> <strong>Pro</strong>:Windows:TOP−LEVEL − XmMainWindow => XmDrawingAreaCHILD− XmScrolledWindow => XmDrawingAreaDialog:MODALMODELESS− XmBulletinBoard− XmBulletinBoard
Software Installation2−5Menu:MENUBARPULLDOWN− XmMenuShell− XmCascadeButtonControls:CHECKBOXRADIOBUTTONTEXTEDITLISTBOXSCROLLBARPUSHBUTTONLISTBUTTONLISTEDITGROUPBOXICONFILESELECTIONERRORPOPUP− XmToggleButton− XmToggleButton− XmLabel− XmText− XmScrolledWindow => XmList− XmScrollBar− XmPushButton− XmText & XmArrowButton &XmScrolledWindow => XmList− XmText & XmArrowButton &XmScrolledWindow => XmList− XmFrame => XmLabel− XmLable with pixmap− XmFileSelectionBox− XmMessageBox<strong>CrossView</strong> <strong>Pro</strong> repaints its windows in the default color as specified withthe Motif widget resource settings. It is possible to overrule this behaviorwith a resource setting like: "*XmDrawingArea.background: blue".<strong>CrossView</strong> <strong>Pro</strong> uses a non proportional font in all of its windows. The fontsize is selected using the "Desktop Setup dialog". You can use the "font"resource (*fontList on Motif) to select the font to be displayed in themenubar and dialogs, it won’t affect the font displayed in the <strong>CrossView</strong><strong>Pro</strong> windows.The <strong>CrossView</strong> <strong>Pro</strong> stack and data windows are implemented using aXmScrolledWindow widget on Motif.The following list show the contents of an example app−defaults fileintended for Motif environments. Of course you may adjust the colors andfont to your preferences. Sample app−defaults files are delivered withthe product in the etc directory (app_def.mwm for Motif).*fontList:*foreground:*XmMainWindow.background:7x13boldblackwhite• • • • • • • •
2−6Chapter 2*XmScrolledWindow*background:*XmDrawingArea.background:*XmBulletinBoard.background:*XmToggleButton*background:*XmLabel*background:*XmText*background:*XmScrollBar*background:*XmPushButton*background:*XmFrame*background:*XmArrowButton*background:*XmForm.background:*XmMenuShell*background:*XmCascadeButton*background:whitewhiteDarkSeaGreengraygraywhitegraygraySeaGreengraySeaGreenDarkSeaGreenSeaGreenIf you encounter any problems due to incorrect resource settings, likeinvisible text caused by identical text and background color, clear theRESOURCE_MANAGER. Use the following procedure to clear theRESOURCE_MANAGER:4. Save a copy of the .Xdefaults file located in your home directory.5. Install an empty .Xdefaults file.6. Execute xrdb −all .Xdefaults to actually clear theRESOURCE_MANAGER property.7. Restart <strong>CrossView</strong> <strong>Pro</strong> and check if windows and dialogs are displayedcorrectly.INSTALLATION8. Now you add the saved resources (one by one) back into the.Xdefaults file and execute xrdb to install them in the server. Restart<strong>CrossView</strong> <strong>Pro</strong> and check the influence of the new resource settings.Adapt your saved resources when necessary.
CHAPTERCOMMANDLANGUAGE3
LANGUAGE3−2Chapter 3CHAPTER3
Command Language3−33.1 INTRODUCTIONThe syntax and semantics of <strong>CrossView</strong> <strong>Pro</strong>’s command language isdiscussed here. This language is mainly used to enter textual commands inthe command edit field of the Command Window. The mouse and menusallow you to access most actions without knowing the command language,although the command language is more powerful. The commandlanguage is also used when evaluating expressions and in commandsassociated with assertions, breakpoints and macros. For information aboutspecific <strong>CrossView</strong> <strong>Pro</strong> commands, refer to Chapter 13, CommandReference.3.2 CROSSVIEW PRO EXPRESSIONSThere are several methods that you can use to input an expression into<strong>CrossView</strong> <strong>Pro</strong>:It is possible to display both monitored and unmonitored expressions inthe Data Window. Monitored expressions are updated after every halt inexecution. Unmonitored expressions are just one−shot inspections of theexpressions value. Refer to section 4.6, <strong>CrossView</strong> <strong>Pro</strong> Windows for adetailed description of the Data Window.To evaluate a simple expression:Double click on a variable in the Source window. The result of theexpression appears in the data window. Alternatively, depending on thepreferences you set in the Data Display Setup dialog, the expressionappears in the Evaluate Expression dialog. Click the Add Watch orAdd Show button to display the result of the expression in the DataWindow. Click the Evaluate button to display the result of the expressionin the output field of the Evaluate Expression dialog.To evaluate a complex expression:From the Data menu, select Evaluate Expression... and type in any Cexpression in the Evaluate Expression dialog box. Optionally select adisplay format. Click the Evaluate button.Type the expression into the command edit field of the CommandWindow followed by a return or click the Execute button.• • • • • • • •
3−4Chapter 3Expressions can be any length in most windows and dialog boxes;<strong>CrossView</strong> <strong>Pro</strong> provides a horizontal scroll bar if an expression exceedsthe visible length of the entry field.In <strong>CrossView</strong> <strong>Pro</strong>, C expressions may consist of a combination of numericconstants, character constants, strings, variables, register names, Coperators, function names, function calls, typecasts and some <strong>CrossView</strong><strong>Pro</strong>−specific symbols. Each of these is described in the next sections.Evaluation Precision<strong>CrossView</strong> <strong>Pro</strong> evaluates expressions using the same data types andassociated precision as used by the target architecture when evaluating thesame expression.3.3 CONSTANTS<strong>CrossView</strong> <strong>Pro</strong>, like C, supports integer, floating point and characterconstants.IntegersIntegers are numbers without decimal points. For example, <strong>CrossView</strong> <strong>Pro</strong>will treat the following as integers:5 9 23The following number, however, are not treated as integers:5.1 9.27 0.23LANGUAGENegative integers, if they appear as the first item on a line, must haveparentheses around the number:(−5)*4This is to prevent confusion with <strong>CrossView</strong> <strong>Pro</strong>’s own − (minus sign)command.In addition, <strong>CrossView</strong> <strong>Pro</strong> supports standard C octal, hexadecimal andbinary notation. You can specify a hexadecimal constant using a leading0x or a trailing H (or h). The first character must be a decimal digit, so itmay be necessary to prefix a hexadecimal number with the ’0’ character.The hexadecimal representation for decimal 16 is:0x10 or10H
Command Language3−5For the hexadecimal digits a through f you can use either upper or lowercase. The following are all correct hexadecimal representations for decimal43981:0xabcd 0xABCD 0abCdH 0AbcDhYou can specify a binary constant using a trailing B or Y (or b or y). Thefollowing are all binary representations for decimal 5:0101b 101Y 00000101BYou can specify an octal constant using a leading ’0’. The octalrepresentation for 8 decimal is:010You can use an L to indicate a long integer constant. For example,<strong>CrossView</strong> <strong>Pro</strong> will recognize the following as long integers:0L 57L 0xffL<strong>CrossView</strong> <strong>Pro</strong> uses the same ANSI C integral type promotion scheme asthe C compiler.Floating PointA floating point number requires a decimal point and at least one digitbefore the decimal point. The following are valid examples of floatingpoint numbers:12.34 5.6 7.89Exponential notation, such as 1.234e01, is not allowed. The followingare not valid floating point numbers:.02 1.234e01 5As with integers, bracket a negative number with parentheses:(−54.321)Expressions combining integers and floating point numbers will evaluateto floating point values:2.2 * 24.4• • • • • • • •
3−6Chapter 3CharacterCharacter constants are single characters or special constants that followthe C syntax for special characters. Examples of valid character constantsinclude:’m’ ’x’ ’\n’Character constants must be a single byte and are delimited by ’’ (singlequotation marks). For instance:$mychar=’m’Remember not to confuse character constants with strings. A characterconstant is a single byte, in this example, the ASCII value of m.StringsStrings are delimited by " " (double quotation marks). In C all strings endwith a null (zero) character. Strings are referenced by pointer, not byvalue. This is standard C practice. In <strong>CrossView</strong> <strong>Pro</strong>, you may assign astring literal to a variable which is of type char* (pointer to character):$ystring = "name"<strong>CrossView</strong> <strong>Pro</strong> supports the standard C character constants shown below:Code ASCII Hex FunctionLANGUAGE\b BS 08 Backspace\f FF 0C Formfeed\n NL (LF) 0A Newline\r CR 0D Carriage return\t HT 09 Horizontal tab\\ \ 5C Back slash\? ? 3F Question mark\’ ’ 27 Single quote\" " 22 Double quote\ooo3−digit octal number\xhhhhexadecimal numberTable 3−1: C character codes
Command Language3−7Trigraph sequences are not supported.3.4 VARIABLES<strong>CrossView</strong> <strong>Pro</strong> lets you use variables in the C expressions you type. Youmay reference two classes of variables: variables defined in the sourcecode and special variables.Variables defined in your source code fall into two categories: localvariables and global variables.Storage ClassesVariables may be of any C storage class. The size of each class is targetdependent. Consult the C Cross−Compiler User’s <strong>Manual</strong> for specific sizes.You may cast variables from one class to another:(long) $mycharLocal VariablesYou define local variables within a function; their values are maintained onthe stack or in registers. When the program exits the function, you loselocal variable values. This means that you can only reference localvariables when their function is active on the stack.Local variables of type static retain values between calls. Therefore, youcan reference static variables beyond their functions, but only if theirfunction is active on the stack.<strong>CrossView</strong> <strong>Pro</strong> knows whether the compiler has allocated a local variableon the stack or directly in a register and whether the register is currentlyon the stack. The compiler may move some local variables into registerswhen optimizing code.If a part of your source code looks like this:x = 5;y = x;and you stopped the program after the assignment to x, and set x toanother value, this may not prevent the second statement from setting y to5 due to "constant folding" optimizations performed by the compiler.• • • • • • • •
3−8Chapter 3Global VariablesGlobal variables are defined outside every function and are not local toany function. Global (non−static) variables are accessible at any pointduring program execution, after the system startup code has beenexecuted.Global variables can be defined static in a module. These variables canonly be accessed when a function in this module is active on the stack, orwhen that file is in the Source Window using the e command.Specifying Variables in C expressionsThe following table specifies how <strong>CrossView</strong> <strong>Pro</strong> treats different variablesin C expressions. The left column is the variable’s syntax in the expression,the right column is the <strong>CrossView</strong> <strong>Pro</strong> semantics.LANGUAGEVariable Syntaxvariablefunction#variablenumber#variable:variable$variable<strong>CrossView</strong> <strong>Pro</strong> BehaviorTable 3−2: Variables in C expressions<strong>CrossView</strong> <strong>Pro</strong> performs a scope search starting atthe current viewing position and proceeding outwards.The debugger first checks locals, local statics andparameters, followed by statics and globals explicitlydeclared in the current file. Finally, globals in otherfiles are checked.<strong>CrossView</strong> <strong>Pro</strong> searches for the first instance offunction. If found, the debugger uses the frame’saddress to perform a scope search for variable.Variables are available only if the specified function isactive. That is, the stack frame for that function can befound on the run−time stack.The frame at stack level number is used by thedebugger for the scope search. The current function isalways at stack level 0. This format is very useful ifyou are debugging a recursive function and there aremultiple instances of a variable on the stack.<strong>CrossView</strong> <strong>Pro</strong> searches for a global variable namedeither variable or _variable, in that order.<strong>CrossView</strong> <strong>Pro</strong> searches the list of special variablesfor $variable.
Command Language3−9Variables and Scoping RulesA variable is in scope at any point in the program if it is visible to the Csource code. For instance, if you have a local variable initval declaredin main(), and then step (or move the viewing position) into factorial,initval will be out of scope. You can still find the value of initval bytyping:main#initvalIn this case <strong>CrossView</strong> <strong>Pro</strong> will search the stack for the function main(),then look outwards from that function for the first occurrence of initvalin scope and report its value. Note that main() must be active, that is,program execution must have passed through main() and not yetreturned, in order for initval to have a value.You can also use the Browse... button in the Expression Evaluation dialogbox. This dialog box appears when you click the New Expression buttonin the toolbar or select Evaluate Expression... from the Data menu.Special Variables<strong>CrossView</strong> <strong>Pro</strong> maintains a set of variables that are separate from thosedefined in your program being debugged. These special variables reside inmemory on the host computer, not on the target system. They contain thevalues of the target processor’s registers, information about the debugger’sstatus, and user−defined values. Special variables are case insensitive. Usethe opt command to display and set these variables (without using the’$’−sign).The following is a list of the reserved special variables for <strong>CrossView</strong> <strong>Pro</strong>:Reserved Variable$ARG(n)$FILE$IN(function)$LINEDescriptionContains the value of the nth int−sized argument of thecurrent function. Allows access to arguments of variableargument list functions without knowing the name of theargument.Contains the name of the file that holds the currentviewing position.Contains the value 1 if the current pc is inside thespecified function, otherwise 0.Contains the line number of the current viewing position.This variable is often used in assertions to monitorprogram flow.• • • • • • • •
3−10Chapter 3LANGUAGEReserved Variable$PROCEDURE$ASMHEX$AUTOSRC$CPU$FP$MIXEDASM$MORE$PC$PIPELINE$register$SP$SYMBOLSDescriptionContains the name of the procedure at the currentviewing position.Contains a string "ON" or "OFF". The value "ON"specifies that the disassembled code as displayed in theassembly window will display hexadecimal opcodes.Default is "OFF".Contains a string "ON" or "OFF". The value "ON"specifies that the debugger will automatically switchbetween the source window and the assembly windowdisplay depending on the presence of symbolic debuginformation at the current location. The value "OFF"prevents the automatic window switching. Default is"OFF".Contains a string indicating if the current cpu type is80<strong>C166</strong> or C167. Default is 80<strong>C166</strong>.Contains the value of the frame pointer. (R0: user stackpointer)Contains a string "ON" or "OFF". The value "ON"specifies that the disassembled code as displayed in theassembly window will be intermixed with thecorresponding source lines. The value "OFF"suppresses this intermixing. Default is "ON".Contains a string "ON" or "OFF". The value "ON"specifies that the more output pager is enabled. Thevalue "OFF" disables the more output pager. Default is"ON".Contains the value of the program counter. (CSP: IP)Contains a string "ON" or "OFF". The value "ON"specifies that the pipeline should be displayed in theassembly window. Default is "OFF".Contains the value of the specified register.Contains the value of the stack pointer.Contains a string "ON" or "OFF" indicating if localsymbols and symbolic addresses (e.g. main:56+0x4)or absolute addresses are present in disassembly.Default is "ON".
Command Language3−11Reserved Variable$SRCLINENRS$SRCMERGELIMITDescriptionContains a string "ON" or "OFF". The value "ON"specifies that line numbers should be printed in thesource window. The value "OFF" suppresses printing ofline numbers. Default is "OFF".Contains the value for the source merge limit in theassembly window, the number of source lines to beintermixed in the assembly window. Value 0 indicatesthat there is no limit. Default is 0.Table 3−3: Reserved special variablesRegistersYou can reference registers and special function registers (SFRs) directly.The format is $register. For instance, type:$r1=316$R1 = 316$stkov=0xfa40$STKOV = 0xFA40$dpp3$DPP3 = 0x3$rh7=255$RH7 = 0xFF$ip$IP = 0x138AFor <strong>CrossView</strong> <strong>Pro</strong>, a fixed set of registers is always available. You can addadditional <strong>C166</strong>/<strong>ST10</strong> derivative specific SFRs in a regname.def file. Seethe C Cross−Compiler User’s <strong>Manual</strong> for more information.You can configure which (and in which order) registers must appear in theregister window in the Register Window Setup dialog (Settings | RegisterWindow Setup...).It is possible to request the address of an SFR by using the addressoperator &. The operator may even be used on an SFRBIT for thispurpose. In this case, the bit offset and the SFR where it is located in, aredisplayed. Example:• • • • • • • •
3−12Chapter 3&$mulipLocation of $MULIP is $PSW.5Operand for ’&’ incorrect&$psw0xFF10In addition to the standard register special variables, <strong>CrossView</strong> <strong>Pro</strong>supplies the special variables $pc (the program counter, composed of$csp and $ip) and $fp (the current frame pointer, which is $r0 in c166).The values of Reserved special variables cannot be changed interactively(i.e., on the <strong>CrossView</strong> <strong>Pro</strong> command line).User−defined Special VariablesDuring a debugging session, you may need some new variables for yourown debugging purposes, such as counting the number of times youencounter a breakpoint. <strong>CrossView</strong> <strong>Pro</strong> allows you to create and use yourown special variables for this purpose. <strong>CrossView</strong> <strong>Pro</strong> does not allocatespace for these variables in target memory; it maintains them on the hostcomputer.The names of these variables, which must begin with a $ (dollar sign), aredefined when they are first used. For instance:$count = 5defines a variable named $count of type int with a value of 5. Specialvariables are of the same type as the last expression they were assigned.For example:$name="john"LANGUAGEthen:$name=3*4creates a special variable $name of type (char *). The second statementcreates a special symbol $name and assigns it the value of 12 of type int.Special variables are just like any other variables, except you cannotmeaningfully take the address of them.See the startup options in Chapter 4, Using <strong>CrossView</strong> <strong>Pro</strong>.
Command Language3−133.5 FORMATTING EXPRESSIONSBy default, <strong>CrossView</strong> <strong>Pro</strong> displays the value of an expression using theappropriate format for the type of expression. <strong>CrossView</strong> <strong>Pro</strong> followsseveral simple rules for displaying variables:• The defaults are: addresses appear in hexadecimal format,characters as ASCII and integers as decimal.• There are four possible formats to show one integer value:decimal, hexadecimal, octal, and ASCII.• There are two different formats to display one floating point value:decimal real and hexadecimal. If the absolute value is either toobig or too small (with too many non−significant zeroes), thedebugger automatically converts the format to one with fixeddecimal point and exponent.• ASCII is the only format to display a string. Note that you can optfor the array format. Unpredictable characters are output as \xhh,where hh is a hexadecimal value. Control characters are output as^C.• All the values in an array appear in the same format. You are free toselect this format from the available options.• If All the values of a structure appear in the same format. You arefree to select this format from the available options.You can determine in which format a variable is displayed. Once theformat has been selected, however, you must enter values or changevalues in the appropriate format. When editing is finished, the debuggerinterprets all values in terms of the currently selected formats.You may, however, tell <strong>CrossView</strong> <strong>Pro</strong> to display an expression in aparticular format other than the default format. The format code followsthe variable, in one of two ways:The simplest method of specifying display formats is from the EvaluateExpression dialog box. To access this dialog box:• From the Data menu, select Evaluate Expression...In the Command Window, you can use several format codes shown inthe next table to specify the variable display. The format codes can beentered as:variable/format• • • • • • • •
3−14Chapter 3to display the variable in format format, or:variable@formatto display the variable’s address in format format.The structure of the formatting code is:[count] style [size]Count is the number of times to apply the format style style. Size indicatesthe number of bytes to be formatted. Both count and size must benumbers, although you may use c (char), s (short), i (int), and l (long) asshorthand for size. Legal integer format sizes are 1, 2, and 4; legal floatformat sizes are 4 and 8.Be sure not to confuse <strong>CrossView</strong> <strong>Pro</strong> format codes with C charactercodes, e.g. \a. <strong>CrossView</strong> <strong>Pro</strong> uses a forward slash / not a backward slash\.LANGUAGEStyleacDdEeFfGDescriptionPrint the specified number of characters of the character array; anypositive size is OK. Use the expression’s value as the address of thefirst byte.Print a character; any positive size is OK; default size is sizeof(char).Print in decimal; needs NO size specifier; size is sizeof(long).Print in decimal; can have a size specifier; default size issizeof(expression).Print in e" floating point notation; needs NO size specifier; default sizeis sizeof(double).Print in e" floating point notation; the size specifier can be sizeof(float)or sizeof(double); default size is sizeof(expression).Print in f" floating point notation; needs NO size specifier; default sizeis sizeof(double).Print in f" floating point notation; the size specifier can be sizeof(float)or sizeof(double); default size is sizeof(expression).Print in g" floating point notation; needs NO size specifier; default sizeis sizeof(double).
Command Language3−15StylegIinOoPpstUuXxDescriptionPrint in g" floating point notation; the size specifier can be sizeof(float)or sizeof(double); default size is sizeof(expression).Print the function, source line, and disassembled instruction at theaddress.Print the disassembled instruction at address.Print in the natural" format, based on type; use it for printing variablesthat have the same name as an <strong>CrossView</strong> <strong>Pro</strong> command.Print in octal; needs NO size specifier; size is sizeof(long).Print in octal; can have a size specifier; default size issizeof(expression).Print the name of the function at the address.Print the names of the file, function, and source line at the address.Print the specified number of characters of the string, using theexpression’s value as the address of a pointer to the first byte.Equivalent to *expression/a. If no size is specified the entire string,pointed to by expression, is printed (till nil−character).Display the type of the indicated variable or function.Print in unsigned decimal; needs NO size specifier; size issizeof(long).Print in unsigned decimal; can have a size specifier; default size issizeof(expression).Print in hexadecimal; needs NO size specifier; size is sizeof(long).Print in hexadecimal; can have a size specifier; default size issizeof(expression).Table 3−4: Format style codesFor example, typing:initval/4xsdisplays four, hexadecimal two−byte memory locations starting at theaddress of initval.The following piece of C−code can be accessed in <strong>CrossView</strong> <strong>Pro</strong> usingthe string format codes:char text[] = "Sample\n";char *ptext = text;• • • • • • • •
3−16Chapter 3texttext = 0x8200What is the address of this char arraytext/aPrint it as a stringtext = "Sample^J"ptextWhat is the contents of this pointerstring = 0x8200ptext/s Print it as a stringstring = "Sample^J"&ptext0x8210Where does ptext itself resideWith format codes, you may view the contents of memory addresses onthe screen. For instance, to dump the contents of an absolute memoryaddress range, you must think of the address being a pointer. To show(dump) the memory contents you use the C language indirection operator’*’. Example:*0x4000/2x40x4000 = 0x00DB0208 0x5A055498This command displays in hexadecimal two long words at memorylocation 0x4000 and beyond. Instead of using the size specifier in thedisplay format, you can force the address to be a pointer to unsignedlong by casting the value:*(unsigned long *)0x4000/2x0x4000 = 0x00DB0208 0x5A055498LANGUAGETo view the first four elements of the array table from the demo.cprogram, type:table/4d2table = 1 1 2 6This command displays in decimal the first four 2−byte values beginning atthe address of the array table.
Command Language3−173.6 OPERATORSStandard C Operators<strong>CrossView</strong> <strong>Pro</strong> supports the standard C operators in the ANSI definedorder of precedence. The order of precedence determines which operatorsexecute first.The semicolon character (;) separates commands on the same line. In thisway, you may type multiple commands on a single line. Commentsdelimited by /* and */ are allowed; <strong>CrossView</strong> <strong>Pro</strong> simply ignores them.() [] −> .Order of Precedence(in descending order)! ~ ++ −− + − * & (type) sizeof* // %+ −>< >=== !=&^|&&||?: = += −= *= /= %= &= ^= |= =Table 3−5: Order of precedence of standard C operatorsThe *, − and + operators appear twice since they exist as both unary andbinary operators and unary operators have higher precedence than binary.Division is represented by // (two slashes) not / (one slash). This is toavoid confusion with <strong>CrossView</strong> <strong>Pro</strong>’s format specifier syntax.• • • • • • • •
3−18Chapter 3Using AddressesTo specify an address, you may use the & operator. To determine theaddress of initval, type:&initvalIf you try to use the & operator on a local variable in a register, <strong>CrossView</strong><strong>Pro</strong> issues an error message and tells you which register holds the variable.3.7 SPECIAL EXPRESSIONSString CommandsWhenever <strong>CrossView</strong> <strong>Pro</strong> encounters an expression consisting solely of astring by itself, it simply echoes the string. For example:"hello, world\n"hello, worldUse this technique to place helpful debugging messages on breakpoints.For example, setting the following breakpoint:60 b {"now in for loop\n"; sum; C }this cause <strong>CrossView</strong> <strong>Pro</strong> to echo the message now in for loop, todisplay the value of sum in the Command Window, and to continue whenline 60 is encountered. You can also enter this breakpoint and theassociated commands via the Breakpoints dialog box, which you can openby selecting the Breakpoints... menu item from the Breakpoints menu.LANGUAGEThe Period OperandAs a shorthand, <strong>CrossView</strong> <strong>Pro</strong> supports a special operand, period ‘.’, thatstands for the value of the last expression <strong>CrossView</strong> <strong>Pro</strong> calculated. Forinstance, in the following example, the period in the second commandequals the value 11, which is the result of the previous expression:5 + 6114 * .44
Command Language3−19The period operand assumes the same size and format implied by thespecifier used to view the previous item. Thus if you look at a long as achar, a subsequent ‘.’ is considered to be one byte. Use this technique toalter specified pieces of a larger data item, such as the second highest byteof a long, without altering the rest of the long. The period operand maybe used in any context valid for other variables.‘.’ is the name of a location. When you use it, it is dereferenced like anyother name. If you want the address of something that is 30 bytes fartheron in memory, do not type .+30 as this takes the contents of dot andadds 30 to it. Type instead &.+30 which adds 30 to the address of theperiod operand.3.8 CONDITIONAL EVALUATION<strong>CrossView</strong> <strong>Pro</strong> supports the if construct. Use this construct in breakpointsand assertions to alter program flow conditionally. For example, if youreset the following breakpoint:60 b {if (sum 2) ? 1 : −1assigns the value 1 to myvar.• • • • • • • •
3−20Chapter 33.9 FUNCTIONSIn <strong>CrossView</strong> <strong>Pro</strong> expressions, you can include functions defined in theprogram’s code.Command line function calls are not supported for the <strong>C166</strong>/<strong>ST10</strong>.You can call functions through the Call a Function dialog box. Note thatonly the results of the function call are shown. You cannot enterexpressions in this field. If you want to use the results of the function callin an expression, then type the expression into the Evaluate Expressiondialog box or type in the command into the Command Window (describedin the keyboard method below).• From the Run menu, select Call a Function...• List all functions by clicking the Browse... button.• You can place parameters in the Parameters field of the Call aFunction dialog box, separated by commas, but without the usualparentheses or select from the drop−down history list.The Command Window receives the results of the function call.Type in the expression containing a function call directly into theCommand Window.To execute a function on the target type the function name and thearguments as you would do in your C program. For example,do_sub(2, 1) or: a = do_add(3,4)LANGUAGE3.10 CASE SENSITIVITYThe absolute file supplies the case sensitivity information for variablenames. It is initially case sensitive for the C language. You may toggle casesensitivity by:From the Edit menu, select Search String... to view the Search Stringdialog box. This dialog contains the Case Sensitive check box.Typing the (capital) Z command in the Command Window.
CHAPTERUSINGCROSSVIEW PRO4
USING4−2Chapter 4CHAPTER4
Using <strong>CrossView</strong> <strong>Pro</strong>4−34.1 INTRODUCTIONThis chapter and the following 8 chapters give you a comprehensivepicture of <strong>CrossView</strong> <strong>Pro</strong>’s features. In order to address the broadest rangeof expertise, the contents range from introductory examples to the moretechnical aspects and techniques of debugging with <strong>CrossView</strong> <strong>Pro</strong>. Whileit is not necessary for you to read the chapters straight through, you mayfind it especially helpful to do so. All of the examples are from the sampleprogram demo.c which comes with <strong>CrossView</strong> <strong>Pro</strong>. For a completedescription of the commands presented in this chapter, consult theCommand Reference chapter.Each <strong>CrossView</strong> <strong>Pro</strong> command introduced in the text has a matching boxsummarizing its syntax and semantics. The command description followsthese general rules:Items in bold font are the actual <strong>CrossView</strong> <strong>Pro</strong> commands: save, set.Items in italics are names for the things you should type: filename,commands. In addition, the | symbol means or. For instance, screen |filename means you can use the word "screen" or a filename in the syntax.4.2 USING THE CROSSVIEW PRO INTERFACEThis manual uses the word Windows" to generically refer to the hostcomputer system’s windowing system. On IBM−PCs and compatibles, thisis equivalent to Microsoft Windows (XP or 2000). On UNIX workstations,this refers to the X Window System. Generally, this manual makes nodistinctions between the various windowing systems unless needed toclarify the discussion.This manual assumes you possess a basic familiarity with Windowssoftware. For this reason, discussion focuses on how <strong>CrossView</strong> <strong>Pro</strong>works, rather than how to use the Window interface. For more informationon your Windows system, consult the Windows documentation providedwith your host system.You can execute most <strong>CrossView</strong> <strong>Pro</strong> commands using either mouse ortextual commands. Mouse commands are executed by means of buttonsand pull−down menus in each of the separate <strong>CrossView</strong> <strong>Pro</strong> windows.Text commands are typed at the prompt in the Command Window. Inmost cases, there is no difference in functionality between mouse and textequivalents.• • • • • • • •
4−4Chapter 4This manual discusses both methods of performing <strong>CrossView</strong> <strong>Pro</strong>functions. For a quick−reference guide to all <strong>CrossView</strong> <strong>Pro</strong> commands,refer to the Command Reference chapter.4.3 STARTING CROSSVIEW PROOnce an absolute file has been made it can be executed by <strong>CrossView</strong><strong>Pro</strong>. There are several ways to invoke <strong>CrossView</strong> <strong>Pro</strong>.From EDETo start <strong>CrossView</strong> <strong>Pro</strong> from EDE (the Embedded DevelopmentEnvironment), click on the Debug application button.From the desktopWith MS−Windows you can start <strong>CrossView</strong> <strong>Pro</strong> through the Start menu.Or in the Windows Explorer you can double−click on an absolute file ifthe .abs extension is associated with the <strong>CrossView</strong> <strong>Pro</strong> executable.On the PC, <strong>CrossView</strong> <strong>Pro</strong> is a Microsoft Windows application. As such,you must invoke it from the Windows environment.From the command lineTo begin the debugging session, type the name of the <strong>CrossView</strong> <strong>Pro</strong>debugger and optionally the name of the target program (absolute file).xfw166 [absolute−file] [option]...USING
Using <strong>CrossView</strong> <strong>Pro</strong>4−54.4 STARTUP OPTIONS<strong>CrossView</strong> <strong>Pro</strong> allows you to specify several options when you invoke theprogram. Type these startup options (or switches as they are sometimescalled) after the optional basename of the application. The basename canalso contain a path specification. In this case, <strong>CrossView</strong> <strong>Pro</strong> sets itscurrent directory to the specified path. A minus sign proceeds each option;the options can appear in any order.Note that some versions of <strong>CrossView</strong> <strong>Pro</strong> have different startup optionsand procedures than the ones described here. Please consult theaddendum (at the end of this manual), for precise information aboutstarting up <strong>CrossView</strong> <strong>Pro</strong> with your target hardware.From EDEYou can select the execution environment, setup communicationparameters, specify record and playback files and set some maximumvalues via the <strong>CrossView</strong> <strong>Pro</strong> entry of the <strong>Pro</strong>ject | <strong>Pro</strong>ject Options...dialog.From <strong>CrossView</strong> <strong>Pro</strong>You can set many of <strong>CrossView</strong> <strong>Pro</strong>’s options by using the dialog boxescalled by the Target | Settings... and File | Options... menu items. Youcan save the options in the xvw.ini file and they are automatically usedupon startup.In Windows XP or Windows 2000 (or higher), add startup options to theprogram’s property sheet:• Right−click on the <strong>CrossView</strong> <strong>Pro</strong> shortcut icon, shown in yourprogram installation folder.• Select <strong>Pro</strong>perties. The <strong>Pro</strong>gram Item <strong>Pro</strong>perties dialog boxappears.• Enter the startup options after the executable’s name in the Targetfield of the shortcut.Use menus to set options. After setting the options in the menus andselecting the appropriate options in the Save Options dialog on exit,<strong>CrossView</strong> <strong>Pro</strong> saves the settings in the file xvw.ini for future debugsessions.To start up <strong>CrossView</strong> <strong>Pro</strong> type:xfw166• • • • • • • •
USING4−6Chapter 4When your execution environment itself has a human−oriented ASCIIinterface, you can use transparency mode with the −T option. Intransparency mode you can configure the execution environment’smemory. Check the addendum, the hardware−specific section of thismanual. In−circuit emulators generally require you to map the addressspace, allocating memory ranges to the execution environment and/or thetarget system. Fortunately, this generally does not mean you need to learnyour emulator’s command set, just a rote sequence of startup commands.When your <strong>CrossView</strong> <strong>Pro</strong> version does not support transparency mode,you do not need to configure the memory, and the −T option is notneeded.If your target system supports serial communication and if the targetsystem is connected to a port other than the default port (see Chapter 1,Overview, to determine the default port for your host), you can use the −Doption to specify the port name. The default baud rate is 9600. You mayuse the −D option to specify the baud rate if the execution environment isnot the same as the default. For example:xfw166 −D rs232,com2,19200instructs <strong>CrossView</strong> <strong>Pro</strong> to use the COM2 port at 19200 baud. Mostevaluation boards use an auto baud rate detection mechanism and support19200 baud. See your execution environment in the addendum of thismanual for specific communication information.When you specify a startup option in <strong>CrossView</strong> <strong>Pro</strong>, the option overrulesthe corresponding value in the current xvw.ini file.There are many different options you can invoke when starting up<strong>CrossView</strong> <strong>Pro</strong>. The listing below gives an overview of all startup options.There are several startup options having to do with the recording andplaying back of <strong>CrossView</strong> <strong>Pro</strong> command files. See also Chapter 9,Command Recording & Playback.
Using <strong>CrossView</strong> <strong>Pro</strong>4−7Startup Option−a number−argcv "arg[,arg]..."−b number−c number−C cpu−D device_type,opt1[,opt2]−D rs232,port,speedDescriptionSets the maximum number of assertions (thedefault is 100).Pass the comma separated string of options asargc/argv argument to the program.Sets the maximum number of code breakpoints(the default is 200).Sets the maximum number of instruction trace forthe trace buffer (the default is 32).Forces CPU type selection. This option overrulesthe CPU type selection in both xvw.ini and atarget configuration file.Selects a device and specifies device specificoptions, such as communication port and baudrate. The allowed combinations for your executionenvironment are described in the manualaddendum for that specific execution environment.The following combinations are possible:Select RS−232 communication.port For PC this is COM1, COM2, COM3 orCOM4. A colon should not be added. ForUNIX this is the full path of the RS−232device driver (e.g., /dev/tty01). Bydefault <strong>CrossView</strong> <strong>Pro</strong> uses the firstRS−232 port.speed This is the baud rate used for the specifiedport. The default is 9600.−D can,baud−rate,identifier,0,time_out | board_seg | hw_index |port_IO_add,interface_card_ID,port−id | net_number | interrupt_nr |hw_channel[,manufacturer]Select CAN communication.baud−rate50, 125, 250, 500, 1000.identifierDefault is 30. This value is the sendidentifier host=>target); the receiveidentifier target=>host) is identifier+1.time_outtx/rx timeout of handle. Define to 0• • • • • • • •
4−8Chapter 4Startup Option−D parallel,portDescriptionboard_segBoard segment the interface card is usinghw_indexIndex of the hardaware (slot) (0,1,...)port_IO_addThe memory address used to access the(E)ISA card.interface_card_IDVendor specific CAN host adapter. Thisnumber, in combination with manufacturer,identifies a unique interface card.port_idPC I/O port number or I/O channel used foraccessing the (E)ISA card.net_numberLocical net number the interface card isusinginterrupt_nrInterrupt number the CAN interface card isusinghw_channelIndex of the channel (connector) (0,1,...)manufacturerName of the manufacturer of the CANinterface card. Together with theinterface_card_ID, a unique interface cardis defined.Note: The CAN ROM Monitor must bedownloaded first using one of the othercommunication methods.Select parallel communication.port For PC this is LPT1 or LPT2. Do not add acolon. For UNIX this is the full path of theparallel device driver. By default <strong>CrossView</strong><strong>Pro</strong> uses the first parallel port.USING
Using <strong>CrossView</strong> <strong>Pro</strong>4−9Startup Option−D tcp,host,port−D dev,device−file−D isa,io−port,address−−easycode−f file−−fss_root_dir="path"−G path−i−L file−n address−−orti=file−p file−P file−r fileDescriptionSelect TCP/IP communication. On UNIX thestandard TCP/IP implementation is used. OnMS−Windows the WINSOCK.DLL implementationis used.hostportThe name of the host to be accessed viaTCP/IP.The port number on host to be accessed.Use a UNIX device driver as communicationchannel. For RS−232 devices use the −D rs232option, described above.device−fileThe full path of the UNIX device file.Select communication channel to an (E)ISAinterface card in the PC.io−portPC I/O port number or I/O channel used foraccessing the (E)ISA card.addressThe memory address used to access the(E)ISA card.Enable EasyCODE support in <strong>CrossView</strong> <strong>Pro</strong>.Read command line options from file.Specify root directory for File System Simulation.Specify startup directory for <strong>CrossView</strong> <strong>Pro</strong>.Has <strong>CrossView</strong> <strong>Pro</strong> download the image of theabsolute object file.Keeps a log of <strong>CrossView</strong>−to−targetcommunications in a file. Not available for allexecution environments.Informs <strong>CrossView</strong> <strong>Pro</strong> that the program wasloaded into memory at an address other than zero.Specify the name of an OSEK/ORTI file for RTOSaware debugging.Starts playing back commands from file.Starts playing back commands from file withcommands single step.Starts recording commands in file.• • • • • • • •
4−10Chapter 4Startup Option−R file−−radm=file−RegServer−RegServerS−s number−sd directory [;directory]...−−single_instance−tcfg file−−timeout=n_seconds−T [file]−UnregServer−UnregServerS−USMDescriptionStarts recording screen output in file.Same as the radm field in the target configurationfile: specify the name of the Debug Instrument(using KDI) used for RTOS aware debugging.Register <strong>CrossView</strong> <strong>Pro</strong> as COM object.Register <strong>CrossView</strong> <strong>Pro</strong> as COM object, withoutmessage.Sets the maximum number of special variables(variables independent of the program that<strong>CrossView</strong> <strong>Pro</strong> provides for your use). The defaultis 26.Specifies the directories <strong>CrossView</strong> <strong>Pro</strong> shouldsearch for source files. Relative paths are allowed.When the N command is used to load a newsymbol file, the current directory is set to thedirectory containing the symbol file and <strong>CrossView</strong><strong>Pro</strong> now searches for source files relative to thisdirectory. Directories must be separated bysemicolons.Prevent multiple instances of <strong>CrossView</strong> <strong>Pro</strong>.Specify a target configuration file. This overrulesthe filename specified in xvw.ini. See section<strong>CrossView</strong> <strong>Pro</strong> Target Settings in the Overviewchapter.Start <strong>CrossView</strong> <strong>Pro</strong> command line batchoperation mode and terminate after n_seconds.Starts <strong>CrossView</strong> in transparency mode if present;if file is given, commands in file are sent to theexecution environment.Unregister <strong>CrossView</strong> <strong>Pro</strong> as COM object.Unregister <strong>CrossView</strong> <strong>Pro</strong> as COM object, withoutmessage.Allow "User Stack Model" debugging.USINGTable 4−1: <strong>CrossView</strong> <strong>Pro</strong> Startup Options
Using <strong>CrossView</strong> <strong>Pro</strong>4−114.4.1 WHAT YOU MAY HAVE DONE WRONGMost problems in starting up <strong>CrossView</strong> <strong>Pro</strong> for a debugging session stemfrom improperly setting up the execution environment or from animproper connection between the host computer and the executionenvironment. Some execution environments require you to entertransparency mode to set the execution environment for a debuggingsession. Check the notes for your particular execution environment andthe addendum of this manual.Here are some other common problems:• Specifying the wrong device name when invoking the debugger.• Specifying a baud rate different from the one the executionenvironment is configured to expect.• Not supplying power to the execution environment or an attachedprobe.• Using the wrong kind of communication cable.• Plugging the cable into an incorrect port. Some target machineshave several ports.• Installation of a device driver or resident applications that use thesame communications port on the host system.• The port is already in use by another user or login process on someUNIX hosts.• Specifying no or an invalid cpu type with the −C option.• Using the CAN interface requires downloading the CAN ROMMonitor first using for example the serial communication method.• • • • • • • •
4−12Chapter 44.5 THE CROSSVIEW PRO DESKTOPThe <strong>CrossView</strong> <strong>Pro</strong> desktop is the screen background in which allwindows, icons and dialog boxes appear (see figure 4−1). Under somewindowing systems, the desktop is itself a window that does not containall other <strong>CrossView</strong> <strong>Pro</strong> windows.The desktop always has the Command Window opened or iconized.Window Menu Bar ToolbarLocal Status BarMinimized WindowBreakpoint TogglesFigure 4−1: <strong>CrossView</strong> <strong>Pro</strong> DesktopDialog BoxLocal ToolbarMain Status BarScroll BarUSINGAt the top of the desktop is the Menu Bar, which contains the menusapplicable to the currently active window. Below the menu bar is the mainToolbar, from which you can execute commands to control programexecution as button functions. Except for the Command Window, thedesktop can contain other windows as well.Along the bottom of the desktop there is a Main Status Bar. The statusbar displays messages such as short help messages" when you move thecursor over any button in any <strong>CrossView</strong> <strong>Pro</strong> window.
Using <strong>CrossView</strong> <strong>Pro</strong>4−13MenusEach <strong>CrossView</strong> <strong>Pro</strong> window may have a menu associated with it. UnderMicrosoft Windows, the active window’s menu is displayed in the menubar of the desktop.Depending on your execution environment some menu items are alwaysgrayed out. For example, Communication Setup is grayed out if yourtarget is an instruction set simulator.WindowsThe debugger supports two types of windows: primary windows anddialog boxes. Dialog boxes are the windows you access from a primarywindow. For the remainder of this manual, the term window" denotes aprimary window.This manual also uses the term pop−up window. A pop−up window is aprimary window that contains supplemental information such as on−linehelp.<strong>CrossView</strong> <strong>Pro</strong> Windows are used to display information and to get userinput through either buttons, commands typed in input fields, or menuselections. Windows may be moved around the desktop, sized, oriconized. All windows can be opened from the View menu. The sectionon <strong>CrossView</strong> <strong>Pro</strong> Windows provides more detail about each window.A window is considered opened even if it is iconized (under MicrosoftWindows, this is called minimized). A window is considered closed if itdoes not exist on the desktop in any form.Dialog BoxesCertain menu items or push buttons may call up a dialog box to completean action, display information, or get additional data. No other actions canbe performed until the dialog box is closed.• • • • • • • •
USING4−14Chapter 44.5.1 MENUSEach window in <strong>CrossView</strong> <strong>Pro</strong> uses the menu as shown in figure 4−2.The method of selection of a menu item varies depending on thewindowing system being used. See your Windowing System’s manual fordetails of how to do this.Each window has a hidden control menu (the icon on the top−left of thewindow), to manipulate the window. The menu Close command in thecontrol menu closes the current window. Your implementation of thewindowing system may have additional features. See your documentationfor further details.Figure 4−2: <strong>CrossView</strong> <strong>Pro</strong> Menus
Using <strong>CrossView</strong> <strong>Pro</strong>4−154.5.1.1 LOCAL POPUP MENUSOn MS−Windows environments <strong>CrossView</strong> <strong>Pro</strong> supports local popupmenus. Local popup menus are invoked by clicking the right mousebutton. The menu contents is context sensitive. If the mouse pointer is ontop of the global (main) toolbar the Configure Toolbar dialog is shown. Ifthe mouse pointer is located in the MDI window (task window orbackground) the View Menu is shown which allows you to open newwindows.Within the Source Window four different local popup menus may appear.If the cursor is within the display area of the window the Run Menu isshown. The Run Menu contains commands associated with programexecution. If your cursor is at a breakpoint indicator, the Breakpointsdialog is shown. If the cursor is on a code coverage marker then the localpopup menu contains commands to move the cursor to the next orprevious block of (not)covered statements. If your cursor is in the profilecolumn you can change the format of the timing figures. All otherwindows have their own local popup menu. The exception to the rule isthe command window which does not have a local popup. See figure 4−3for an example of the local popup menu of the Memory Window.Figure 4−3: <strong>CrossView</strong> <strong>Pro</strong> Local Popup Menu (Memory Window)• • • • • • • •4.5.2 WINDOW OPERATIONWindows can be opened, made active, and closed.Opening WindowsThe View menu of the menu bar lists all windows. Selecting a windowname from this list causes the window to open up. Selecting a windowthat is already open brings that window to the front.
4−16Chapter 4Selecting a WindowAt any one time, a particular window is active. Most operations act (bydefault) on the active window. The active window is distinguished byhighlighting the title bar. Only one window may be active at a time. Thereare several ways to select a window (that is, make a window active).• Open the window from the View menu. If the window is alreadyopen it will be brought to the front.• Click on the window’s border (or on any portion of the window insome windowing systems). It will be brought to the front.• Select the window name from the Window menu. The window willbe made active and is brought to the front. (This option is availableunder Microsoft Windows only).Closing a WindowWindows are closed by selecting Close from the Control menu, or byclicking a Close button, as shown in figure 4−4. Selecting this item fromthe Command Window will exit <strong>CrossView</strong> <strong>Pro</strong>.Control MenuClose ButtonFigure 4−4: Closing a WindowUSING
Using <strong>CrossView</strong> <strong>Pro</strong>4−174.5.3 DIALOG BOXESThe debugger uses dialog boxes to acquire information needed tocomplete a requested operation. The debugger also uses dialog boxes todisplay information. If a button or menu item displays an ellipsis (...) afterits name, then there is an associated dialog box.For example, the dialog box shown in figure 4−5 searches for a string.This dialog box uses a list edit field to enter a search string, radio buttonsto select the search direction, a check box to specify case sensitivity andpush buttons to allow certain functions to be performed.List Edit FieldCheck BoxRadio ButtonPush ButtonsFigure 4−5: Dialog Box• • • • • • • •
4−18Chapter 44.5.4 CUSTOMIZING CROSSVIEW PROYou can customize <strong>CrossView</strong> <strong>Pro</strong>’s visual appearance and operativeparameters to best suit your debugging environment.Changing the Visual AppearanceWindows can be organized by resizing and moving them around thedesktop (see your Windowing System’s manual for details on how to dothis). All windows under Microsoft Windows have an additional Windowmenu item. This menu allows the user to arrange all opened windows ina tiled or cascaded format. In the tiled format, selected by Window | Tile,all windows become the same size. All windows are the visible, the samesize and do not overlap. In the cascaded format, selected by Window |Cascade, all open windows are changed to the same size and overlappedin a cascade with a constant vertical and horizontal offset. Iconized(minimized) windows can be automatically rearranged by selectingArrange Icons from the Window menu.See the section Using X Resources in the chapter Software Installation fordetails on changing the visual appearance of <strong>CrossView</strong> <strong>Pro</strong> under XWindows.Changing Operative ParametersYou can adjust the operative parameters for <strong>CrossView</strong> <strong>Pro</strong> using thevarious menus in <strong>CrossView</strong> <strong>Pro</strong>.In the Target menu you will find:USING• Settings: Allows you to specify the execution environment and theCPU type, and the source directories for <strong>CrossView</strong> <strong>Pro</strong>. The valuesare processed at <strong>CrossView</strong> <strong>Pro</strong> startup before executing commandsentered in the Command Window or before the target is accessed asa result of opening a window. So, first edit this dialog when youstart <strong>CrossView</strong> <strong>Pro</strong>. If you have not loaded a symbol file yet, youdo not have to restart <strong>CrossView</strong> <strong>Pro</strong>.• Communication Setup: Allows you to set parameters forcommunication between <strong>CrossView</strong> <strong>Pro</strong> and your target board.
Using <strong>CrossView</strong> <strong>Pro</strong>4−19In the File | Options... dialog you will find:• Desktop: Allows you to specify color settings for the executionposition in the Source Window and the colors used in the MemoryWindow to show how a memory location has been accessed by theapplication program. You can also specify font sizes to be used inoutput windows.• Toolbar: Allows you to configure the main toolbar to your personalpreferences.In the Tools menu you will find:• Record, Playback, and Log: Allow you to set command recordingand playback options.• Toolbox Setup, and Macro Definitions: Allow you to definemacros, and assign them to a push button in the Toolbox.In the Data menu you will find:• Data Display Setup: Allows you to specify how <strong>CrossView</strong> <strong>Pro</strong>displays data. This dialog also determines if the ExpressionEvaluation dialog box must be bypassed or not.In the Settings menu you will find:• Source Window Setup: Allows you to specify the step mode,symbolic disassembly, automatically switching between source linesand disassembly source to be displayed in the Source Window anddisplay code coverage information.• Register Window Setup: Allows you to specify the registers thatappear in the Register Window. And you can set the display formatto hexadecimal or decimal.• Memory Window Setup: Allows you to specify the mode and sizeof the data and the number of data rows and columns to be shownin the Memory Window. It also allows you to automatically refreshthe Memory Window and to display data coverage information.• Data Analysis Window Setup: Allows you to configure the graphdisplay of a Data Analysis Window.• I/O Simulation Setup: Allows you to specify the I/O streams to beused in the Terminal Windows.• • • • • • • •
4−20Chapter 4• Terminal Window Setup: Allows you to specify the input andoutput format of a Terminal Window. You can map linefeeds tocarriage−return linefeeds, wrap at the end of a line, specify bufferedinput or specify that the window must be cleared at system resetand program reset. You can also log the input and output data to afile.• Background Mode Setup: Allows you to specify which windowsto automatically refresh when running in background mode. Thisfeature is only available if it is supported by your executionenvironment.Saving Changes on ExitIf you find yourself using a particular configuration, you may want to saveyour configuration when you exit <strong>CrossView</strong> <strong>Pro</strong>:• From the File menu, select Exit or close the Command Window.• In the Save tab of the Options dialog that appears, select theoptions you want to be saved for another debug session.• Click on the Exit button in the Options dialog.<strong>CrossView</strong> <strong>Pro</strong> exits. If you selected one or more items in the Save tab ofthe Options dialog your settings are saved in the initialization filexvw.ini. This file is in the startup directory.4.5.5 CROSSVIEW PRO MESSAGES<strong>CrossView</strong> <strong>Pro</strong> communicates with you in a variety of ways. Thecommand window displays the results of commands. Important messages,such as errors, appear in dialog boxes that pop up.USING
Using <strong>CrossView</strong> <strong>Pro</strong>4−214.6 CROSSVIEW PRO WINDOWSThe two prominent windows used in <strong>CrossView</strong> <strong>Pro</strong> are the CommandWindow and the Source Window. From the Command Window you cantype <strong>CrossView</strong> <strong>Pro</strong> and emulator commands, and gain access to all otherwindows. You can accomplish most global operations from either themenu bar or the Command Window. Only from the Command Windowcan you accomplish Single step playback. When you close the CommandWindow, you exit <strong>CrossView</strong> <strong>Pro</strong>.The Source Window focuses on the program being debugged. Thiswindow controls most of the commonly−used execution operations, suchas breakpoints and searching functions.Available WindowsYou can open all <strong>CrossView</strong> <strong>Pro</strong> windows (except for the Data Analysiswindows) from the View menu by selecting the name of the window.Selecting a window in this case brings the window to front and makes itthe active window. Available windows are:• Command Window: Supports two modes: <strong>CrossView</strong> or Emulator.Displays all <strong>CrossView</strong> <strong>Pro</strong> commands and responses or Emulatorcommands and responses.• Source Window: Controls the execution of the program anddisplays the source file or disassembly.• Register Window: Displays the current state of the processor’sregisters.• Memory Window: Displays target memory and allows you tochange it.• Data Window: Displays the values of data that are beingmonitored.• Data Analysis Window: Graphically displays signal data foranalysis.• Stack Window: Displays the application’s stack trace.• Trace Window: Displays the most recently executed lines.• Terminal Windows: Can be used for I/O simulation of anapplication.• • • • • • • •
4−22Chapter 4Improving <strong>CrossView</strong> <strong>Pro</strong> Performance<strong>CrossView</strong> <strong>Pro</strong> updates every window that is open (except for the DataAnalysis windows), even if it is iconized (minimized). Keeping a windowup to date usually involves extra communication with the emulator,slowing <strong>CrossView</strong> <strong>Pro</strong> down. For instance, if the Register Window isopen, <strong>CrossView</strong> <strong>Pro</strong> asks the emulator to dump the contents of alldisplayed registers after each single step. Thus it is a good idea to keeponly those windows open that you need.4.6.1 COMMAND WINDOWThe Command Window allows you to:• Enter <strong>CrossView</strong> <strong>Pro</strong> and emulator commands from the keyboard.• View a history of <strong>CrossView</strong> <strong>Pro</strong> commands or emulator commands.• View the result of <strong>CrossView</strong> <strong>Pro</strong> commands or emulatorcommands.• Execute playback files (in single step mode).From the View menu you can specify if you want the Command Windowto be a <strong>CrossView</strong> <strong>Pro</strong> Command Window or an Emulator CommandWindow. This way you can specify whether <strong>CrossView</strong> <strong>Pro</strong> interpretscommands or they go directly to the emulator.Figure 4−6. shows the Command Window. You can type commands intothe command edit field (bottom field) or select them from the commandhistory list (middle field), edit and execute them. The command historyfield displays previously entered commands. You can select and executeone or more commands. The command history list provides you with aclear, comfortable way to re−execute specific commands or sequences ofcommands by preserving them in a scrollable list.You can switch between the history list and the command edit field byhitting the key. Hitting the key (escape) returns you to anempty edit field.USINGThe top field is the Command Output Window or the Emulator OutputWindow, depending on the type of Command Window you choose. Eachcommand, echoed from the command edit field, appears with a ’>’ prefix.<strong>CrossView</strong> <strong>Pro</strong> displays its response (or the emulator’s response if thewindow is an Emulator Command Window) to the command immediatelyfollowing the command. You can use the clear command to clear thiswindow.
Using <strong>CrossView</strong> <strong>Pro</strong>4−23<strong>CrossView</strong> Command<strong>CrossView</strong> ResponseOutput WindowCommand Edit FieldCommand History ListFigure 4−6: <strong>CrossView</strong> <strong>Pro</strong> Command WindowThe Command Window also has two push buttons that provide rapidaccess to frequently used actions. The Execute button executes thecurrent command (or sequence of commands if more than one commandis selected). Note that the or key is equivalent. Usethe Halt button to interrupt commands executing in continuous mode, orto stop the emulator. If you right−click on the border of the dialog, a quickaccess menu opens with entries for searching and setting up.The Command Window maintains a history of recently executedcommands. To re−perform previously executed commands simplydouble−click on it or select the command(s) from the command history listin the Command Window and press the Execute button. By hitting the key, it is also possible to select one or more entries. Hitting or will return you to the command edit field.The maximum number of lines saved to the <strong>CrossView</strong> <strong>Pro</strong> commandbuffer list is set during debugger startup. The default is 100 lines. Tochange the default select Command Window Setup from the Settingsmenu. This number can also be modified via a startup option. You do nothave to restart <strong>CrossView</strong> pro for these changes to take effect.• • • • • • • •
4−24Chapter 44.6.2 SOURCE WINDOWThe Source Window offers most of the debugging functions you will needon a regular basis. It allows you to:• View the source file (source lines, disassembly or both).• Set and clear assertions (not in Toolbar).• Set and clear breakpoints.• Monitor and inspect variables.• Search for strings, functions, lines, addresses.• Control execution.• Call functions (not in Toolbar) and evaluate expressions.• View code coverage information.• View profiling/timing information.An example of the source window is shown in figure 4−7.BreakpointTogglesCoverageMarkers<strong>Pro</strong>filingCurrentExecution PositionStatusBarFigure 4−7: <strong>CrossView</strong> <strong>Pro</strong> Source WindowUSINGYou can specify the step mode, symbolic disassembly and source lines /disassembly with the Source Window Setup dialog box (Settings | SourceWindow Setup...) or with Run | Step Mode. Alteratively, you can use thedrop−down menus in the Source Window’s status bar.
Using <strong>CrossView</strong> <strong>Pro</strong>4−25The default step modes are:Source lines Window:Source line stepDisassembly Window:Instruction stepSource and Disassembly Window: mode of previous window!(assumes the step mode of the previous Source Window setting)The location of the cursor is also the viewing position. The line numberand address of the viewing position, appears at the top−left position of theSource Window. This does NOT represent the current execution position($pc). The current execution position appears in reverse or blue color.The cursor appears as a dotted line.On MS−Windows the so−called "quick watch" feature is supported. Whenyou position the mouse cursor over a variable or a function, a bubble helpbox appears showing the value of the variable or the type information ofthe function respectively.A green colored toggle shows that no breakpoint is set. A red coloredtoggle indicates an installed breakpoint. An orange colored toggleindicates an installed but disabled breakpoint. If code coverage is enabled,coverage markers appear to the right of the breakpoint toggles. If acheckmark appears next to a line, it has been executed. If no checkmarkappears next to a line, it has not been executed.The Source Window provides a local Toolbar containing the followingbuttons, nearly all of which are shortcuts (using selected text) tooperations that you can perform via the menu bar:Stop program or commandRun or continue execution (same as F5)Run to cursor (same as F7)Step (over function calls)Step (into function calls)Restart applicationFind program counter (PC)• • • • • • • •
4−26Chapter 4Show selected source expressionWatch selected source expressionFind symbolSearch for a text stringRepeat search for text stringEdit current source fileEdit breakpoint at cursorDisplay code coverageDisplay profilingYou can toggle the appearance of this local toolbar by selecting LocalToolbars | Source from the View menu.Edit SourceTo edit the current source file in the Source Window, select Edit | EditSource or press the Edit Source button. On MS−Windows the Codewrighteditor will be called with the filename and line number of the file that iscurrently in the debugger. on UNIX systems the xvwedit program will becalled with the filename and line number of the file that is currently in thedebugger.The xvwedit program is a shell script. You can adapt it to your specificrequirements.USING
Using <strong>CrossView</strong> <strong>Pro</strong>4−274.6.3 REGISTER WINDOWFigure 4−8 shows the Register Window. This window allows you to viewand edit register contents.Figure 4−8: <strong>CrossView</strong> <strong>Pro</strong> Register WindowNote that the contents of the Register Window for your particular targetmay be different from the one shown in figure 4−8.You can specify which register set definition appears in the RegisterWindow with the Register Window Setup dialog box (Settings | RegisterWindow Setup...). In this dialog you can also specify the display formatof values in the Register Window: hexadecimal or decimal.<strong>CrossView</strong> <strong>Pro</strong> supports multiple Register Windows. Register Windowseither have the title "Register" or "Register − register set name". The"Register" title indicates the default register set.In−situ editing allows you to change the registers contents directly byclicking on the corresponding cell.• • • • • • • •
4−28Chapter 44.6.4 MEMORY WINDOWThe Memory Window is shown in figure 4−9. This window allows you toview and edit the target memory.Depending on the setting of the Automatically refresh check box in theMemory Window Setup dialog, <strong>CrossView</strong> <strong>Pro</strong> updates the displayedvalues every time the program is stopped or only updates the values byuser request. For example, by pressing the Update Memory Windowbutton located on the toolbar.Figure 4−9: <strong>CrossView</strong> <strong>Pro</strong> Memory WindowTo edit the target memory, click on a memory cell and type a new value.To display another memory region: click on an address cell and type anew address. <strong>CrossView</strong> <strong>Pro</strong> accepts input in symbolic format, so you canenter expressions instead of just values.USING<strong>CrossView</strong> <strong>Pro</strong> supports multiple instances of the Memory Window. If yourtarget supports multiple memory spaces, the Memory Window supportsthem all. Refer to the section about memory space keywords to becomefamiliar with the memory space keywords and associated syntax yourtarget system uses.
Using <strong>CrossView</strong> <strong>Pro</strong>4−29You can specify the way data appears in the Memory Window by openingthe Memory Window Setup dialog. From the Settings menu, selectMemory Window Setup... to open this dialog. The memory contents canappear in many formats including ASCII character, hexadecimal, decimal,signed, unsigned, and floating point formats. You can specify the size ofthe memory window. You specify the number of memory cells thatappear within the window. The number of cells is fixed in the sense that ifyou re−size the window the number of cells does not change.Besides the current value of memory locations, the Memory Window alsodisplays whether memory locations have been accessed during programexecution. This is called ’data coverage’. An application program may readfrom, write to, or fetch an instruction from a memory location. Of courseall combinations may be legal. Although writing data to a memory locationfrom which an instruction has been fetched is suspicious. All types ofaccesss, read, write, fetch or combinations of these, can be shown usingdifferent foreground and background colors. The color combination usedto show "rwx" access are specified in the Desktop Setup dialog. Changethe background color if instructions are fetched from a memory location,and change the foreground color to show read and write access.You can display data coverage information in the Memory Window byclicking on the Coverage button in the Memory Window or by setting theDisplay data/code coverage check box in the Memory Window Setupdialog.The Memory Window has the ability to highlight memory cells of whichthe contents have been changed. Click on the Highlight Value Changesbutton in the Memory Window to see the changed cells. With the FreezeHighlight Reference Values button you can enter a new reference pointfor highlighting. All the cells that have been changed since that referencepoint are highlighted.The Memory Window provides a local Toolbar containing the followingbuttons:Fill memoryFill single memory addressCopy memoryFind memory• • • • • • • •
USING4−30Chapter 4Display data coverageHighlight changed valuesSet highlighted values as referenceRefresh memory windowYou can toggle the appearance of this local toolbar by selecting LocalToolbars | Memory from the View menu.4.6.5 DATA WINDOWThe Data Window is shown in figure 4−10. This window allows you toshow the value of monitored expressions and variables.The Data Window updates the values shown every time the programstops, and after an o command.It is possible to display both monitored and unmonitored data expressionsin the Data Window. <strong>CrossView</strong> <strong>Pro</strong> monitors and updates "WATCH"expressions after every halt in execution, and marks them with the text"WATCH" at the start of the display line in the Data Window. "SHOW"expressions, on the other hand, are one−shot inspections of anexpression’s value, and <strong>CrossView</strong> <strong>Pro</strong> does not update them until youclick on the Update Selected Data Item button or Update Old DataItems button. When a "SHOW" expressions is no longer actual, it ismarked with the word OLD".
Using <strong>CrossView</strong> <strong>Pro</strong>4−31Figure 4−10: <strong>CrossView</strong> <strong>Pro</strong> Data WindowTo set the default display format of the data shown, select the properformat in the Data | Data Display Setup... dialog.To inspect the value of global variables and data structures, double−clickon the variable name in the Source Window. Depending on preferencesyou set in the Data Display Setup dialog, the variable appears immediatelyin the Data Window, see figure 4−10, or the Expression Evaluation dialogappears first.In−situ editing allows you to change the contents of everything in thiswindow by clicking the value you want to change.If you have set the Display addresses check box in the Data DisplaySetup dialog box the addresses of the variables are also shown.Pointers, structures and arrays displayed in the data window have acompact and expanded form. The compact form for a structure is just, while the expanded form shows all the fields. The compactform of a pointer is the value of the pointer, while the expanded formshows the pointed−to object. Indicate the compact form by putting a ’+’ atthe start of the display. (i.e., the object is expandable), and indicate theexpanded form with (i.e., the object is contractible). Nesting is supported,so you can expand structures within structures ad infinitum.• • • • • • • •
4−32Chapter 4To expand a pointer, structure or an array, double−click on the ’+’ in theData Window.The Data Window provides a local Toolbar containing the followingbuttons:Show or watch a new expressionToggle watch attribute of selected item "on" or "off"Reformat selected itemUpdate selected data itemDelete selected data itemUpdate old data itemsDelete old data itemsYou can toggle the appearance of this local toolbar by selecting LocalToolbars | Data from the View menu.The auto−watch locals feature may be activated or deactivated. Whenactive, a selected Data Window becomes the "auto−watch" window, andall local variables from the current top−of−stack frame appear in that DataWindow. The text LOCAL" appears at the start of the display for variablesdisplayed in this manner. As the execution position changes, theauto−watch window deletes and adds locals as necessary, so that the localson the current top−of stack frame always appear.To see the value of the local variables of a function, Select Data | WatchLocals Window from the View menu.USING<strong>CrossView</strong> <strong>Pro</strong> supports multiple Data Windows. Data Windows eitherhave the title "Data Window #n" or "All Local Variables". The "All LocalVariables" title indicates the auto−watch window if it exists (as explainedabove).
Using <strong>CrossView</strong> <strong>Pro</strong>4−334.6.6 STACK WINDOWThe stack records the return addresses of all functions the application hascalled, and <strong>CrossView</strong> <strong>Pro</strong> can use this information to reconstruct the pathto the current execution position. The Stack Window, shown in figure4−11, displays the function calls on the stack with the values of theparameters passed to them in an easily accessible and understandableform.The Stack Window can help you assess program execution and allows youto view parameter values. The stack window allows you to:• View the stack trace which includes information about functionnames, parameter values, source line numbers and stack level.• Easily switch to the call statement of a stack level by clicking on itonce.• Set temporary and permanent breakpoints at any level of the stack,by double−clicking on the desired level.Figure 4−11: <strong>CrossView</strong> <strong>Pro</strong> Stack Window with Toolbar• • • • • • • •
4−34Chapter 4The Stack Window provides a local Toolbar containing the followingbuttons:Set stack breakpoint after call to functionSet stack breakpoint at function entry pointShow local variables in selected stack frameWatch local variables in selected stack frameFind call siteYou can toggle the appearance of this local toolbar by selecting the LocalToolbars | Stack from the View menu.4.6.7 TRACE WINDOWThe Trace Window, shown in figure 4−12, allows you to:• Display the most recently executed lines of code.<strong>CrossView</strong> <strong>Pro</strong> automatically updates the Trace Window each time you haltexecution, as long as the window is open, allowing you to check theprogress and flow of your program throughout the debugging session.The Trace Window is only supported if your execution environmentsupports the trace facility.USINGFigure 4−12: <strong>CrossView</strong> <strong>Pro</strong> Trace Window
Using <strong>CrossView</strong> <strong>Pro</strong>4−354.6.8 TERMINAL WINDOWThe Terminal Windows, shown in figure 4−13, let you observe and test theinput and output of your program.The <strong>CrossView</strong> <strong>Pro</strong> Terminal windows provide an interface to exchangedata with the application on the target. This I/O facility can beimplemented in various ways. Using standard I/O stream function calls likeprintf() in your source, you can test I/O to and from the target system orsimulator.The File System Simulation feature redirects I/O to a Terminal Window ifthe filename FSS_window:window_name is used in the "open" call,window_name is the name of a Terminal Window.A terminal window can be connected to multiple I/O streams of varioustypes. For example, streams 0, 1 and 2 can be mapped to one terminalwindow. An I/O stream, however, can be mapped to one terminal windowonly. Each terminal window must have a unique name.Figure 4−13: <strong>CrossView</strong> <strong>Pro</strong> Terminal Windows• • • • • • • •
4−36Chapter 4You can specify the characteristics of the Terminal Window by opening theTerminal Window Setup dialog. From the Settings menu, select TerminalWindow Setup... to open this dialog, or click with the right mouse buttonin the Terminal Window to bring up a popup menu and select Setup....You can specify the input and output format of the terminal window. Theinput format can be a VT100−like terminal. The output format can be aVT100 terminal, display control codes, decimal, octal or hexadecimal. Youcan map linefeeds to carriage−return linefeeds, wrap at the end of a line,specify buffered input or specify that the window must be cleared atsystem reset and program reset. You can also log the input and outputdata to a file.The default size of a terminal window is 24 lines of 80 characters.Everything that scrolls outside this window is lost. The visual window sizecan be smaller (scroll−bars are shown). You can specify another size in theTerminal Window Setup dialog.Each terminal window has a local popup menu, which you can activate byclicking the right mouse button.Figure 4−14: Terminal Window Local Popup MenuReset clears the contents of the terminal window and it also clears allattributes set with escape sequences. A Clear just clears the contents of aterminal window. Reverse changes the foreground and background colorsand Local echo enables echoing back of typed characters in a terminalwindow. Setup... opens the Terminal Window Setup dialog.USINGYou can connect an I/O stream to a terminal window in the Connectionstab of the Settings | I/O Simulation Setup... dialog box.
Using <strong>CrossView</strong> <strong>Pro</strong>4−374.6.9 DATA ANALYSIS WINDOW<strong>CrossView</strong> <strong>Pro</strong> incorporates an advanced signal analysis interface designedto enable developers to monitor signal data more critically and thoroughly.This feature is useful when developing signal processing software forapplication areas such as communication, wireless and image processing.Contrary to the other <strong>CrossView</strong> <strong>Pro</strong> windows the Data Analysis window(as shown in figure 4−15) is not opened from the View menu, but isopened as result of processing a data analysis script (or from the Settingsmenu). Most other <strong>CrossView</strong> <strong>Pro</strong> windows are updated whenever thetarget application stops execution due to, for example, a breakpoint. TheData Analysis window is only updated on user request. This is donebecause a large set of data is shown in the Data Analysis window and thisset of data must be available and complete at the time the window isupdated. Therefore, the user normally constructs a complex breakpoint totrigger the update of the Data Analysis window.Figure 4−15: <strong>CrossView</strong> <strong>Pro</strong> Data Analysis WindowThe Data Analysis Window provides a local Toolbar containing thefollowing buttons:Zoom in horizontallyZoom out horizontally• • • • • • • •
USING4−38Chapter 4Unzoom horizontally to normal (show all collected data)Zoom in verticallyZoom out verticallyUnzoom vertically to normal (show all collected data)Update Data Analysis windowThe graph displayed in the Data Analysis window is constructed byprocessing a CXL script. Refer to the CXL syntax specification in AppendixB, <strong>CrossView</strong> Extension Language (CXL), for details. TASKING providesscripts for standard signal analysis such as FFT. However, the programmercan write CXL scripts and process the data in the format he desires.See section 11.5, Data Analysis, for more details on data analysis.4.6.10 POP−UP WINDOWSFinally, two more windows can appear in certain situations:Help Window: Activated with function key F1 or when a Help button ispressed inside a dialog.Toolbox: This window contains user defined buttons.
Using <strong>CrossView</strong> <strong>Pro</strong>4−394.7 CONTROL OPERATIONS FOR CROSSVIEW PROAll control operations can take place in any <strong>CrossView</strong> <strong>Pro</strong> Window. Youcan select and save startup options. You can record and play backplayback files. You can define macros and assign them a button in thetoolbox (allowing you to configure up 16 buttons).4.7.1 ECHOING COMMANDSThe Command Window echoes every command given to <strong>CrossView</strong> <strong>Pro</strong>.<strong>CrossView</strong> <strong>Pro</strong> translates most button actions and menu selections into the<strong>CrossView</strong> <strong>Pro</strong> keyboard command equivalents. The Command Windowechoes the equivalent commands just as if you had typed them there.4.7.2 MOUSE/MENU/COMMAND EQUIVALENTSActions in <strong>CrossView</strong> <strong>Pro</strong> are performed by using keyboard commandstyped into the Command Window, selecting a menu item, by clicking on apush button and sometimes by direct manipulation of objects with themouse. Many actions can be accomplished several ways. For instancethere are three different ways to set a breakpoint. You can:1. Use the line b command in the command entry field.2. Click on a breakpoint toggle in the Source Window.3. From the Breakpoints menu, select Breakpoints... to open up theBreakpoints dialog box.• • • • • • • •
4−40Chapter 44.8 USING THE ON−LINE HELP<strong>CrossView</strong> <strong>Pro</strong> has an extensive on−line help system to aid you. Helptopics cover all <strong>CrossView</strong> <strong>Pro</strong> Windows, commands, and dialog boxes.4.8.1 ACCESSING ON−LINE HELPYou can access help in several ways:1. Click the Help button on a dialog boxOpens the help system with information about how to perform the task orabout the meaning of the dialog.2. Click on the question mark in the upper right corner of a dialog, then clickthe element in the dialog you want help on.A yellow box briefly explains the element you asked help on.3. Select the Help | Help menu item or press the F1−key.Opens the help system with information about the active window.4. Hover the mouse pointer over a toolbar button.A yellow box shows the title of the button. A more complete description isshown in the status bar at the bottom of the screen.4.8.2 USING MS−WINDOWS HELPYou enter help at a topic that explains the current window or dialog. Byclicking on links, you can follow different paths. To return to your startingpoint click the Back button or open the Options | Display HistoryWindow and click on the node that you want to return to.USINGThe Contents tab displays a list of main subjects. The Index tab displaysa list of keywords that relate to certain topics. When you click the Findtab, you can search for a string pattern.To save time, you can iconize the Help Window and maximize it whennecessary.
CHAPTERCONTROLLINGPROGRAMEXECUTION5
5−2Chapter 5PROGRAM EXECUTIONCHAPTER5
Controlling <strong>Pro</strong>gram Execution5−35.1 SOURCE POSITIONINGWhen you have the Source Window open and it displays a source file,there are two points of reference to keep in mind: the execution positionand the viewing position.The execution position refers to the line of source at the <strong>Pro</strong>gramCounter address. This line is always the next statement or instruction to beexecuted. When you load a file into the Source Window, <strong>CrossView</strong> <strong>Pro</strong>automatically displays the portion of the source code that contains theexecution position.The viewing position (also called ’cursor’) is the line currently beingexamined in the displayed source file. Since many Source Windowoperations act on this line, you can think of the viewing position as the’current line’. For instance, if you set a breakpoint without specifying a linenumber, <strong>CrossView</strong> <strong>Pro</strong> sets the breakpoint at the line marked by theviewing position. Please note that it is the viewing position that appears tothe left of the Source Window (NOT the execution position!).The execution position and the viewing position refer to the same linewhen a source file is first loaded into the Source Window. You can thenchange the viewing position, if you wish.The execution position and the viewing position appear different todistinguish them from the rest of the source code. The execution positionline appears in the execution position highlight colors, while the viewingposition appears as a broken−line frame, also called the cursor. Note thata line containing a breakpoint appears in the breakpoint highlight colors.A combination of execution position, cursor and breakpoint (all of whichare potentially active on the same line) appear accordingly.• • • • • • • •
5−4Chapter 55.1.1 CHANGING THE VIEWING POSITIONWhen a program is active the viewing position is always visible in theSource Window. You can change the viewing position to move throughoutthe source file. Usually, whenever the execution position changes, theviewing position automatically follows suit. But you may easily change theviewing position without affecting the execution position.To change the viewing position use any of the following possibilities:• Use the vertical scroll bar to move a line or a page at a time. Theview point stays on the same line until it is no longer visible. Itthen stays on the first or last line of the display, depending on thedirection of scrolling.• Click on the desired, unmarked source line.• From the Edit menu, select Find Line... to specify to whichparticular line you wish to move.PROGRAM EXECUTIONIn the upper−left corner of the Source Window, there are two text fields.These fields show the line number of the current viewing position and theaddress of the first machine instruction for that line. <strong>CrossView</strong> <strong>Pro</strong>updates the Line and Address values each time the viewing positionchanges.You can change the viewing position to the first executable line of aparticular function with the e command. For instance:e mainwill make the first executable line of main() the current viewing positionand display it in the Source window. You may also use the stack depth asan argument, if you place it before the e:1 eThis will change the viewing position to stack depth 1, that is, the line thatcalled the current function.FUNCTION:COMMAND:Change the viewing position.stack ee function
Controlling <strong>Pro</strong>gram Execution5−5To change the viewing position to a specified address, you can use the eicommand. This command is useful for viewing some code in the assemblywindow, without changing the program counter, since the executionposition is not changed.FUNCTION:COMMAND:Change the viewing position to address.address ei5.1.2 CHANGING THE EXECUTION POSITIONThere may be times when you want to start or resume execution at adifferent line than the one marked by the current execution position.Exercise caution when changing the execution position. Often each line ofC source code compiles into several machine language instructions.Moving the program counter to a new address in the middle of a series ofrelated assembly instructions is sometimes risky. Moreover, even thoughyou change the program counter, registers and variables may not have theexpected values if you bypass parts of the code.In the Source Window you can change the execution position to theviewing position with the menu entry Run | Jump to Cursor. This menuentry is disabled in Source file window mode to prevent problems byskidding pieces of C code which are required to be executed. See also theg and gi commands below.When the program halts, you can change the execution position with the gcommand in the Command Window. The g command moves theexecution position, but does not continue the program. To resumeexecution from your new execution position, use the C command.Although risky, the g command does have its uses, especially inconjunction with breakpoints to patch code. Refer to the Breakpoints andAssertions chapter for more information.For example, to change the execution position from the current line, 54, toline 62, enter:g 62• • • • • • • •
5−6Chapter 5When you resume execution in this program, it is from line 62 instead ofline 54.FUNCTION:COMMAND:Change the execution position to a specified C sourcelineg line_numberYou can also change the execution position to a specified address directly,although the same warnings apply. To do so, use the gi command. Forinstance:0x800 giFUNCTION:COMMAND:Change the execution position to address.address giPROGRAM EXECUTIONOf course, moving the program counter (gi command) is even morepotentially reckless than using the g command. Use both with cautionespecially when debugging a program which has instructions re−ordereddue to optimizations.To determine the address of a line of source, use the P command:80 P80:(0x1486): sum = sum + 1;The hexadecimal number in parentheses is the instruction address for line80.FUNCTION:COMMAND:Print a source line and its instruction address.line_number P
Controlling <strong>Pro</strong>gram Execution5−75.1.3 SYNCHRONIZING THE EXECUTION ANDVIEWING POSITIONSEach time you stop execution, the position of the program counter (PC) isvisible in the source window. However, it may disappear from the windowwhen scrolling through the source or when you loaded a new program.To find the program counter again:Click on the Find PC button in the Source Window or select Find PCfrom the Edit menu.From the Command Window, use the L command.The L CommandThe L command is shorthand for 0 e. It synchronizes the viewing and theexecution positions, adjusting the viewing position if the two are different.The L command never affects the execution position. The L command isuseful if you have changed your viewing position and do not rememberwhere your execution position is.FUNCTION:COMMAND:Synchronize viewing and execution position.L• • • • • • • •
5−8Chapter 55.2 CONTROLLING PROGRAM EXECUTIONUsing the mouse in the Source Window, you can direct the execution ofyour source programs. Among your options are:• Starting execution from the first instruction or from the currentexecution position.• <strong>Manual</strong>ly stopping execution whenever you want.• Executing the program a single line at a time.• Executing functions by calling them directly.5.2.1 STARTING THE PROGRAMTo restart a program from its first instruction:Click on the Restart program button in the Source Window.or:PROGRAM EXECUTION• From the Run menu, select Reset Application• From the Run menu, select Run, or click on the Run/Continuebutton.Type the R command from the Command Window.This is NOT a target system reset. Refer to the rst command forinformation about side effects that may be introduced due to a targetsystem reset.After restarting a program, you can stop execution only by a breakpoint,an assertion or a halt operation from the user.FUNCTION:COMMAND:Reset program; run program.R
Controlling <strong>Pro</strong>gram Execution5−95.2.2 HALTING AND CONTINUING EXECUTIONTo stop or continue execution:Click on the Halt button in the Source Window to stop execution. Clickon the Run/Continue button to resume execution.From the Run menu selct Halt to stop execution. Select the Run menuitem to resume execution.Use the C command or function key F5 to resume execution.When you halt the program, all the active windows update automaticallyto reflect the program’s current status. For instance, if you have anyexpressions monitored in the Data Window, their current value appears.Note that when you use any of the above methods to stop the program,<strong>CrossView</strong> <strong>Pro</strong> halts at the machine instruction that was on wheninterrupted. While this is a convenient way to stop the program, it ishardly an accurate one you may stop execution in the middle of a Csource statement.To stop a program at a precise line of C source code, set a breakpoint. Formore about breakpoints see the Breakpoints and Assertions chapter.When continuing, <strong>CrossView</strong> <strong>Pro</strong> resumes execution as if the program hadnever stopped.FUNCTION:COMMAND:Continue execution from the current execution position.C5.2.3 SINGLE−STEP EXECUTIONWhen the program stops, you can continue execution, or you can stepthrough it one line or instruction at a time. This is called single−stepexecution.• • • • • • • •
5−10Chapter 5Single−stepping is a valuable tool for debugging your programs. The effectis to watch your programs run in stop motion. You can observe the valuesof variables, registers, and the stack at a precise point in a program’sexecution. You can catch many potential bugs by watching a program runline by line.When you single step, <strong>CrossView</strong> <strong>Pro</strong> normally executes one line of yoursource and advances to the next sequential line of the program. If yousingle step to a line that contains a function call, however, you have twooptions: step into the function or step over the function call.Source Single−Step IntoThere are several methods you can use to single step into:Click on the Step Into button in the Source Window or select Step Intofrom the Run menu.PROGRAM EXECUTIONPress function key F8 or type the s command in the Command Window.You have the option of setting the number of lines you want to execute.For example, to execute 2 lines of the program, type: 2 s.FUNCTION:COMMAND:Step through a program one source line at a time.number sStepping Into FunctionsStepping into a function means that <strong>CrossView</strong> <strong>Pro</strong> enters the function andexecutes its prologue machine instructions, halting at the first C statement.When you reach the end of the function, <strong>CrossView</strong> <strong>Pro</strong> brings you backto the line after the function call and continues with the flow of theprogram. The debugger changes the source code file displayed in theSource Window, if necessary.If you accidentally step into a function that you meant to step over, youcan select Return from Function from the Run menu to escape quickly.For example, suppose you are at line 59 of a file, which contains a call tothe function factorial():main#59:table[ loopvar ] = factorial(loopvar)
Controlling <strong>Pro</strong>gram Execution5−11By performing one Step Into action, you can step into the source code forfactorial(). Your Execution and viewing position change to:factorial#103: char locvar = ’x’;<strong>CrossView</strong> <strong>Pro</strong> shows you the current function and line number and the Csource code for the current execution position.Source Single−Step OverTo step over a statement or a function call:Click on the Step Over button in the Source Window or select the StepOver from the Run menu.Press function key F10 or enter the S command in the Command Window.You have the option of setting the number of lines you want the debuggerto execute. For example, to execute three lines of source, single steppingover functions, enter: 3 S.FUNCTION:COMMAND:Single step, but treat function calls as single statements.number SStepping over FunctionsStepping over a function means that <strong>CrossView</strong> <strong>Pro</strong> treats function calls asa single statements and advances to the next line in the source. This is auseful operation if a function has already been debugged or if you do notwant to take the time to step through a function line by line.For example, suppose you reach line 59 in demo.c, which calls thefunction factorial(), as in the example above. If you give a Step Overcommand, the execution position moves to line 60 of the source code inthe main() function immediately, without entering the source code forfactorial(). <strong>CrossView</strong> <strong>Pro</strong> has executed the function call as a singlestatement.• • • • • • • •
5−12Chapter 5If you try to step over a function that contains a breakpoint or that callsanother function with a breakpoint, <strong>CrossView</strong> <strong>Pro</strong> halts at that breakpoint.Once execution stops, the step over command is complete. Therefore, ifyou resume execution by clicking on the Run button or with the Ccommand, you do not regain control at the entrance to the function withthe breakpoint. You can either single step through the rest of the function,or select the Run | Return from Function menu item to return to theline after the point of entry.5.2.4 STEPPING THROUGH AT THE MACHINE LEVELWhile single stepping through code at the source level is informative, youmight need a lower level approach. <strong>CrossView</strong> <strong>Pro</strong> can step through aprogram at the assembly language instruction level.PROGRAM EXECUTIONWhile more time−consuming than a source level step−through, aninstruction level step−through allows you to examine how your code hasbeen compiled. As you advance through the assembly instructions, noticehow <strong>CrossView</strong> <strong>Pro</strong> translates data addresses to variable names, andcorrelates branch addresses to points in the source code. This makes itmuch easier to follow the source at the instruction level.The default step modes are:Source lines Window:Source line stepDisassembly Window:Instruction stepSource and Disassembly Window: mode of previous window!(assumes the step mode of the previous Source Window setting)Mouse and menu actions:• The Step Into and Step Over buttons, and Run | Step Over andRun | Step Into menus can be set to step by instructions byselecting Run | Step Mode | Instruction step from the menu bar.• To change back to stepping by source lines, select Run | StepMode | Source line step.• Another way to set the step mode is to select the Source line stepor Instruction step radio button in the Settings | SourceWindow Setup dialog box.
Controlling <strong>Pro</strong>gram Execution5−13To control this function from the Command Window, use the Si and sicommands. The Si and the si commands are analogous to the S and scommands, Si will treat function calls (more precisely, jump to subroutineinstructions) as single statements, while si will enter the function.FUNCTION:COMMAND:Single step at instruction level. Step into functions.number siFUNCTION:COMMAND:Single step at instruction level. Step over functions.number SiAs an example of stepping through instruction level code, restart theprogram. Then select Run | Step Mode | Instruction step. Once itstops at the breakpoint you installed, advance execution one assemblylanguage instruction at a time by using the Step Over and Step Intobuttons. Or give the Si or si commands.<strong>CrossView</strong> <strong>Pro</strong> will display disassembly of the next machine instructionthat forms part of the C code in the Command Output Window:main#47+0x4:disassembled instructionDifferent types of targets, of course, have different assembly code, sodebugging at the assembly level is hardware dependent.Notice that a single C statement is usually compiled into several,sometimes many, machine instructions.<strong>CrossView</strong> <strong>Pro</strong> supports debugging on machine instruction level using theIntermixed or Assembly mode of the Source Window.• • • • • • • •
5−14Chapter 55.3 NOTES ABOUT PROGRAM EXECUTIONIf you stop the program in a module without debug symbols, then an S ors command attempts to step to a module with symbols. <strong>CrossView</strong> <strong>Pro</strong>does this by searching the run−time stack for a return address in a modulewith symbols, then setting a temporary breakpoint there, and running. Thisprocess relies on two assumptions: that the stack layout is uniform, andthat each function eventually returns. In the unlikely event that theseassumptions are violated, the program may run away when you attempt tosingle step.5.4 SEARCHING THROUGH THE SOURCE WINDOW<strong>CrossView</strong> <strong>Pro</strong> can search for addresses and functions in the entireapplication and for line numbers, and strings in the current source file. Astring search starts from the current viewing position and "wraps around"the end (or begin) of the current source file. The string search ends whena matching string is found or when it returns to the starting point.PROGRAM EXECUTION5.4.1 SEARCHING FOR A FUNCTIONThere are several ways to find a function:Using the mouse:• From the Edit menu, select Find Symbol... to open the FindSymbol dialog box. Select the function you are looking for.• Click on the Find Symbol button in the Source Window to openthe Find Symbol dialog box.• Select a function in the Stack Window (double−click) to show theline that called it.From the Command Window, you can either specify e followed by thefunction name, or a stack position followed by e. For example:e main Find the function main( ).1 e Find the line that called the current function.<strong>CrossView</strong> <strong>Pro</strong> searches through all the relevant source code files to findthe one containing the body of the function. The part of the file containingthe function appears in the Source Window.
Controlling <strong>Pro</strong>gram Execution5−155.4.2 SEARCHING FOR A STRING<strong>CrossView</strong> <strong>Pro</strong> allows you to search for a particular string in the currentsource file. <strong>CrossView</strong> <strong>Pro</strong> searches the Source Window from the currentviewing position. If it finds the string, it moves the viewing position to thecorresponding line. This does not affect the execution position.To find a string:Open the Search String dialog box by clicking on the Find Text Stringbutton, or select Search String... from the Edit menu. Click on the CaseSensitive check box to turn case sensitivity on or off.You can also highlight a text fragment in the source code and click on theFind Next Text String button to find that fragment again.In the Command Window, use the / or ? commands. The / commandsearches forwards and the ? command searches backwards. For example,to find the string initval, enter:/initvalSearch forward for the string "initval"<strong>CrossView</strong> <strong>Pro</strong>’s searches "wrap around" beyond the top or bottom of thefile if necessary.FUNCTION:COMMAND:Search forward for a string./ stringFUNCTION:COMMAND:Search backward for a string.? stringIf no string is supplied to the / or ? command, or if you hit carriage return,or press the function key F3 or select the Search Next String from theEdit menu item, <strong>CrossView</strong> <strong>Pro</strong> searches again for the last stringrequested.• • • • • • • •
PROGRAM EXECUTION5−16Chapter 55.4.3 JUMPING TO A SOURCE LINEAs mentioned earlier in the Changing the Viewing Position section, youcan use the scroll bar to scroll through the source code or use the arrowkeys or the + and − keys. To find a specific line, you can use one ofseveral methods:From the Edit menu, select Find Line... to open the Find Line dialog box.After you enter a line number (or select one from the history list) in thisdialog box and click on the Find button, <strong>CrossView</strong> <strong>Pro</strong> will change theviewing position to the indicated line number. At the first use, the FindLine dialog box contains no line number, but on subsequent invocations itwill show the line number you entered before.Enter the line number on the command line.
CHAPTERACCESSING CODEAND DATA6
6−2Chapter 6CODE AND DATACHAPTER6
Accessing Code and Data6−36.1 INTRODUCTIONThis chapter discusses topics related to viewing and editing the variablesin your source program and execution environment, including accessingvariables and registers, viewing and modifying the data space, usingmonitors, viewing the source file, and disassembling code.6.2 ACCESSING VARIABLESThis section describes how to view and edit your program variables usingthe debugger. You can monitor data so that every time you stop theprogram, <strong>CrossView</strong> <strong>Pro</strong> updates the current value.The Data Window displays the values of variables and expressions. Aslong as the this window is open, <strong>CrossView</strong> <strong>Pro</strong> automatically updates thedisplay for each monitored variable and expression each time the programstops.Uninitialized variables will not have meaningful values when you first startthe debugger, since your program’s startup code has not been executed.Also note that global data is initialized at load time. Re−running a programmay produce unexpected results. To guarantee that global data isinitialized properly, download the program again.6.2.1 VIEWING VARIABLES, STRUCTURES ANDARRAYSYou may view variable values, and change them, from the Source Windowand the Command Window. <strong>CrossView</strong> <strong>Pro</strong> returns the variable in theformat var_name = value in the Command Window.It is possible to display both monitored and unmonitored expressions inthe Data Window. After every halt in execution, <strong>CrossView</strong> <strong>Pro</strong> updatesmonitored expressions. Unmonitored expressions are just one−shotinspections of the expressions value. Refer to section 4.6, <strong>CrossView</strong> <strong>Pro</strong>Windows for a detailed description of the Data Window.To set the default display format of the data shown, select the properformat in the Data | Data Display Setup... dialog.• • • • • • • •
6−4Chapter 6To show the contents of a variable or to show the type information ofa function:Position the mouse cursor over a variable or a function in the SourceWindow. A bubble help box appears showing the value of the variable orthe type information of the function, respectively.To evaluate a simple expression:Double−click on a variable in the Source window. The result of theexpression is shown in the Data Window. Alternatively, depending on thepreferences you set in the Data Display Setup dialog, the expressionappears in the Evaluate Expression dialog. Click the Add Watch orAdd Show button to display the result of the expression in the DataWindow. Click the Evaluate button to display the result of the expressionin the output field of the Evaluate Expression dialog.To evaluate a complex expression:From the Data menu, select Evaluate Expression... and type in any Cexpression in the Evaluate Expression dialog box. Optionally select adisplay format. Click the Evaluate button.Type the expression into the command edit field of the CommandWindow followed by a return or click the Execute button.For example, to find the value of initval in demo.c type:CODE AND DATAinitvaland <strong>CrossView</strong> <strong>Pro</strong> will display:initval = 17FUNCTION:COMMAND:Display the value of a variable.variable’s_nameFor variables having the same name as an <strong>CrossView</strong> <strong>Pro</strong> command, use/n as format style code.
Accessing Code and Data6−5Any expression that can be typed into the Command Window can also betyped in the Expression field of the Expression Evaluation dialog box.Throughout this discussion, expressions can be typed in either location,depending on what is convenient.Viewing StructuresYou can also view structures.By using any of the methods described above, you can print out the entirestructure. For example:recordvarand <strong>CrossView</strong> <strong>Pro</strong> prints out the structure of recordvar and values ofrecordvar’s fields in correct C notation:recordvar = struct rec_s {a = −1;b = 0x1028 "TASKING";c = 987654321;color = blue;} recordvarDisplaying Individual FieldsSimilarly, you can instruct the debugger to print the value of an individualfield.In the Source Window, highlight recordvar.color and click the ShowExpression button. Or, in the Expression edit field of the ExpressionEvaluation dialog box or in the Command Window, type the structurename followed by a period and the field name. For instance, to see thefield color for the structure recordvar, enter:recordvar.colorCommandcolor = blue OutputNote that <strong>CrossView</strong> <strong>Pro</strong> returns the value in the form field_name = value.<strong>CrossView</strong> <strong>Pro</strong> also displays enumerated types correctly.Variables will not have meaningful values when you first start <strong>CrossView</strong><strong>Pro</strong>, since your program’s startup code has not been executed.• • • • • • • •
6−6Chapter 6Displaying the Address of an ArrayIf you enter the name of an array in the Expression Evaluation dialog boxor in the Command Window, the debugger returns its address. Forinstance, to find the address for the array table, select table from thebrowse list in the dialog box or type the name in the Command Window:tabletable = 0x200CommandOutputNote that <strong>CrossView</strong> <strong>Pro</strong> returns the address in the form array_name =address.The debugger can also display the address and value of an individualelement of an array. Enter the name of the array and the number of theelement in brackets. For instance, to find the address and value of thethird element of array table, enter:table[3]0x20C = 0CommandOutputNote that <strong>CrossView</strong> <strong>Pro</strong> returns the information in the form address =value.Displaying Character Pointers and Character ArraysThe following piece of C code can be accessed in <strong>CrossView</strong> <strong>Pro</strong> using thestring format codes:CODE AND DATAchar text[] = "Sample\n";char *ptext = text;texttext = 0x8200text/atext = "Sample^J"ptextstring = 0x8200ptext/sstring = "Sample^J"&ptext0x8210What is the address of this char arrayPrint it as a stringWhat is the contents of this pointerPrint it as a stringWhere does ptext itself reside
Accessing Code and Data6−7Sizing StructuresWith structured variables, it is especially useful to know the size of avariable.In the Command Window, you can determine the size of a variable withthe sizeof() function. For instance, to determine the size of the structurerecordvar, enter:sizeof(recordvar)246.2.2 CHANGING VARIABLESWith <strong>CrossView</strong> <strong>Pro</strong>, you can not only view your variables, but changethem. This function allows you to easily test your code by single−steppingthrough the program and assigning sample values to your variables. Forinstance, to set the variable initval to 100, enter:initval=100and <strong>CrossView</strong> <strong>Pro</strong> confirms initval’s new value:initval = 100Note that <strong>CrossView</strong> <strong>Pro</strong> returns the values of variables with the syntax:var_name = value, with any right−hand side expression evaluated to asingle value.Changing variables in the Data WindowTo change a variable in the Data Window, follow these steps:• In the Data Window, double−click on the variable you wish to edit.In−situ editing will be activated.• Specify the new value in the edit control and hit the Enter key.When in−situ editing is active, you can use the Tab key to move the editfield to the next variable value or use the Shift+Tab key combination tomove the edit control to the previous variable.• • • • • • • •
6−8Chapter 6Assigning Structures<strong>CrossView</strong> <strong>Pro</strong> also allows you to assign whole structures to one another.You can use a simple equation to assign the structures. For instance, toassign statrec to recordvar, enter:statrec = recordvarAssigning PointersAssigning to and evaluation of pointers requires some extra attention.When requesting a pointer variable, its near, far or huge attribute istaken into account and the variable is evaluated accordingly. For example,bits 14−15 in a near pointer indicate which DPP register contains the datapage value:pn/tglobal short near *pnpnpn = 0x4106pn/1x2pn = 0x106$dpp0$DPP0 = 0x1CODE AND DATA$dpp0=10$DPP0 = 0xApnpn = 0x28106As you can see, using a display format allows you to see how the pointeris actually stored in memory. When the value of the indexed DPP ischanged to 10, pointer pn evaluates to to an address in data page 10.
Accessing Code and Data6−9When assigning to pointers, you do not have to bother with the memorystorage representation. You can specify the address the pointer shouldevaluate to when assigning a new value:pf/tglobal short far *pfpf=0x123456pf = 0x123456pf/2x2pf = 0x3456 0x0048When assigning to a near pointer, <strong>CrossView</strong> <strong>Pro</strong> checks if the givenaddress is in one of the pages indicated by the DPP registers and storesthe index of the matching DPP in bits 14−15 of the pointer. If a page isdesignated by more than one DPP, the lowest DPP index is used. If theaddress is in none of the indicated pages, <strong>CrossView</strong> <strong>Pro</strong> issues an errormessage.In addition to the standard set of basic types, <strong>CrossView</strong> <strong>Pro</strong> supports thetype bit. All variables declared bit or sfrbit in your program have thistype. When you request the address of such a variable both the addressand the bit offset are shown. For example:bvar/tglobal bit bvarbvarbvar = 1&bvar0xFD4E.0To show the address as it is stored in memory, use the display formatoption:&bvar/1x20x270• • • • • • • •
6−10Chapter 66.2.3 THE l COMMAND<strong>CrossView</strong> <strong>Pro</strong>’s windows contain a great deal of information about thecurrent debugging session. Occasionally, however, you have a few closedwindows, or wish the information to appear in the Command window (forinstance, when you are recording output). Using the l (list) command, youcan find out all sorts of things about the current state of the debugger andhave the information appear in the Command window.Arguments of the l Commanda assertions k kernel state datab breakpoints m memory map (of application code sections)d directory p procedures (functions)f files (modules) r registersg globals s special variablesFor configurations that support real−time kernels the l k command canhave additional arguments. See the description of the l command in theCommand Reference for details.You may for example view the contents of the registers:l rOr the list of procedures (that is, functions):CODE AND DATAl pa complete list of global variables:l gThe l f command (list files) also shows the address where <strong>CrossView</strong> <strong>Pro</strong>placed the first procedure in the module. If the module is a data modulethen the address reflects the first item’s placement.With all of these l commands you can specify a string:l g recordand <strong>CrossView</strong> <strong>Pro</strong> searches the globals for a match with the same initialcharacters; in this case global variables that begin with record.
Accessing Code and Data6−116.3 EXPRESSIONS6.3.1 EVALUATING EXPRESSIONS<strong>CrossView</strong> <strong>Pro</strong> expressions use standard C syntax, semantics, and allowspecial variables. You can calculate and show the values of expressions in<strong>CrossView</strong> <strong>Pro</strong> by using a variety of methods:It is possible to display both monitored and unmonitored expressions inthe Data Window. <strong>CrossView</strong> <strong>Pro</strong> updates monitored expressions afterevery halt in execution. Unmonitored expressions are just one−shotinspections of the expressions value. Refer to section 4.6, <strong>CrossView</strong> <strong>Pro</strong>Windows for a detailed description of the Data Window.To evaluate a simple expression:Double−click on a variable in the Source window. The result of theexpression appears in the data window. Alternatively, depending on thepreferences you set in the Data Display Setup dialog, the expressionappears in the Evaluate Expression dialog. Click the Add Watch orAdd Show button to display the result of the expression in the DataWindow. Click the Evaluate button to display the result of the expressionin the output field of the Evaluate Expression dialog.To evaluate a complex expression:From the Data menu, select Evaluate Expression... and type in any Cexpression in the Evaluate Expression dialog box. Optionally select adisplay format. Click the Evaluate button.<strong>CrossView</strong> <strong>Pro</strong> calculates the result and displays the value in theappropriate format. For details about expression formats see the sectionFormatting Expressions in the chapter <strong>CrossView</strong> <strong>Pro</strong> Command Language.Type the expression in the Command Window.Expressions can contain variable names as arguments. For instance, if thevariable initval has a value of 17 and you enter:initval * 2<strong>CrossView</strong> <strong>Pro</strong> displays:34• • • • • • • •
6−12Chapter 6The expression can contain names of variables, constants, function callswith parameters, and so forth; anything that you can write directly at theCommand Window, you can use in the Evaluate Expression dialog box.For more information on expressions and the <strong>CrossView</strong> <strong>Pro</strong> commandlanguage, refer to the section <strong>CrossView</strong> <strong>Pro</strong> Expressions in the CommandLanguage chapter.The Dot OperandUsing the dot shorthand "." can save you some typing. The dot stands forthe last value <strong>CrossView</strong> <strong>Pro</strong> displayed. For instance:initvalinitval = 17Now you can use the value 17 in another expression by typing:. * 234The value is the result of the new expression.Naturally, using the dot operand saves you from retyping complexexpressions.6.3.2 MONITORING EXPRESSIONSCODE AND DATA<strong>CrossView</strong> <strong>Pro</strong> allows you to monitor any variable or expression.Monitoring means that the debugger evaluates a particular expression anddisplays the result each time the program stops. If you are in windowmode, <strong>CrossView</strong> <strong>Pro</strong> displays the values of the monitored variables andexpressions in the Data window.Monitor Set UpTo set up a monitor you can:From the Data menu, select Evaluate Expression... or double−click on avariable in the Source Window, or click on the Watch Expression buttonto view the Expression Evaluation dialog box. From this dialog box, youcan enter an expression and monitor (watch) its value in the DataWindow. You can skip the Expression Evaluation dialog if you activate theBypass Expression Evaluation dialog check box in the Data DisplaySetup dialog.
Accessing Code and Data6−13Alternatively, click on the New Expression button in the Data Window.The Data Window must be open to display the result. Otherwise<strong>CrossView</strong> <strong>Pro</strong> does not monitor the expression. Therefore, <strong>CrossView</strong> <strong>Pro</strong>opens the Data Window automatically when you choose to show or watchan expression.Type the m expression command in the Command Window.To place the variable initval in the Data window type:m initvalinitval remains in the Data window. You may run the program, stepthrough it, and the display updates continually. Even if you are not inwindow mode, <strong>CrossView</strong> <strong>Pro</strong> still displays the value of initval afterevery <strong>CrossView</strong> command.FUNCTION:COMMAND:Monitor an expression or variable.m expressionSimilarly, if you want twice the value of initval you could type:m initval*2And the expression initval*2 is monitored.Monitored expressions are evaluated exactly as if you had typed them infrom the command line; therefore, if you are monitoring a variable, say R,identical to an <strong>CrossView</strong> <strong>Pro</strong> command, use the /n format, in thisexample R/n.Monitor DeleteTo remove a monitored expression you can:Select the item in the Data Window and click on the Delete Selected DataItem button from the Data Window, or select Data | Delete | Item.To remove all expressions from the Data Window, select Data | Delete |All.Type the number m d command in the Command Window.• • • • • • • •
6−14Chapter 6To remove initval from your Data Window #1, type the number of theexpression (first item of the Data Window has number 0) and m d(monitor delete):0 m dand <strong>CrossView</strong> <strong>Pro</strong> removes initval (in this case, assuming it is the firstvariable listed in the window) from the Data Window.FUNCTION:COMMAND:Remove an expression from the Data Windownumber m dSince local variables have no meaning beyond their range, <strong>CrossView</strong> <strong>Pro</strong>issues error messages if you try to evaluate local variables beyond theirscope. Some variables also become invisible when the program callanother function. For instance, if you are in main(), monitoring sum, andmain() calls factorial(), the unqualified name sum is no longervisible inside factorial(). You can get around this problem, however,by monitoring main#sum instead.6.3.3 FORMATTING DATACODE AND DATAWhen you display a particular variable, <strong>CrossView</strong> <strong>Pro</strong> displays it in theformat the symbolic debug information defines for it. You may, however,easily specify another format using dialogues or keyboard commands. Seethe section Formatting Expressions in the chapter <strong>CrossView</strong> <strong>Pro</strong>Command Language.ExamplesTo print the value of initval in hexadecimal format, enterinitval/xBe sure not to confuse <strong>CrossView</strong> <strong>Pro</strong> format codes with C charactercodes. <strong>CrossView</strong> <strong>Pro</strong> uses a / (forward slash) not a \ (backward slash).
Accessing Code and Data6−15Don’t worry about trying to memorize the list, you probably won’t haveoccasion to use all these formats. Notice, however, that the /t format codegive information about a particular value. For instance, if you wanted tofind out what the type of initval is, type:initval/tglobal long initvalPlease note that the displayed type may not seem to be the same type asyou declared in your source file:• The c166 compiler supports keywords bitword, sfr and sfrbit.These keywords indicate special cases of the basic typesunsigned int and bit respectively. For the debugger, thesespecial cases are not distinct. When requesting the type of variabledeclared with one of the above keywords, <strong>CrossView</strong> <strong>Pro</strong> will showthe basic type.• The near, far and huge keywords are essential attributes topointers. The chosen memory model designates the default pointerattribute. When the type of a pointer variable is requested in<strong>CrossView</strong> <strong>Pro</strong>, the attribute is shown explicitly, because <strong>CrossView</strong><strong>Pro</strong> does not know about memory models.You can also take more low−level actions, such as finding out whichfunction contains the hexadecimal address 0x100.0x100/Pmain<strong>CrossView</strong> <strong>Pro</strong> tells you that address 0x100 is in the function main().6.3.4 DISPLAYING MEMORY<strong>CrossView</strong> <strong>Pro</strong> supports several methods to display memory contents. TheMemory Window provides a very user−friendly yet powerful way todisplay the raw contents of the target memory.Refer to section 4.6.4 for a description of the Memory Window.Format codes also give you control over the number and size of multiplepieces of data to display beginning at a particular address. The debuggeraccepts format codes in the following form:[count] style [size]• • • • • • • •
6−16Chapter 6Count is the number of times to apply the format style style. Size indicatesthe number of bytes to be formatted. Both count and size must benumbers, although you may use c (char), s (short), i (int), and l (long) asshorthand for size. Legal integer format sizes are 1, 2, and 4; legal floatformat sizes are 4 and 8.For instance:initval/4xsdisplays four, hexadecimal two−byte memory locations starting at theaddress of initval.With format codes, you may view the contents of memory addresses onthe screen. For instance, to dump the contents of an absolute memoryaddress range, you must think of the address being a pointer. To show thememory contents you use the C language indirection operator ’*’. Example:*0x4000/2x40x4000 = 0x00DB0208 0x5A055498This command displays in hexadecimal two long words at memorylocation 0x4000 and beyond. Instead of using the size specifier in thedisplay format, you can force the address to be a pointer to unsignedlong by casting the value:*(unsigned long *)0x4000/2x0x4000 = 0x00DB0208 0x5A055498CODE AND DATATo view the first four elements of the array table from the demo.cprogram, type:table/4d2table = 1 1 2 6This command displays in decimal the first four 2−byte values beginning atthe address of the array table.By typing the a space followed by a carriage return you can advance andsee the succeeding values in the same format:[Enter]0x11 = 24 120 720 5040You may recognize that the array table contains the factorials for theintegers 0 through 7.
Accessing Code and Data6−17Displaying memory in this way is particularly effective when you havetwo−dimensional arrays. In this case you can display each row byspecifying the appropriate count. For instance, if myarr is defined as intmyarr[5][8]:myarr/8dsdisplays the values for the eight elements in the first row of myarr. Typingthe carriage return repeatedly then display subsequent rows in the sameformat.To scroll back in memory, type the ^ (caret) sign:^0x9 = 1 1 2 6FUNCTION:COMMAND:Display value(s) at previous memory location.^6.3.5 DISPLAYING MEMORY ADDRESSESThe f command lets you specify in which notation <strong>CrossView</strong> <strong>Pro</strong> displaysmemory addresses. It takes the same arguments as the printf() functionin C.FUNCTION:COMMAND:Specify memory address notation.f ["printf−style−format"]For instance, if you wish to display all memory addresses in octal, type:f "%o"Now all addresses appear in octal. To return to the default hexadecimal,type:f "%x"Using the f command without an argument also returns to hexadecimaladdress display.• • • • • • • •
6−18Chapter 66.4 DISPLAYING DISASSEMBLED INSTRUCTIONSTo show disassembled instructions:From the View menu, select Source | Disassembly to open theDisassembly Source Window.Use the /i format switch to display disassembled code in the CommandWindow.By using an address and the /i format it is possible to displaydisassembled code at any point. Suppose you wish to see how thefactorial() function has been compiled. One method would be toexamine the instructions displayed as you single step through a program atthe assembly language level. There is however a quicker method that doesnot require you to execute the instructions. Type:factorial/10iThis command displays the first ten assembly language instructions offactorial(). Remember that in C a function’s name is also its address.Thus factorial is the address of the function factorial().Note that <strong>CrossView</strong> <strong>Pro</strong> keeps track of variable and function names foryou in the disassembled code. You can also disassemble from the currentexecution position by using the program counter:CODE AND DATA$pc/5iThis command disassembles five assembly language instructions from thecurrent execution line.You can display disassembled code for any function:main#56/7idisassembles seven instructions from line 56.See also the ei command for displaying disassembly in a window.Labels in DisassemblyTo show labels in disassembly:From the Settings menu, select the Source Window Setup... to open theSource Window Setup dialog box and enable the Symbolic disassemblycheck box.
Accessing Code and Data6−19Turn the $symbols special variable "ON" by typing the followingcommand in the Command Window:opt symbols=on6.4.1 INTERMIXED SOURCE AND DISASSEMBLYTo show intermixed source and disassembly:From the View menu, select Source | Source and Disassembly to openthe Source and Disassembly Window.Use the /I format switch to display intermixed C and disassembled codein the Command Window.The /I format works exactly as the /i format, except <strong>CrossView</strong> <strong>Pro</strong>intermixes the pseudo−assembly listing with the original C source. Thisfeature is often helpful in displaying long portions of code.Auto Switch between Source and DisassemblyTo automatically switch between source and disassembly windowdepending on the presence of symbols:From the Settings menu, select the Source Window Setup... to open theSource Window Setup dialog box.Enable the Show assembly when SDI is missing check box.Turn the $autosrc special variable "ON" by typing the followingcommand in the Command Window:opt autosrc=on• • • • • • • •
6−20Chapter 66.5 THE STACKDuring debugging, you frequently find yourself lost or unable to pinpointyour location through a series of function calls. The system stack helpsyou with the problem by recording the return addresses of all functionsyou have passed through. <strong>CrossView</strong> <strong>Pro</strong> can use this information toreconstruct the path to your current location.The following diagram shows the structure of the stack.double precisionreturn valueconventionalparameterspushed registerparameterspushed registerautomaticsframesizeconventionalautomaticsstacksizeCODE AND DATAtemporarystorageFigure 6−1: Stack frame layoutR0stack pointeradjust6.5.1 HOW THE STACK IS ORGANIZEDc166 maintains two types of stack: the system stack and the user stack.
Accessing Code and Data6−21The system stack is used for return addresses (CALL/RET instructions) andcan be accessed via PUSH/POP instructions (using the SP register).Because the system stack can be very small (internal memory for the<strong>C166</strong>/<strong>ST10</strong>), c166 tries to avoid it as much as possible. Code generatortemporaries are pushed on the user stack. Via the −Ou option it is evenpossible to let a task switch (interrupt) use the user stack instead of thesystem stack. You must specify the size of the system stack size in thesystem startup code (SYSCON register), which is the system stack size forall tasks (the whole application). For the behavior of the <strong>C166</strong>S v2.0 andSuper10 architectures please refer to their respective user’s manuals.The user stack is the so called ’C−stack’. c166 uses R0 as ’User StackPointer’ and the [−R0]/[R0+] addressing modes perform push/popsequences. If data paging is used (medium and large memory model), theuser stack is limited to 16K (one page). In these models, c166 uses DPP1as ’user−stack page number’. The locator combines the user stack areas ofeach task to one global user stack area (with cumulated size). A contextswitch inherits the user stack pointer (R0) value in the new registerbankand DPP1 remains unchanged.6.5.2 THE STACK WINDOWThe Stack Window shows the current contents of the stack after theprogram has been stopped. This window helps you assess programexecution and allows you to view program values. You can also setbreakpoints for different stack levels from this window, as described in thechapter Breakpoints and Assertions.The Stack Window displays the following information for each stack level:• The name of the function that was called• All parameters specified to the function• The line number in the source code from which the function wascalledEach stack level shown in the Stack Window is displayed with its levelnumber first. The levels are numbered sequentially from zero. That is, thelowest/last pushed level in the function call graph is always assigned zero.• • • • • • • •
6−22Chapter 6When you first see stack information, the lowest level appears against adarker background than the other lines in the window. The marked line inthe Stack Window is the selected stack level, meaning that this line isselected for window operations. You can change the selected stack levelby clicking on a different line.Checking the Stack from the Command WindowThe stack information is also accessible from the Command Window withthe t and T commands. The t command reconstructs the program’s callingpath. For instance, if you stepped into the function factorial() andissue a t (trace) command:t<strong>CrossView</strong> <strong>Pro</strong> displays:0 factorial(num=0) [demo.c:105]1 main() [demo.c:59]The numbers to the left indicate the depth of each function on the stack.The function at the zero stack level is your current function. <strong>CrossView</strong><strong>Pro</strong> tells you the line number where the function was called([demo.c:line_nr]) and the value of the argument passed(num=value). With this information it is fairly easy to reconstruct yourcalling path, and see what parameter values your functions have received.CODE AND DATAFUNCTION:COMMAND:Trace stack to reconstruct program’s calling path.tThere is a slight variation on the t command called the T command. Thetwo are identical, except that the T command also displays the localvariables for each function. For instance:T0 factorial(num=0) [demo.c:105]locvar = ’x’1 main() [demo.c:59]loopvar = 0sum = 0cvar = ’\xff’
Accessing Code and Data6−23FUNCTION:COMMAND:Trace stack and display local variables.T6.5.3 LISTING LOCALS AND PARAMETERS OF AFUNCTIONAs mentioned in the previous section, <strong>CrossView</strong> <strong>Pro</strong> displays allparameters of a function. You can view the local variables and parametersof any single function active on the stack To do this:Follow these steps:• Open up the Expression Evaluation dialog box by clicking on theNew Expression button from the toolbar or selecting EvaluateExpression... from the Data menu.• Click on the Browse... button.In the Command Window, use the l (lowercase L) command.For example, assuming you are still in factorial(), issue an lcommand:l factorialnum = 0locvar = ’x’You can accomplish the same task by specifying the stack depth instead ofa function name:l 06.5.4 LOW−LEVEL VIEWING THE STACKYou can directly view the contents of the user stack. Although <strong>CrossView</strong><strong>Pro</strong> provides several high level methods of tracing functions on the userstack, you can view its contents directly with the frame pointer specialvariable, $fp (which equals R0). For instance, the command:$fp[0]/4x1• • • • • • • •
CODE AND DATA6−24Chapter 6displays the four one−byte values in hexadecimal to which the framepointer points. Notice that the stack frame is not really an array, but bypretending it is, you can display the memory much as you did with thetable array. Refer to the Accessing Variables section in this chapter formore information.
Accessing Code and Data6−256.6 TRACE WINDOWC level trace is not available for all execution environments. Please checkthe Addendum for details.The Trace Window displays the most recently executed lines of code eachtime program execution stops. <strong>CrossView</strong> <strong>Pro</strong> automatically updates theTrace Window each time execution halts, as long as the window is open.For each executed line of code, the Trace Window displays:• The name of the source file• The name of the function• The line number and corresponding source code• The window shows all the code executed since the the last time theprogram halted.6.6.1 TRACE WINDOW SETUPThe Trace Window’s only function is to display the contents of theemulator’s/ simulator’s trace buffer. The only operation you can perform inthis window that directly affects the contents is to set the maximumnumber of instructions in the display.To set the displaying limit, select Trace Setup... from the Settings menu.You can change the maximum number of C−Trace machine instructions tofetch from the execution environment’s trace buffer and the maximumnumber of trace output lines in the Trace Window.To view the most recently executed source statements from the CommandWindow, use the ct command preceded by the number of machineinstructions you want to list. For example, to view the last source linescorresponding to the last ten machine instructions, enter:10 ctFUNCTION:COMMAND:Display in the Command window the most recentlyexecuted C statements.number ct• • • • • • • •
6−26Chapter 6To activate the source level trace window:From the View menu, select Trace | Source Level to view the TraceSource Window.You can view the last machine instructions executed with the ct icommand. For example:15 ct idisplays the last 15 machine instructions in disassembled form in theCommand Window.FUNCTION:COMMAND:Display the most recently executed machineinstructions.number ct iTo activate the instruction level trace window:From the View menu, select Trace | Instruction Level to view the TraceInstructions Window.You can view a raw trace with the ct r command. For example:CODE AND DATA20 ct rdisplays the last 20 trace frames in the Command Window.FUNCTION: Display a raw trace.COMMAND: number ct rTo activate the raw trace window:From the View menu, select Trace | Raw to view the Trace Raw Window.
Accessing Code and Data6−276.7 REGISTER WINDOWThe Registers Window shows you the values of internal registers on yourtarget processor.You can create multiple Register Windows and each Registers Windowcontains the names and contents of all currently selected registers in theselected register set definition. Values are displayed in hexadecimal format.As long as the window is open, the debugger automatically updates thevalues when the program stops.To show the list of current registers and their contents in the CommandWindow, enter the list registers command (l r).<strong>CrossView</strong> <strong>Pro</strong> also supplies the following special variables:$sp$pc$fpstack pointerprogram countercurrent frame pointerfor all targets. For more information, refer to the Command Languagechapter.6.7.1 REGISTER WINDOW SETUPYou can configure which register set definition with which (and in whichorder) registers must be displayed in the Register Window; using theSettings | Register Window Setup... dialog. Since you can have morethan one Register Window, the last active Register Window will beconfigured when you select this menu item.• • • • • • • •
6−28Chapter 6Figure 6−2: Register Window Setup DialogCODE AND DATATo configure a Register Window follow these steps:• Select a Register Window.• From the Settings menu, select Register Window Setup... to viewthe Register Window Setup dialog box.The dialog will show the active register set definition and the list ofavailable and selected registers for this particular register setdefinition.
Accessing Code and Data6−29• You can create a new register set definition by entering an uniqueregister set definition name in the Name edit field and using theAdd button.• You can delete a register set definition by selecting an item from thedefined register set definition list and using the Delete button. Notethat when you delete a register set definition, any Register Windowdisplaying a deleted register set will be closed.• You can select a register set definition by selecting an item from thedefined register set definition list. The list of available and selectedregisters will be updated according to the configuration of theselected regisetr set definition.Once you have selected a register set definition, follow these steps toconfigure this register set definition:• You can add registers to the list of selected registers by selectingregisters from the list of available registers by highlighting thoseregisters in the left list box and using the Add−> or Add All buttonor by double−clicking on the register you want to add.• You can remove registers from the list of selected registers byhighlighting those registers in the right list box and using theRemove
CODE AND DATA6−30Chapter 6When in−situ editing is active, you can use the Tab key to move the editfield to the next register value or use the Shift+Tab key combination tomove the edit control to the previous register. Use the Esc key to cancelin−situ editing. When a register is not in view the contents of the RegisterWindow will be updated automatically.You can enter any expression in the Registers Window.Registers which can be edited symbolically have a special marker justbefore the register name. You can click on this marker to activate theAssign Register Symbolically dialog.To access registers from the Command Window, use the $ designation andthe register name in the format:$register = value
CHAPTERBREAKPOINTS ANDASSERTIONS7
7−2Chapter 7BREAKPOINTS AND ASSERTIONSCHAPTER7
Breakpoints and Assertions7−3You can use breakpoints to stop program execution at specified locationsand return control to the user. An assertion is a number of statementsexecuted by the debugger each time the target executes a program line.Use assertions to track down bugs, the cause of which is very hard to find.7.1 INTRODUCTION TO BREAKPOINTSBreakpoints halt program execution and return control to you. There areseveral types of breakpoints: code, data, instruction count, cycle count,timer and sequence. A code breakpoint halts the program on a particularstatement or instruction; a data breakpoint stops the program when aparticular memory address (or range of addresses) is accessed; aninstruction count breakpoint halts the program after a specified number ofinstructions have been executed; a cycle count breakpoint stops theprogram after a number of CPU cycles; a timer breakpoint stops theprogram after a number of micro seconds or ticks and sequencebreakpoints stop the program when a number of breakpoints are hit in aspecified sequence.Data breakpoints, instruction count breakpoints, cycle count breakpointsand timer breakpoints are not available for all execution environments,please check the addendum.7.1.1 CODE BREAKPOINTSA code breakpoint is set on a line in the code and makes the programhalt exactly before that line executes. When you define a code breakpoint,you can include four elements:• A count, which is the number of times the breakpoint must beencountered before it stops the program (default is 1).• A reset count, which is the value assigned to the count after theprogram has stopped on a breakpoint (default is 1).• A name, which is the symbolic name you can associate with abreakpoint.• A list of commands, which will be executed when the program hitsthe breakpoint.• • • • • • • •
7−4Chapter 7Color Marking of BreakpointsIn the Source Window, a green colored toggle shows that no breakpoint isset. A red colored toggle shows that a breakpoint is installed. An orangecolored toggle indicates an installed but disabled breakpoint.If coverage is enabled, coverage markers are present to the right of thebreakpoint toggles. An executed line is marked and not executed lines arenot marked.BREAKPOINTS AND ASSERTIONSBreakpointTogglesCoverageMarkers<strong>Pro</strong>filingFigure 7−1: Code BreakpointCurrentExecution PositionStatusBarPermanent/Temporary Code BreakpointsCode breakpoints can be: permanent or temporary. A permanentbreakpoint exists until explicitly deleted. A temporary breakpoint onlyexists until it stops the program once.<strong>Pro</strong>be PointsA breakpoint can be treated as a probe point. When a probe point is hit,the associated commands are executed and program execution iscontinued. <strong>Pro</strong>be points are used with File I/O simulation and sequencebreakpoints.
Breakpoints and Assertions7−5How <strong>CrossView</strong> <strong>Pro</strong> Sets Code Breakpoints<strong>CrossView</strong> <strong>Pro</strong> depends on the symbol table for information about howmachine instructions map to lines of source. In general, the C compilerissues line symbols at the start of each statement or line, whichever comesfirst. This can lead to some surprising results. If you look carefully, youcan tell on which line <strong>CrossView</strong> <strong>Pro</strong> set the breakpoint, since <strong>CrossView</strong><strong>Pro</strong> tells you on which line the program stopped, a line that may bedifferent from the one you expected. To find out what happens if youinstall a code breakpoint, use single stepping and watch the order inwhich the source lines print out.Multiple Statements on a Single Source LineIf you frequently include multiple statements on a single line in yoursource code, you may have difficulties setting code breakpoints at certainlocations. For instance, suppose you have a source line containing:a = 0; b = 1Suppose you want to halt execution after the assignment to a and beforethe one to b. A normal code breakpoint does not work here, becauseexecution stops at the first instruction of the source line. <strong>CrossView</strong> <strong>Pro</strong>provides you with the capability of disassembling the code and insertingbreakpoints at the machine level. You can use the Assembly SourceWindow or the Intermixed Source Window to spot the right location.For more information on machine level breakpoints, see below.Setting Breakpoints for Multi−line StatementsCode breakpoints have a special behavior for multiple−line statements,such as a multiple−line if. In an if clause, a line symbol is generated atthe beginning of the list of conditions, and the other lines of theconditions are generally associated with the first line of the clause. In anif−then−else construct, the } character before the else is associatedwith the branch−around to the end of the statement.Consider the following example:22: if ((a == b)&&23: (c == d)) {24: x = 2;25: } else {26: y = 3;27: }• • • • • • • •
7−6Chapter 7If you try to set a code breakpoint at line 23, <strong>CrossView</strong> <strong>Pro</strong> sets thebreakpoint on the preceding statement. If you try to set a breakpoint online 22, <strong>CrossView</strong> <strong>Pro</strong> highlights line 23. If you set a breakpoint on line25, it hits after the assignment to x, but before the jump to line 27. Noticethat it is not hit unless the if clause is true. In other words, a breakpointon line 25 is really a break on the }, not on the else {. The samebehavior applies when the else { statement is on the next source line.BREAKPOINTS AND ASSERTIONSBreakpoints and For Loops and While LoopsThe code generated for a C ’for’ statement has three parts: theinitialization; the body of the loop; and the increment, test, and branch.The initialization part and the increment, test, and branch are differentparts of code, but are both associated with the ’for’ statement itself. Forexample consider:99: for (i = 0; i < 9; i++) {100: myfunction(i);101: }A breakpoint placed on line 99 will only be hit once, because it is hit atthe initialization code. The code for the increment, test, and branch isassociated with line 101, not 99, as you might expect.The same applies to ’while’ loops.Breakpoints and Emulator ModeUpon entering emulator mode, the debugger removes any breakpoints itestablished in the target code. Removing breakpoints ensures that you canaccess unmodified target code. When emulator mode ends, <strong>CrossView</strong> <strong>Pro</strong>reestablishes breakpoints as necessary.As long as you avoid the debugger’s own breakpoint trap, you mayestablish arbitrary breakpoint conditions while in emulator mode. Thesewill not be removed by <strong>CrossView</strong> <strong>Pro</strong> and thus remain active, however,after you exit emulator mode. If one of these breakpoints is hit duringnormal debugging, <strong>CrossView</strong> <strong>Pro</strong> will issue a message such as:Stopped on breakpoint not set by debugger.
Breakpoints and Assertions7−7System Startup CodeIt is possible (for example, by using the si command) to debug systemlevel startup code that initializes the target environment. You should notuse any global variables in <strong>CrossView</strong> <strong>Pro</strong> expressions until the data areahas been initialized. <strong>CrossView</strong> <strong>Pro</strong> assertions and other <strong>CrossView</strong> <strong>Pro</strong>commands that examine C variables may deliver erroneous information orcause memory access errors if used before the C environment isestablished.7.1.2 DATA BREAKPOINTSA data breakpoint instructs the execution environment to watch aparticular data address or address range and halt execution if the programreads from or writes to that address. Data breakpoints are a powerfulfeature for tracking the use, and possible misuse, of pointers, globalvariables and memory mapped I/O ports.Data breakpoints are not available for all execution environments, pleasecheck the addendum.When setting a data breakpoint, you can specify whether the breakpointstops the program when data is read from, written to, or both.Data breakpoints are implemented in hardware. As a consequence, thenumber of allowable data breakpoints is limited by your executionenvironment. A simulator does not have these restrictions. Refer to theenvironment−specific addendum for more information.You may set a data breakpoint on a local variable, but only if the localvariable is active. <strong>CrossView</strong> <strong>Pro</strong> notifies you when program executionpasses beyond a local variable’s scope, and a breakpoint set on such avariable is deleted automatically. Data breakpoints for static variables donot have this restriction.Note that any local variables placed in registers cannot be tracked withdata breakpoints. In this case, you must use an assertion. Refer to theAssertions section later in this chapter for more information.• • • • • • • •
7−8Chapter 77.1.3 LISTING AND JUMPING TO BREAKPOINTSTo see a listing of all of the currently defined breakpoints:BREAKPOINTS AND ASSERTIONSFrom the Breakpoints menu, select Breakpoints... to view theBreakpoints dialog box.If you select a code breakpoint, you can click on the Goto button to jumpto the location in the source code where the selected code breakpoint isset.In the Command Window, enter the l b or B commands. The list appearsin the Command Window.For example entering the B command can result in:B0 ena CODE main (CODE:0x78) 2/2The breakpoint’s number (used when deleting breakpoints) is listed first,then if it is enabled or disabled, then its type: such as CODE for codebreakpoints and DATA for data breakpoints. Next, <strong>CrossView</strong> <strong>Pro</strong> lists thefunction and/or address, its count and reset count, and finally any attachedcommands enclosed by { and }.FUNCTION:COMMAND:View all breakpoints in the Command window.B<strong>CrossView</strong> <strong>Pro</strong> decrements the count each time the breakpoint is hit.When the breakpoint’s count reaches 0, <strong>CrossView</strong> <strong>Pro</strong> halts the program.7.2 SETTING BREAKPOINTSYou may set a code or data breakpoint by:• Using the mouse to open the Breakpoints dialog box.• Using the mouse in the Source Window.• Using the Stack Window.• Using the command line in the Command Window.
Breakpoints and Assertions7−9When you set a new breakpoint using the mouse, without using theBreakpoint dialog box, the type is always permanent, the count 1 and thelocation corresponds to the current viewing position, if the SourceWindow is open. These variables are described in more detail below.Setting Breakpoints from the MenuTo set a breakpoint from the menu, select Breakpoints... from theBreakpoints menu to view the Breakpoints dialog box. From this dialogbox, you can define several types of breakpoints.To set a code break point at line number # of the C source, click theAdd > button and select Code Breakpoint.... Click the Break At...button, choose a C module (for example demo.c) and click the OKbutton. Now you can enter a line number to set the breakpoint at.Click the Advanced button to get access to various types of breakpointsand to additional breakpoint options.Figure 7−2: Breakpoints dialog boxThe last entry of the list is always empty. Select it to start defining a newbreakpoint.Setting Breakpoints from the Source WindowYou can set or remove a code breakpoint directly from the SourceWindow by clicking on:• The breakpoint toggle next to the source lines in the SourceWindow.• • • • • • • •
7−10Chapter 7To set data breakpoints use the menu as described above.Setting Breakpoints from the Stack WindowSee the section Up−level Breakpoints later in this chapter.BREAKPOINTS AND ASSERTIONSSetting Breakpoints from the Command WindowYou can set a code breakpoint from the Command Window using thebreak code command or the b command, and set a data breakpoint usingthe break data command. Several options are available after thesecommands.See the break command in the Command Reference for detailedinformation.For example, the following command sets a code breakpoint at theaddress specified by function main:break code mainTo set a code breakpoint at a specific source line, you can enter abreakpoint address in the form: filename#line after the break command,or you can specify a line number, followed by the b command and anycommands you want to attach to the breakpoint. For example, to set acode breakpoint at line 51 in your source, enter:orbreak demo.c#5151 bIf you do not specify a line number, a breakpoint will be set at the currentviewing position.FUNCTION:COMMAND:FUNCTION:COMMAND:Set a code breakpoint.break [code] address [,option]...Set a code breakpoint.[line_number] b [commands]
Breakpoints and Assertions7−11To set a data breakpoint, you must specify the break data command,followed by an address, followed by any commands you want to attach tothe breakpoint. There are three types of data breakpoints:• A data read breakpoint to see if a variable is read from (break dataaddress, access_type=r command)• A data write breakpoint to watch if a variable is written to (breakdata address, access_type=w command)• A data read or write breakpoint to check if a variable is either readfrom or written to (break data address, access_type=rwcommand)For example, to set a data breakpoint to watch the lowest byte in memoryof the global variable initval, enter:break data &initval, access_type=wThis command instructs <strong>CrossView</strong> <strong>Pro</strong> to set a data breakpoint that willhalt execution if the program writes to the lowest byte in memory of thevariable initval. Note that you have to specify the variable’s address,otherwise the variable’s value is used.FUNCTION:COMMAND:Set a data breakpoint.break data address [,option]...7.2.1 DATA BREAKPOINTS OVER A RANGE OFADDRESSESYou can also use data breakpoints to watch a contiguous range of memoryaddresses. As with standard data breakpoints, data breakpoints over arange of addresses can be set to watch for reading, writing or both. To seta data breakpoint of this type:Using mouse and menu:• From the Breakpoints menu, select Breakpoints... to open theBreakpoints dialog box.• Select the data breakpoint you want to edit and click the Edit...button, or click the Add > button and select Data Breakpoint...• Specify a start address and click on the Advanced button.• • • • • • • •
7−12Chapter 7• Select one of the Type options: break on read, write, read or write.• Specify a length or an end address. The end address is part of therange (length is calculated from the end address and vice versa).From the Command Window:BREAKPOINTS AND ASSERTIONS• Type break data address, end_addr=end_address, access_type=rto set a data read breakpoint over a range.• Type break data address, end_addr=end_address, access_type=wto set a data write breakpoint over a range.• Type break data address, end_addr=end_address,access_type=rw to set a data breakpoint for both reading andwriting over a range.For example, to ensure that the program stops if any of recordvar’sfields are either written to or read from:break data &recordvar, end_addr=(int) \&recordvar+sizeof(recordvar)−1, access_type=rwFUNCTION:COMMAND:Set a data breakpoint over a range of addresses.break data address, end_addr=end_address [,option]...7.2.2 TEMPORARY BREAKPOINTSBreakpoints can be: permanent or temporary. A breakpoint exists until it ismanually deleted. A temporary breakpoint is automatically removed by<strong>CrossView</strong> <strong>Pro</strong> after it halts the program once.To set a temporary breakpoint:Follow these steps:• Open the Source Window by selecting Source | Source lines fromthe View menu.• Open the Breakpoints dialog by selecting Breakpoints... from theBreakpoints menu.• Click on the Add > button and select Code Breakpoint...• Enter an address in the Break At field and click on the Advancedbutton.
Breakpoints and Assertions7−13• Enable the Remove when hit check box in the Behavior field.• Click on the Continue button in the Source Window when theprogram halts. This removes the temporary breakpoint at theviewing position and the program continues.• Alternatively, scroll to the line that you want to stop at and clickonce (to establish a viewing position). From the Run menu, selectRun to Cursor to continue execution until you reach thistemporary breakpoint.From the Command Window:• Type break code address, temporary=true to set a temporarycode breakpoint.• Type the C command followed by a line number, to set a temporarybreakpoint at a line number.For example,C 51sets a temporary breakpoint at line 51 and resumes execution at thecurrent execution position.FUNCTION:COMMAND:Set a temporary code breakpoint.break code address, temporary=true [,option]...7.2.3 BREAKPOINT NAMESYou can associate a symbolic name with a breakpoint. You can then usethis name with the following commands: break set and break delete.Breakpoint names must be unique and cannot be a number or the word"all". Allowed characters are a−z, A−Z, 0−9 and ’_’.To assign a name to a breakpoint:Follow these steps:• From the Breakpoints menu, select Breakpoints... to open theBreakpoints dialog box.• Select a breakpoint to edit and click on the Edit... button.• • • • • • • •
7−14Chapter 7• Alternatively, click on the Add > button and select a breakpointtype to create.• Enter the breakpoint information in the first field, for example anaddress.• Enter a symbolic name in the Name field.Use the name=name option of the break command in the CommandWindow.BREAKPOINTS AND ASSERTIONSFor example,break code 0x1234, name=brk_1sets a code breakpoint at address 0x1234 with the name brk_1.7.2.4 SETTING THE COUNT<strong>CrossView</strong> <strong>Pro</strong> allows you to set a breakpoint’s count. The count defineshow many times you encounter the breakpoint before it halts the program.For example, a breakpoint with a count of 3 means the program stops onthe third hit. Each time the breakpoint is hit, <strong>CrossView</strong> <strong>Pro</strong> decrementsthe count. When the count reaches 0, <strong>CrossView</strong> <strong>Pro</strong> halts the program,and resets the count to the value of the reset count. The default resetcount is 1.To set a breakpoint’s count,Follow these steps:• From the Breakpoints menu, select Breakpoints... to open theBreakpoints dialog box.• When you add or edit a breakpoint, click on the Advanced button.• Enter a breakpoint’s count in the Breakpoint count field.• Enter a reset count in the Reset count field.From the Command Window,• Use the count= argument with the break command to set both thecurrent count and the reset count.• Use the curr_count= and/or reset_count= arguments with thebreak command to set the current count and the reset countseparately.
Breakpoints and Assertions7−15For example, suppose you have a breakpoint set at address 0x59 of yoursource code. The first time the program halts at address 0x59, enter:break code 0x59, curr_count=3, reset_count=4This command sets the breakpoint’s count to 3 and the reset count to 4.You can observe a breakpoint’s current count and reset count when youlist the breakpoints in the Command Window with the l b command.FUNCTION:COMMAND:Set the count and reset count for a breakpoint.break type address, count=countFUNCTION:COMMAND:Set the count and reset count for a breakpointseparately.break type address, count=count,reset_count=reset_count7.2.5 SEQUENCE BREAKPOINTSA sequence breakpoint is a special kind of breakpoint. Only if otherbreakpoints are hit in a specified order, the sequence breakpoint itself willhit.To hit a breakpoint without halting the program, the breakpoint in thesequence must be specified as a <strong>Pro</strong>be point. When a probe point is hit,the associated commands are executed and program execution iscontinued.When all specified probe points are passed in the logical sequence youspecified, the program stops at the last breakpoint in the sequence.To set a sequence breakpoint:Follow these steps:• From the Breakpoints menu, select Breakpoints... to open theBreakpoints dialog box.• Click on the Add > button and select Sequence Breakpoint...• • • • • • • •
7−16Chapter 7• Click the Sequence... button to open the Edit Sequence Breakpointdialog box.• Select a breakpoint from the Available Breakpoints list box andadd it to the sequence with the buttons ADD, AND or OR. Use theNOT button for a breakpoint that should not be passed. Allbreakpoints you add to the list must be enabled, otherwise thesequence breakpoint itself will not hit.BREAKPOINTS AND ASSERTIONSFrom the Command Window:• Use the sequence argument of the break command with a list ofbreakpoints to specify the sequence.For example,break sequence (0)(1 and 3)(2)In this example, the sequence breakpoint hits when probe point 0 is hitfirst, then 1 and 3 are hit in any order, and finally probe point 2 is hit.FUNCTION:COMMAND:Set a sequence breakpoint.break sequence sequence [, option]...7.3 DELETING BREAKPOINTSYou can delete a breakpoint directly from the source code, using the menuitems, or through the Command Window. To see a list of activebreakpoints, select Breakpoints... from the Breakpoints menu or use thel b command in the Command Window.To delete a code breakpoint:Click on the corresponding breakpoint toggle next to the source line inthe Source Window. This deletes the code breakpoint and the breakpointtoggle turns green. Be aware that if more than one breakpoint was set atthis position, all breakpoints are deleted.You can also follow these steps:• From the Breakpoints menu, select Breakpoints... to open theBreakpoints dialog box. This box contains a remove function.
Breakpoints and Assertions7−17• Select the Breakpoint from the list.• Click the Remove button.Use the break delete breakpoint_number | name command in theCommand Window. You need to know the breakpoint’s number or namefor this command.For example, to delete the breakpoint numbered 1, enter:break delete 1FUNCTION:COMMAND:Delete a breakpoint.break delete breakpoint_numberbreak delete breakpoint_nameTo clear all the breakpoints in the program, type:break delete allDo you want to delete all breakpoints?yFUNCTION:COMMAND:Delete all breakpoints.break delete all7.4 ENABLING/DISABLING BREAKPOINTSYou can enable or disable a breakpoint directly from the source code,using the menu items, or through the Command Window. To see a list ofactive breakpoints, select Breakpoints... from the Breakpoints menu oruse the l b command in the Command Window.To enable or disable a code breakpoint:Follow these steps:• From the Breakpoints menu, select Breakpoints... to open theBreakpoints dialog box. This box contains an edit function.• • • • • • • •
7−18Chapter 7On Windows:• In the list of breakpoints toggle the check box in front of thebreakpoint to enable or disable the breakpoint.On UNIX:• Select the breakpoint form the list.• Click the Enable or Disable button to enable or disable abreakpoint.BREAKPOINTS AND ASSERTIONSUse the break enable or break disable command in the CommandWindow to enable or disable a breakpoint. You need to know thebreakpoint’s number or name for these commands.For example, to disable the breakpoint numbered 1, enter:break disable 1FUNCTION:COMMAND:Disable a breakpoint.break disable breakpoint_numberbreak disable breakpoint_nameTo enable the breakpoint numbered 1, enter:break enable 1FUNCTION:COMMAND:Enable a breakpoint.break enable breakpoint_numberbreak enable breakpoint_name
Breakpoints and Assertions7−197.5 BREAKPOINT COMMANDS<strong>CrossView</strong> <strong>Pro</strong> allows you to attach commands to code and databreakpoints. When execution halts at a breakpoint, <strong>CrossView</strong> <strong>Pro</strong>executes the commands. Valid commands are almost any C statements and<strong>CrossView</strong> <strong>Pro</strong> commands, giving you a very powerful tool formanipulating a debugging session. To do this:Follow these steps:• From the Breakpoints menu, select Breakpoints... to open theBreakpoints dialog box.• Select an existing breakpoint from the list and click on the Edit...button or click on the Add > button and select a type of breakpointyou want to add.• Enter the breakpoint information in the first field, for example anaddress.• Click on the Advanced button. Note that the button is only visiblewhen there is more information available on the breakpoint.• Click in the Commands edit area.• Type in the commands to be executed when the breakpoint isreached.You do not need to enclose a group of commands in brackets. However,each individual command must be delimited by a semicolon.• • • • • • • •
7−20Chapter 7BREAKPOINTS AND ASSERTIONSFigure 7−3: Breakpoint CommandsType the commands, enclosed in brackets and delimited by semicolons,after commands= argument of the break command in the CommandWindow.For instance, suppose you want a program to stop at a breakpoint, displaya variable’s value, and resume execution all in one stroke. To perform thisfunction, you need to attach the appropriate commands to a breakpoint.Enter:break code main, commands={initval;C}This places a breakpoint at address main. When execution stops at thebreakpoint, <strong>CrossView</strong> <strong>Pro</strong> displays the value of initval and immediatelyresumes execution.If you enable the <strong>Pro</strong>be point check box, you can omit the C command.This is done automatically.You can attach almost any valid <strong>CrossView</strong> <strong>Pro</strong> commands or C statementto breakpoints. This latitude allows you to use breakpoints in powerfulways. Later on you find out how breakpoints can create patches in yourprogram.
Breakpoints and Assertions7−21<strong>CrossView</strong> <strong>Pro</strong> does not check the syntax of attached commands until thebreakpoint is hit.Data breakpoints accept command lists the same way as code breakpoints.For instance, to set a data breakpoint that monitors the lowest byte inmemory of the value of initval, enter:break data &initval, access_type=w, commands={initval; C}Every time the program writes to the lowest byte in memory of thevariable initval, this breakpoint halts the program, prints the value ofinitval and continues execution.For more information on the use of attached commands, see the Patchesand Diagnostic Output and Statistical Information sections later in thischapter.7.5.1 ATTACHING CONDITIONALS TO A BREAKPOINTYou can pass standard C conditionals to a breakpoint.For example:break code demo.c#63, commands= {if (initval==17) {C}{initval/n}}stops the program at line 63, checks to make sure the variable initval is17, and resumes execution if it is. If initval’s value does not equal 17,<strong>CrossView</strong> <strong>Pro</strong> prints the value, and the program remains halted.7.5.2 ATTACHING MACROS TO A BREAKPOINTYou can attach any currently defined macro to a breakpoint in a commandlist. For example, suppose you define a macro named rg that checks thevalue of the variable initval. The command to define this macro is:set rg "if (initval != 17) {initval/n} {C}"If the value does not equal 17, the macro prints the value and halts theprogram. Otherwise, execution continues.You can include this macro at any point by attaching it to a breakpoint.Entering:• • • • • • • •
7−22Chapter 7break code demo.c#51, commands={rg}break code demo.c#63, commands={rg}this is a very efficient way to insert the macro with breakpoints at lines 51and 63.For more information on macros, refer to Defining and Using Macroschapter.BREAKPOINTS AND ASSERTIONS7.5.3 ATTACHING STRINGS TO A BREAKPOINTYou can attach strings to a breakpoint’s command list. This feature isuseful for placing comments and reminders within your breakpoints.Attaching a string to a breakpoint also eliminates the need for diagnosticprintf( ) statements in your compiled code.For example, you could place a breakpoint on line 49 such as:49 b {"Passed line 47\n";C}Whenever the breakpoint on line 49 is hit, <strong>CrossView</strong> <strong>Pro</strong> prints the stringand continues execution.7.6 SUPPRESSING BREAKPOINT MESSAGESWhenever a breakpoint is hit, <strong>CrossView</strong> <strong>Pro</strong> displays in the CommandWindow, the name of the function, line number and file in which thebreakpoint appears. You can suppress this information by settingbreakpoint silent" mode. In the silent mode, the current location is notprinted out.To set silent mode you can use the Q (for quiet) command as part of thecommand attached to a breakpoint definition.Pass the Q command to a breakpoint first. For example:51 b {Q; initval = 5}stops the program on line 51, but does not print a message stating wherethe break occurred.
Breakpoints and Assertions7−237.7 UP−LEVEL BREAKPOINTSUp−level breakpoints are breakpoints set at the entrance and/or exit offunctions. Basically, up−level breakpoints are code breakpoints that aredirectly connected to the current HLL stack handling.To see the current HLL stack, open the Stack Window or enter the tcommand in the Command Window.You can set up−level breakpoints via the Stack Window or in theCommand Window. You cannot set up−level breakpoints in the SourceWindow:Double−click on the function in the Stack Window to install a stackbreakpoint after the function call.You can also follow these steps:• Click on the function in the Stack Window.• From the Breakpoints menu, select either Stack Breakpoint |After Call to Function or Stack Breakpoint | At Function EntryYou have the option of setting the breakpoint before (function entry) orafter (up−level) a selected function.All breakpoints set through the Stack Window are temporary by default.To make a breakpoint permanent, select Breakpoints... from theBreakpoints menu to open the Breakpoints dialog. Select the breakpointyou want to edit and click on the Edit... button. Click on the Advanced>>button and disable the Remove when hit check box.In the Command Window, use the following commands:Command Function TypebU Sets breakpoint after call to function temporarybu Sets breakpoint after call to function permanentbB Sets breakpoint at beginning of function temporarybb Sets breakpoint at beginning of function permanent• • • • • • • •
7−24Chapter 7For example, suppose you have accidentally single−stepped into afunction called factorial( ). If you do not want to single step throughthe function, an up−level breakpoint can help you. Enter:bUBREAKPOINTS AND ASSERTIONSThe bU command sets a temporary breakpoint after return of the function.Now, instead of having to single step all the way through the function,you can start continuous execution, which stops when it hits the newbreakpoint at the function’s return. Note that it makes no differencewhether the function has several possible points of return; the up−levelbreakpoint works at all points of return. Note that when the function thatcontains the breakpoint is called from one of the functions that are locatedbelow it on the stack, the execution may be stopped before returning atthe desired stack level, for example with recursive functions.When setting up−level breakpoints from the Command Window, you canspecify how deep in the stack the function’s address is located. Forexample, if you are two functions down from the main( ) program,enter:2 bUThis command breaks when you return to the top level of the call graph.FUNCTION:COMMAND:FUNCTION:COMMAND:FUNCTION:COMMAND:Set a temporary breakpoint after call to function.[stack] bU [commands]Set a permanent breakpoint after call to function.[stack] bu [commands]Set a temporary breakpoint at function entry.[stack] bB [commands]
Breakpoints and Assertions7−25FUNCTION:COMMAND:Set a permanent breakpoint at function entry.[stack] bb [commands]7.8 PATCHESA patch is a means of using <strong>CrossView</strong> <strong>Pro</strong> to change the execution ofyour program without recompiling. Patches involve manipulatingbreakpoints to skip code, include code, or replace existing code with newcode.Basically, a patch is a breakpoint with certain associated commands thatenable you to alter program execution. This capability is a usefuldebugging tool.You can associate the commands used to patch code with a breakpointthrough either the Command Window or through the Commands edit boxin the Breakpoint dialog box. The examples below set breakpoints using<strong>CrossView</strong> <strong>Pro</strong> commands typed in the Command Window. You can alsoset breakpoints in the Breakpoints | Breakpoints... dialog. In this casethe commands between the brackets are entered into the Command editarea.7.8.1 PATCHING CODE OUT OF A PROGRAMTo patch code out of a program, you can set a breakpoint that changes theexecution position. For instance, suppose you want to patch an infiniteloop out of your source.78: while (loopvar)79: {80: sum = sum + 1;81: }82:83: sum = sum + 5;On line 78, place a breakpoint that jumps to line 83, effectively bypassingthe loop. In the Command Window, enter:78 b {g 83; C}• • • • • • • •
7−26Chapter 7This creates a breakpoint on line 78 that does nothing more than move theexecution position beyond the loop and issue a C command. Rememberthat the breakpoint on line 78 is hit before the C statement on that lineexecutes.7.8.2 PATCHING CODE INTO A PROGRAMBREAKPOINTS AND ASSERTIONSYou can also patch code into a program by just including the code in thebreakpoint command. For example, suppose you want to add an equationwith the variable loopvar.78: while (loopvar)79: {80: sum = sum + 1;81: }82:83: sum = sum + 5;In the Command Window, enter:78 b {loopvar = 0;C}This command halts execution at line 78, adds the statement loopvar=0to the program, and continues execution.7.8.3 REPLACING CODE IN A PROGRAMFinally, you can combine the two techniques described above to replacecode in a program. For instance, suppose you want to replace an infiniteloop with new code.78: while (loopvar)79: {80: sum = sum + 1;81: }82:83: sum = sum + 5;In the Command Window, enter:78 b {Q; if (sum
Breakpoints and Assertions7−27This command sets a breakpoint that halts execution (quietly) at line 78and inserts an if statement into the program. If sum is less than 100, sumincrements and line 78 executes again. If sum equals 100, <strong>CrossView</strong> <strong>Pro</strong>moves the execution position to line 83 (beyond the infinite loop) andresumes execution.7.9 DIAGNOSTIC OUTPUT AND STATISTICALINFORMATIONBreakpoints with attached commands allow you to report on variousvariables while the program executes. In the past, one inefficient methodof tracking variables was to litter code with printf() statements. Usingbreakpoints makes that process unnecessary.For instance, suppose you want to keep track of the variable loopvar atline 59 of a program. Install a breakpoint with the following command:59 b {Q; loopvar; C}The breakpoint halts the program, prints the value of loopvar, andresumes execution. The Q command suppresses the listing of where thebreak occurred. This breakpoint does not affect the source code and norecompilation is necessary.Using special variables, you can also keep statistics about your program,such as how many times a line of code executes or how many times avariable is accessed.For example, suppose you want to know how many times line 60executes. You must define a special variable to keep track of yourstatistical data, and set a breakpoint to accumulate the data for you.First, define the special variable. In the Command Window, enter:$test = 0This command defines the special variable $test and sets it to zero. Forconvenience, you can also set a breakpoint at the beginning of theprogram that initializes $test.Secondly, set a breakpoint at line 60 that increments $test and continuesexecution every time the program hits line 60:60 b {$test++ ; C}• • • • • • • •
7−28Chapter 77.10 ASSERTIONSAn assertion is a collection of debugger commands executed by thedebugger after each program line. When you execute a program usingassertions, the debugger is in assertion mode. Running the debugger inassertion mode is a way of executing continuous control of certain data.BREAKPOINTS AND ASSERTIONSUsing assertions, you can have continuous control of certain data and stopprogram execution if any of the set conditions are fulfilled. In this respect,assertions are similar to data breakpoints. Assertions, however, are moreversatile than data breakpoints. For instance, a data breakpoint can onlydetect when a variable is accessed. An assertion, on the other hand, cancheck that the variable’s value falls within a certain range. Also, anassertion can monitor variables whose values are kept in registers.Each individual assertion can be activated or deactivated. In addition, youcan also choose to suppress all assertions by turning off the globalassertion mode.Opening the Assertions Dialog BoxFrom the Breakpoints menu, select Assertions...The Assertions dialog box contains scrollable lists of all defined assertions,and provides functions for defining, activating, suspending, editing anddeleting assertions.7.10.1 ASSERTION MODEThe debugger is running in assertion mode when there is at least oneactive assertion. A program executing in assertion mode is actually beingsingle−stepped very quickly, to ignore breakpoints. Because the programis single−stepping, however, it runs significantly slower than at normalspeed.An Assertion Mode Active checkbox is available that activates all marked(*) assertions. Clear this option if you want to suspend all assertionstemporarily. To activate marked assertions:Open the Assertions dialog box and activate all marked assertions byenabling the Assertion Mode Active check box.
Breakpoints and Assertions7−29In the Command Window, enter the A command:• A a activates assertion mode• A s suspends assertion mode• A (by itself) toggles the assertion mechanismThe Global Active state activates all assertions. Globally activating theassertion mode, however, does not change how each assertion is marked.FUNCTION:COMMAND:Activate assertion mechanism.A aFUNCTION:COMMAND:Suspend assertion mechanism.A sFUNCTION:COMMAND:Toggle assertion mechanism.A7.10.2 DEFINING AN ASSERTIONTo define or edit an assertion:• From the Breakpoints menu, select Assertions... to open theAssertions dialog box.• Click on the New... button to open a text edit dialog box as shownin figure 7−4 to type in commands.• • • • • • • •
7−30Chapter 7BREAKPOINTS AND ASSERTIONSFigure 7−4: Defining AssertionsUse the a command followed by a list of commands.FUNCTION:COMMAND:Create an assertion.a commandsAssertions accept standard C statements and certain <strong>CrossView</strong> <strong>Pro</strong>commands as arguments.An assertion usually contains a conditional. For example, suppose youwant to create an assertion that watches the value of the global variableinitval to see that it’s value does not exceed a certain limit. In this case,you enter in the Assertion dialog box (or into the Command Window afterthe a command):if (initval > 17) {x}This command creates an assertion with the condition that if initvalexceeds 17, <strong>CrossView</strong> <strong>Pro</strong> halts the program. The {x} is a specialassertion command that tells <strong>CrossView</strong> <strong>Pro</strong> to halt the program and returncontrol to you.
Breakpoints and Assertions7−31Be aware that, depending on the level of optimization, variables may notexist anymore in the compiled application so you may not be able to usethem in assertions. In this case, compile your application at a loweroptimization level.7.10.3 EDITING AN ASSERTIONTo edit the contents of an assertion:Follow these steps:• From the Breakpoints menu, select Assertions... to open theAssertions dialog box.• Click on the assertion to edit.• Click on the Edit... button. A text edit dialog box opens allowingyou to edit the assertion. Click on OK or Cancel when finished.You must delete the specific assertion (section 7.10.5) and define a newassertion (previous section) with the desired command.7.10.4 ACTIVATING AND SUSPENDING ASSERTIONSA particular assertion is either active or suspended. A suspended assertiondoes not execute before every line, but it retains its definition.You may find it helpful to use activate and suspend assertion commands inconjunction with code breakpoints, since assertions tend to slow the targetprogram. By attaching commands to a breakpoint to activate and suspendassertions, you can turn assertions on only for certain sections of codewhere a particular value needs checking. This method can dramaticallyspeed up the program.From the Breakpoints menu, select Assertions... and double−click onthe assertion’s number.To activate or suspend an assertion from the Command Window, you mustknow the assertion’s number. To see a list of assertions and their assignednumbers:• Enter l a, the list assertions command, in the Command Window.• • • • • • • •
7−32Chapter 7To activate an assertion:• Enter assertion_number a a command. For example:2 a a activates assertion 2To suspend an assertion:• Enter the assertion_number a s command. For example:2 a s suspends assertion 2BREAKPOINTS AND ASSERTIONSFUNCTION:COMMAND:FUNCTION:COMMAND:Activate an assertion.assertion_number a aSuspend an assertion.assertion_number a s7.10.5 DELETING ASSERTIONSDeleting an assertion removes its definition. It is important to note thedifference between suspending an assertion and deleting an assertion:deleting an assertion removes its definition for good, while suspending itretains the definition but prevents its execution.Follow these steps:• From the Breakpoints menu, select Assertions... to open theAssertions dialog box.• Click on the assertion to delete.• Click the Delete button. Click on OK or Cancel when finished.Follow these steps:• List the assertion numbers with l a command in the CommandWindow.• In the Command Window, enter the assertion number followed bythe a d command. For example:2 a d Deletes assertion 2.
Breakpoints and Assertions7−33FUNCTION:COMMAND:Delete an assertion.assertion_number a d• • • • • • • •7.10.6 USING ASSERTIONSYou can use assertions for almost any type of debugging task. Forexample, if you want to check the value of a global variable,global_val, during the execution of a certain function, f(). A databreakpoint or a straightforward <strong>CrossView</strong> <strong>Pro</strong> assertion does not sufficefor this task since there is no way to make either method limited to thatfunction’s code range. The solution lies in creating an assertion that isactive only over a specific range of lines. In this case, you could solveyour problem with the following steps:110: void f(void)111: {112: if ( global_flag )113: {114: ++global_val;115: }116: else117: {118: global_val = g();119: }120: }Using the mouse and menu:1. From the Breakpoints menu, select Assertions... to open the Assertionsdialog box.2. Click on the New... button.3. Set up the assertion to check the value of global_val. Enter:if (global_val == 17) {x}This assertion halts program execution if the value of global_val equals17.4. From the Breakpoints menu, select Breakpoints... to open theBreakpoints dialog box. Click the Add > button and select CodeBreakpoint...
7−34Chapter 75. We want to establish a breakpoint at line 112, the first line of the functionf( ) and attach commands to the breakpoint to activate assertion modeand continue execution. Change the Line number to 112. Click in theCommand edit area and enter:A a; CActivate the assertion and continue.BREAKPOINTS AND ASSERTIONS6. Create an assertion whose only function is to check that the current linenumber is still valid for assertion mode. To do this, use the reservedspecial variable $LINE, which contains the line number of the currentexecution position. In the Assertions dialog box, click on New... andenter:if ($LINE >= 120) {A s; 1 x; C}If the line number exceeds 120, the program is about to leave the functionf( ) and <strong>CrossView</strong> <strong>Pro</strong> deactivates assertion mode. Normally, the xcommand would make the program stop, but the non−zero value tells<strong>CrossView</strong> <strong>Pro</strong> to execute the rest of the commands in the list, in this case,C for continue.You must enter all commands in the Command Window.1. First set up the assertion you want:a if (global_val == 17) {x}2. Now set a breakpoint on the first line of the function factorial() thatwill activate assertion mode, and continue execution:110 b {A a; C}3. Now create an assertion that does nothing but make sure that the currentline number is still valid for assertion mode. If the line number exceeds120, you know you have left the function f() and assertion mode shouldbe suspended.a if ($LINE >= 120) {A s; 1 x; C}$LINE is a reserved special variable that <strong>CrossView</strong> <strong>Pro</strong> maintainscontaining the number of the line currently executing. If it becomes equalto 120, assertion mode is turned off. Normally, the x would make theprogram stop, but the non−zero value 1 tells <strong>CrossView</strong> <strong>Pro</strong> to execute therest of the commands in the list, in this case, C for continue.
Breakpoints and Assertions7−35In this manner you have created an assertion that is only active over alimited range of source lines.7.10.7 GATHERING STATISTICS WITH ASSERTIONSYou can also use assertions to gather statistics about your code. Forinstance, you can find out how many lines of C code execute in aparticular session:a {$numlines++}$numlines is a user−defined special variable that increments on each lineof C code. When the program stops, type:$numlinesand <strong>CrossView</strong> <strong>Pro</strong> gives the result. To start again, you may want tore−initialize $numlines to zero:$numlines = 0Or just set a breakpoint on the first line of code to do the same.• • • • • • • •
BREAKPOINTS AND ASSERTIONS7−36Chapter 7
CHAPTERDEFINING ANDUSING MACROS8
MACROS8−2Chapter 8CHAPTER8
Defining and Using Macros8−38.1 CROSSVIEW PRO MACROSA macro is a user−created shorthand for any sequence of <strong>CrossView</strong> <strong>Pro</strong>or C commands and expressions. Macros allow you to debug moreefficient when using <strong>CrossView</strong> <strong>Pro</strong> by substituting a short string for alonger combination of words and evaluators.You can use a macro anywhere an <strong>CrossView</strong> <strong>Pro</strong> or C expression is valid:in a breakpoint’s command list, with assertions, from the keyboard, amongother places. <strong>CrossView</strong> <strong>Pro</strong> also allows you to save macro definitions, sothey are always available. By passing parameters to a macro, you cancreate powerful and flexible macros to debug your code more efficiently.You can use macros in the Command Window, or connect them to thegraphic interface in a feature called the toolbox. You can have this toolboxvisible as a <strong>CrossView</strong> <strong>Pro</strong> window and use it to execute a macro byclicking a button. You control which macros have corresponding buttons,making the toolbox easy to adapt to different situations.8.2 DEFINING MACROSYou can create as many macros as you want:From the Tools menu, select Macro Definitions... to open the MacroDefinitions dialog box and click on the New... button.Figure 8−1: Macro Definitions• • • • • • • •
8−4Chapter 8In the Command Window, use the set command followed by the macro’sinvocation name and the list of commands. Note that the list of commandsmust be in (double) quotation marks. For example, the command:set st "e main; R"creates a macro call st that tells <strong>CrossView</strong> <strong>Pro</strong> to change the viewingposition to be the first executable line in the function main( ) and restartthe program from the beginning. Each time you enter st in the CommandWindow, <strong>CrossView</strong> <strong>Pro</strong> substitutes the lengthier list of commands in thedefinition.FUNCTION:COMMAND:Create a macro.set name "commands"Note that there is no rule that the macro definition must be shorter thanthe commands it represents. For instance, you could substitute break forthe b command, to make <strong>CrossView</strong> <strong>Pro</strong>’s command language moreexpressive:set break "b"Now instead of typing 74 b to set a breakpoint, you can also type:74 breakMacros defined using either the command line or the graphic interface areaccessible both from the Command Window and the Toolbox.Macros may call other macros, so it is possible to use simple macros asbuilding blocks for more complex functionality. No macro, however, cancall itself, or another macro that refers to the calling macro, since this typeof action results in infinite recursion.MACROSBecause of the order in which <strong>CrossView</strong> <strong>Pro</strong> parses statements, you maynot use the <strong>CrossView</strong> <strong>Pro</strong> commands # or % in a macro.
Defining and Using Macros8−58.2.1 LISTING MACROSFrom the Tools menu, select Macro Definitions... to open the MacroDefinitions dialog box. This dialog box contains a scrollable list of themacros.To see the current definition of a macro:Follow these steps:• From the Tools menu, select Macro Definitions... to open theMacro Definitions dialog box.• Click on the macro that you want to see.• The Commands box shows (a part of) the macro. If you need to seemore, click on the Edit... button.Type the echo name command in the Command Window. For instance, tosee the definition for the st macro:echo ste main; C 56Command.Output.FUNCTION:COMMAND:Display macro expansion.echo name8.2.2 REDEFINING A MACROIf you want to change the definition of a macro:From the Tools menu, select Macro Definitions... to open the MacroDefinitions dialog box. Click on the name of the macro you want tochange and click on the Edit... button.In the Command Window, use the set command again, but enter anexclamation point after the macro name. For instance, to redefine themacro st, which was defined in the example above, use the command:set st! "e main; C 56"• • • • • • • •
8−6Chapter 8Now, the st macro changes the viewing position and restarts programexecution, placing a temporary breakpoint at line 56. Be sure you do notinclude a space before the exclamation point. Otherwise, <strong>CrossView</strong> <strong>Pro</strong>may interpret the ! as the C not" operator.8.2.3 SAVING MACRO DEFINITIONS TO A FILEYou can save all the macros you define in a debugging session in anexternal file. This way, you do not lose the definitions when the programends.To save macros to an external file:Follow these steps:• From the Tools menu, select Macro Definitions... to open theMacro Definitions dialog box.• Click on the Save as... button. A Save Macro File dialog box opens.• If you want to save a file previously opened, click on the Savebutton. This saves the file without opening the Save Macro Filedialog box.• Alternatively, you can use the Autosave check box. WhenAutosave is checked, all macros are saved in the ’current file’ whenyou leave <strong>CrossView</strong> <strong>Pro</strong>.Type the save file command in the Command Window. This commandsaves your macros to the file of your choice. For instance:save macro.macwrites all your macros to macro.macFUNCTION:COMMAND:Save macros to a file.save filenameMACROS
Defining and Using Macros8−78.2.4 LOADING MACRO DEFINITIONS FROM A FILEYou can load saved macros anytime you want to re−use a definition. Thereis no limit to the number of times you can load macros.To load a macro file:Follow these steps:• From the Tools menu, select Macro Definitions... to open theMacro Definitions dialog box.• Click on the Load... button and select the macro file you want toload.• Alternatively, you can use the Autoload check box. WhenAutoload is checked, the macros saved in the ’current file’ areloaded at startup.To reinstate your macro definitions from the Command Window, use:< filename.macYou must load a program before you can read a macro definition file.Autoload will be ignored when the Execute these settings at<strong>CrossView</strong> startup check box in the Load Symbolic Debug Info dialogbox is not checked.For more information on record and playback functions, see the nextchapter, Command Recording & Playback.• • • • • • • •
8−8Chapter 88.2.5 DELETING MACROSTo delete a specific macro:Follow these steps:• From the Tools menu, select Macro Definitions... to open theMacro Definitions dialog box.• Highlight the name of the macro.• Click on the Delete button. To delete all the macro definitions atthe same time, click on the Delete All button. <strong>CrossView</strong> <strong>Pro</strong>prompts you for confirmation.Type the unset command in the Command Window. For example, toremove the st macro, enter:unset st!When you are removing a macro definition in this manner, you must placean exclamation point after the macro name to prevent <strong>CrossView</strong> <strong>Pro</strong> fromexpanding the name to its full macro definition. To update your macrodefinition files, issue a save command after using unset.You can remove all existing macro definitions by entering the unsetcommand by itself. <strong>CrossView</strong> <strong>Pro</strong> prompts you for confirmation beforedeleting the macros:unsetDo you want to delete all macros?yFUNCTION:COMMAND:Delete a macro.unset name!MACROS
Defining and Using Macros8−98.3 MACRO PARAMETERSMacros can accept arguments. Parameters are labelled sequentially in amacro definition: $1, $2, $3, etc. Note that $0 has no meaning. Whenyou invoke a macro with parameters, enclose the parameters withparentheses and separate them with commas.<strong>CrossView</strong> <strong>Pro</strong> macros can accept any number of parameters, so it ispossible to create very complex command shortcuts. You may use anytype of parameter when defining a macro, including integers, strings, oraddresses. Note, however, that you must pass the macro the correct type atinvocation.For instance, suppose you want to set a detailed breakpoint on anynumber of lines and a parameter is to specify each line number on whichto install a breakpoint. Defining a macro named brk, type in the MacroDefinitions dialog box:$1 b {Q; initval; recordvar.a; if (initval > 1) {C}}or type in the Command Window:set brk "$1 b {Q; initval; recordvar.a; if (initval >1) {C}}"In this case, the argument $1 represents the intended line number. To usethe brk macro, type:brk(72)From the Command Window<strong>CrossView</strong> <strong>Pro</strong> replaces every instance of $1 with the value 72. For thisexample, that means a breakpoint is set at line 72.• • • • • • • •
MACROS8−10Chapter 88.4 REDEFINING EXISTING CROSSVIEW PROCOMMANDSUsing macros, you can even redefine an existing <strong>CrossView</strong> <strong>Pro</strong> command.For instance, you could redefine the breakpoint command b to alwaysplace a breakpoint at line 72 of your source code. To do this, enter thecommand:set b "72 b!"<strong>CrossView</strong> <strong>Pro</strong> now interprets the b command as 72 b.The exclamation point in the definition is necessary to prevent infiniterecursion. It tells <strong>CrossView</strong> <strong>Pro</strong> to take the command literally and to notexpand it into a macro definition. For example:66 b!<strong>CrossView</strong> <strong>Pro</strong> interprets this command as the standard breakpointcommand and places a breakpoint at line 66, despite the macro definitionfor b.Be sure not to have any space between the command and the exclamationpoint. Otherwise <strong>CrossView</strong> <strong>Pro</strong> may interpret the ! as the C not operator.
Defining and Using Macros8−118.5 USING THE TOOLBOXThe <strong>CrossView</strong> <strong>Pro</strong> toolbox, shown in figure 8−2, is controlled from theView menu. Using the Tools menu, you can configure the toolbox anddefine the macros for it. You can resize the toolbox to the size you want.Figure 8−2: <strong>CrossView</strong> <strong>Pro</strong> Toolbox8.5.1 OPENING THE TOOLBOXTo open the toolbox:From the View menu, select Toolbox.The Toolbox is a pop−up window that remains on top of the <strong>CrossView</strong><strong>Pro</strong> Desktop while you work in other windows.8.5.2 CONNECTING MACROS TO THE TOOLBOXTo configure the toolbox, select Toolbox Setup... from the Tools menu toview the Toolbox Setup dialog box, shown in figure 8−3. This dialog boxdisplays the toolbox buttons and an alphabetized list of the current macrodefinitions.To connect a macro to a toolbox button:Follow these steps:• Click on the button you wish to change• Scroll through the macro list to highlight the desired function• • • • • • • •
8−12Chapter 8• Click on the Assign button or press the Enter keyNote that double clicking on the macro name in the alphabetized listperforms the third step automatically. The name of the new functionappears on the selected button and the connection is performed.Figure 8−3: Setting Up the ToolboxDo not assign parameterized macros to the toolbox since there is no wayto pass in parameter values.8.5.3 REMOVING A MACRO CONNECTIONTo delete a macro definition from the toolbox:Follow these steps:MACROS• From the Tools menu, select Toolbox Setup... to open theToolbox Setup dialog box.• Select the desired button.• Click Clear.This deletes the macro definition from the toolbox.
CHAPTERCOMMANDRECORDING &PLAYBACK9
9−2Chapter 9RECORD & PLAYBACKCHAPTER9
Command Recording & Playback9−39.1 RECORDING COMMANDS<strong>CrossView</strong> <strong>Pro</strong> lets you save a series of <strong>CrossView</strong> <strong>Pro</strong> commands to thefile of your choice. This is record mode. You can re−load a saved file torepeat parts of debugging tasks or replay a debugging session (up to thepoint where you left the last time).Record mode means that all <strong>CrossView</strong> <strong>Pro</strong> commands from the keyboard,mouse or menu are recorded to a disk file. The debugger can read this fileand execute the commands as if they were entered into the CommandWindow. This is called playback mode, see more about playback modelater in this chapter.Record and playback modes can never be active at the same time.You can record <strong>CrossView</strong> <strong>Pro</strong> commands and/or Emulator commands.When recording on <strong>CrossView</strong> <strong>Pro</strong> command level, all commands that youtype in the Command Window, as well as the <strong>CrossView</strong> <strong>Pro</strong> commandlanguage equivalents of dialog actions and menu selections are saved in afile. When you (also) want to record commands entered in the EmulatorCommand Window, you can record them in a separate dialog or combinethem with the <strong>CrossView</strong> <strong>Pro</strong> commands.From the Command Window you control record mode using either themouse or keyboard commands. To start or setup recording:From the menu system:• From the Tools menu, select Record | <strong>CrossView</strong>... to open theRecord <strong>CrossView</strong> dialog box, or select Record | Emulator... toopen the Record Emulator dialog box.The Record dialog box contains an Automatically at <strong>CrossView</strong>startup check box. If you select this check box the debugger entersrecord mode at every startup.• Enter the name of the file in the Command file: edit field, or clickon the Browse... button to select an existing file. The defaultfilename extension is .cmd.• Optionally, select Include emulator commands in the Record<strong>CrossView</strong> dialog. In this case all recorded emulator commands arealso recorded, preceded by the "o" command.• Click on the OK button to save the current settings into theinitialization file xvw.ini for following debugging sessions.• Click on the Start button to start recording.• • • • • • • •
9−4Chapter 9Enter the > command with the name of the file to start recording. Forexample, enter:>session.cmdAfter you invoke this command, <strong>CrossView</strong> <strong>Pro</strong> saves every executedcommand, whether using the mouse or manually typed into the CommandWindow, to the file session.cmd.FUNCTION:COMMAND:Save <strong>CrossView</strong> <strong>Pro</strong> commands to a file.>filenameFUNCTION:COMMAND:Save <strong>CrossView</strong> <strong>Pro</strong> commands to a file and forceflushing.>!filenameRECORD & PLAYBACKFUNCTION:COMMAND:FUNCTION:COMMAND:Save <strong>CrossView</strong> <strong>Pro</strong> and emulator commands to a file.>@filenameSave emulator commands to a file.>#filename9.1.1 ENTERING COMMENTSEvery command, whether typed into the Command Window or the resultof a mouse or menu action goes into the recording file. To add commentsto a file recording <strong>CrossView</strong> <strong>Pro</strong> commands, enclose text typed in theCommand Window with C comments delimiters, /*" and */". Whenlogging emulator commands, refer to your emulator documentation for theappropriate comment characters.
Command Recording & Playback9−59.1.2 SUSPEND RECORDINGThis function acts like the pause button on a tape recorder: the recordingmechanism stays in place, but suspends temporarily. <strong>CrossView</strong> <strong>Pro</strong> doesnot save to file any commands you enter while you suspend recording,but the file remains open and ready to accept input. To suspendrecording:From the Tools menu, select Record | <strong>CrossView</strong>... or select Record |Emulator... Click on the Suspend button.In the Command Window, use the >f o >#f command (for false").FUNCTION: Suspend recording <strong>CrossView</strong> <strong>Pro</strong> commands.COMMAND: >fFUNCTION:COMMAND:Suspend recording emulator commands.>#f9.1.3 RESUME RECORDINGThis function is the counterpart of the suspend recording function.<strong>CrossView</strong> <strong>Pro</strong> resumes adding commands to the current record file. Anynew command you enter appears in the file; they do not affect thecommands already saved.From the Tools menu, select Record | <strong>CrossView</strong>... or select Record |Emulator... Click on the Resume button to resume recording.In the Command Window, use the >t or >#t command (for true").FUNCTION: Resume recording <strong>CrossView</strong> <strong>Pro</strong> commands.COMMAND: >t• • • • • • • •
9−6Chapter 9FUNCTION:COMMAND:Resume recording emulator commands.>#t9.1.4 CHECK RECORDING STATUSIf at any point you do not remember whether recording is on or off, checkby:From the Tools menu, select Record | <strong>CrossView</strong>... or select Record |Emulator... If record mode is active, the Stop button is enabled. If theStart and OK buttons are enabled, record mode is off.Enter the > command in the Command Window.This command shows the status of the recording and logging mechanism.For example, if you enter > you might see:RECORD & PLAYBACK>Output logging is OFFCommand recording is ONEmulator command recording is OFFTarget communication logging is OFFThe > command gives you the status for the different recordingmechanisms. Output logging and target communication logging aredescribed below.9.1.5 CLOSE FILE FOR RECORDINGClosing a file for recording differs from suspending recording in that whenyou close a file, you may not add any more commands to it. If you wereto start recording again using the same filename, the old commands in thefile would be deleted. (Note that this does not exclude editing the filemanually by some other means, since the file is saved as ASCII text.)From the Tools menu, select Record | <strong>CrossView</strong>... or select Record |Emulator... Click on the Stop button to stop recording.
Command Recording & Playback9−7Enter the >c or >#c command to close the file.FUNCTION: Close command recording file.COMMAND: >cFUNCTION:COMMAND:Close emulator command recording file.>#c9.1.6 COMMAND RECORDING EXAMPLEFor example, consider the following command sequence (from theCommand Window):>session.cmd−−−−− Start Recording to Fileinitvalp 12−−−−− Carriage Return>f −−−−− Suspend Recordingl bsum>t −−−−− Resume Recording/* This is a comment! */>cThis series starts with a command to record to a file named session.cmd.The blank line above represents a carriage return. After the last command,c, if you were to view this file, it contains:initvalp 12/* This is a comment! */The saved command file contains simply the commands, without anyoutput. Note that commands entered while recording was suspended (l band sum) do not appear in the file. Carriage returns are not recognized ascommands.• • • • • • • •
9−8Chapter 99.2 PLAYING BACK COMMAND FILESOnce you have recorded a set of <strong>CrossView</strong> <strong>Pro</strong> commands, you can playthem back to recreate a debugging session or repeat often−usedsequences. Running the debugger while reading commands from a file isplayback mode.Remember that for a file to be played back, it can only contain <strong>CrossView</strong><strong>Pro</strong> or emulator commands. For this reason, screen output files cannot beused in playback mode. Refer to the Recording Commands section earlierin this chapter for more information.As with recording, the Command Window controls playback mode. Toplayback a command file:Follow these steps:1. From the Tools menu, select Playback | <strong>CrossView</strong>... to open the<strong>CrossView</strong> Playback dialog box, or select Playback | Emulator... to openthe Emulator Playback dialog box.RECORD & PLAYBACKYou can choose to playback either <strong>CrossView</strong> <strong>Pro</strong> commands or Emulatorcommands. Open the Emulator Command Window if the playback filecontains commands sent directly to your emulator.2. Type the playback filename or use the Browse... button to select the file.The default filename extension is .cmd.In the Playback dialog box, you have two additional options: Playback atXVW startup and Continuous playback. <strong>CrossView</strong> <strong>Pro</strong> enters playbackmode automatically when you start the debugger if you click on thePlayback at XVW startup check box in the Playback dialog box. Theentire playback file executes if you enable the Continuous playbackcheck box.3. Click on the Execute button to start the playback.In the Command Window, use the < or
Command Recording & Playback9−99.2.1 SETTING THE TYPE OF PLAYBACKEnable the Continuous playback check box in the <strong>CrossView</strong> Playbackdialog box to turn on continuous play back of commands.In the Command Window, there are two commands for the type ofplayback. The < filename command starts playback. Commands are readfrom a file and executed without any stop. For example:
9−10Chapter 9When the debugger reaches a < or
Command Recording & Playback9−11The following command file session.cmd loads the .abs file,downloads the code, runs the code and exits.N hello.absdn__EXIT biR$pcq yload the symbolsdownload the programset a breakpoint at the exit pointrun the programoptional: show the program counterexit <strong>CrossView</strong> <strong>Pro</strong>where hello.c contains#include void main(){printf("Hello World!\n");}4. Copy the .abs file to the temporary directory. This is needed because<strong>CrossView</strong> <strong>Pro</strong> changes its working directory when the N command isused.5. The following line executes <strong>CrossView</strong> <strong>Pro</strong> in batch mode and waits for itto finish:Windows XP/2000:start /wait c:\c166\bin\xfw166 −−timeout=120 −tcfg sim166.cfg−p session.cmd −R session.logUNIX:xfw166 −−timeout=120 −tcfg sim166.cfg −p session.cmd−R session.logThis command must be issued in the temporary directory! After theexecution has ended, the file session.log contains a transcript of thecommands.6. Save the output files and clean up (or remove) the temporary directory.This must be done because the xvw.ini file has been modified now. If<strong>CrossView</strong> <strong>Pro</strong> would be started again in the temporary directory, the filesession.cmd would be executed again.The −−timeout=n_seconds command activates the batch operation modeof <strong>CrossView</strong> <strong>Pro</strong>. It causes <strong>CrossView</strong> <strong>Pro</strong> to terminate when the specified• • • • • • • •
9−12Chapter 9amount of time has elapsed, which is crucial in batch processing: if aprogram does not terminate, the timeout will terminate <strong>CrossView</strong> <strong>Pro</strong>, sothat the next program in the batch can be executed. <strong>CrossView</strong> <strong>Pro</strong> willalso terminate in the batch mode if a modal dialog pops up, since thisrequires user interaction to continue. Before <strong>CrossView</strong> <strong>Pro</strong> exits, the textin the dialog will be written to the log file. A special case of this dialog isthe ’End of program reached’ dialog. For this reason, the line __EXITbi has to be added to the .cmd file, so it is possible to do some things(for example, read registers modified by a machine code program) afterthe program is finished. If the breakpoint at __EXIT is absent, <strong>CrossView</strong><strong>Pro</strong> immediately exits after having executed the R command, so anyconsecutive commands will be ignored.9.4 LOGGINGLogging means that all output text to a particular window is saved in a filefor later use. Two windows allow logging:RECORD & PLAYBACK• Command Output Window(upper part of the <strong>CrossView</strong> Command Window)• Emulator Output Window(upper part of the Emulator Command Window)"GDI Accesses" can also be logged. This is the information transferredbetween <strong>CrossView</strong> <strong>Pro</strong> and the Debug Instrument (DI).You can control logging from the Tools menu or from the CommandWindow.You can also determine the status of each logging function:From Tools menu, select Log | Command Input/ Output..., Log |<strong>CrossView</strong>−Emulator I/O... or Log | <strong>CrossView</strong>−GDI Accesses...If a logging function is is active, the Stop button is enabled. If the Startand OK buttons are enabled, logging is off.Enter the >> , >& or >* command in the Command Window.Each type of logging is described in the following section.
Command Recording & Playback9−13The Emulator Output Window is primarily a diagnostic tool. It should beused wisely, since it generates substantial amounts of output, the format ofwhich is emulator dependent. For emulators that have an ASCII interface,the actual command/response dialogue will be displayed. For emulatorswith a binary interface, <strong>CrossView</strong> <strong>Pro</strong> will generate a record of functioncalls with their associated input and output parameters. This also appliesto the GDI Accesses output logging.9.4.1 SETTING UP LOGGINGTo setup logging:From the menu system:• From Tools menu, select Log | Command Input/ Output..., Log| <strong>CrossView</strong>−Emulator I/O... or Log | <strong>CrossView</strong>−GDIAccesses... to open the appropriate dialog box.• Type in the name of the log file or use the Browse... button toselect a filename. The default filename extension is .log.Each Log dialog box has an Automatically at <strong>CrossView</strong> startupcheck box. This check box instructs <strong>CrossView</strong> <strong>Pro</strong> to startrecording the output of a particular window or information streamupon starting up of <strong>CrossView</strong> <strong>Pro</strong>.• Click on the OK button to save the current settings into theinitialization file xvw.ini for following debugging sessions.• Click on the Start button to start logging.You can open up a log file for <strong>CrossView</strong> Command Output by using the>> filename command as in:>>screen.logYou can force flushing by using the >>! filename command as in:>>!screen.logYou can open up a log file for Emulator Output by using the >& filenamecommand as in:>&target.log• • • • • • • •
9−14Chapter 9You can force flushing by using the >&! filename command as in:>&!target.logYou can open up a log file for GDI accesses output logging by using the>* filename command as in:>*gdi.logYou can force flushing by using the >*! filename command as in:>*!gdi.logFUNCTION:COMMAND:Save <strong>CrossView</strong> <strong>Pro</strong> commands and command windowoutput to a file.>>filenameRECORD & PLAYBACKFUNCTION:COMMAND:FUNCTION:COMMAND:FUNCTION:COMMAND:FUNCTION:COMMAND:Force flushing of <strong>CrossView</strong> <strong>Pro</strong> commands andcommand window output to a file.>>!filenameLog target communications.>&filenameForce flushing of target communication logging.>&!filenameLog GDI accesses.>*filename
Command Recording & Playback9−15FUNCTION:COMMAND:Force flushing of GDI accesses logging.>*!filename9.4.2 RECORDING COMMANDS AND LOGGING SCREENOUTPUTIt is possible to have command recording, command output logging andtarget communication logging on at the same time. That is, you can haveone file recording just the <strong>CrossView</strong> <strong>Pro</strong> commands, and another fileconcurrently recording both the commands and the computer responses.Refer to the previous section for information on command record files.Since the Command Window log file contains both your commands andthe computer responses, you cannot use it in playback mode.9.4.3 COMMAND WINDOW LOG FILE EXAMPLEFor example, if you entered the following commands:>>screen.loginitvall aThe output file, screen.log, contains:> initvalinitval = 0> l ano assertions9.4.4 SUSPENDING AND RESUMING OUTPUT LOGYou can resume and suspend the Logging process from the menu or fromthe Command Window:From Tools menu, select Log | Command Input/ Output..., Log |<strong>CrossView</strong>−Emulator I/O... or Log | <strong>CrossView</strong>−GDI Accesses... toselect the appropriate dialog box.• • • • • • • •
9−16Chapter 9To suspend logging:Click on the Suspend button.In the Command Window, use the >>f command for suspending thelogging of the Command Output Window. Type >&f to suspend theEmulator Output Window. Type >*f to suspend GDI accesses logging.After you issue this command, <strong>CrossView</strong> <strong>Pro</strong> does not save all subsequentcommands and their computer responses.To resume logging:Click on the Resume button.In the Command Window, use the >>t command to resume logging theCommand Output Window. Type >&t to resume the Emulator OutputWindow. Type >*t to resume GDI accesses logging. After you issue thiscommand, <strong>CrossView</strong> <strong>Pro</strong> saves all subsequent commands and theircomputer responses.RECORD & PLAYBACKFUNCTION:COMMAND:FUNCTION:COMMAND:FUNCTION:COMMAND:FUNCTION:COMMAND:Suspend output logging (logging is false).>>fResume output logging (logging is true).>>tSuspend target logging (logging is false).>&fResume target logging (logging is true).>&t
Command Recording & Playback9−17FUNCTION:COMMAND:Suspend GDI acesses logging (logging is false).>*fFUNCTION:COMMAND:Resume GDI acesses logging (logging is true).>*t9.4.5 CLOSING THE OUTPUT LOG FILETo close the output file:From Tools menu, select Log | Command Input/ Output..., Log |<strong>CrossView</strong>−Emulator I/O... or Log | <strong>CrossView</strong>−GDI Accesses... toselect the appropriate dialog box. Click on the Stop button to stoplogging.Enter the >>c or >&c command in the Command Window to close theCommand Output and Emulator Output log files. These commands endthe recording for the currently specified output log file.FUNCTION:COMMAND:Close output log file.>>cFUNCTION:COMMAND:Close target log file.>&c• • • • • • • •
9−18Chapter 99.5 STARTUP OPTIONSWhen starting up <strong>CrossView</strong> <strong>Pro</strong> you may immediately start recording orplaying back files. For instance,xfw166 fact −p sessionplays back the commands in the file session. A −P option single−stepsthrough each command, prompting you for a return after each command.You can also start recording:xfw166 fact −r sessionThis command records all your commands (just like the > command) tothe file session, while:xfw166 fact −R sessionlogs your commands and screen output to the file session (just like the >>command).RECORD & PLAYBACKYou can also use the Automatically at <strong>CrossView</strong> startup option in theRecord, Playback, and Log dialogs to immediately start recording, playbackor logging at <strong>CrossView</strong> <strong>Pro</strong> startup.You can also enter record and playback files via EDE. From the <strong>Pro</strong>jectmenu, select <strong>Pro</strong>ject Options... Expand the <strong>CrossView</strong> <strong>Pro</strong> entry andselect Logging. Enter your record and playback filenames.
Command Recording & Playback9−199.6 CROSSVIEW PRO COMMAND HISTORYMECHANISM<strong>CrossView</strong> <strong>Pro</strong> stores the command history in the list box of the CommandWindow.You can select a command from the history list by clicking on it orjumping with the key to the history listing and using the arrowkeys.. The command appears in the edit field of the Command Window.You may edit the command if you want.To execute the command, click on the Execute button.If you do not want to edit the command, double−click on the selectedcommand in the list box to execute the command, or hit the key.• • • • • • • •
RECORD & PLAYBACK9−20Chapter 9
CHAPTERI/O SIMULATION10
I/O SIMULATION10−2Chapter 10CHAPTER10
I/O Simulation10−310.1 INTRODUCTIONThe <strong>CrossView</strong> <strong>Pro</strong> Terminal windows provide an interface to exchangedata with the application on the target. You can use the following I/Osimulation types for this purpose.File I/O (FIO)With File I/O you can connect actions to a probe point. <strong>Pro</strong>be points arebreakpoints that do not update the graphical user interface (GUI) andwhen they are hit, connected actions are performed and executioncontinues. The actions are in this case I/O actions to a file and/or aterminal window.File System Simulation (FSS)With FSS you can use standard stream I/O function calls like printf() inyour source, to test I/O to and from the target system or simulator.Debug Instrument I/O (DIO)If you have a debug instrument that supports it, the debug instrument canperform input and output using GDI callback functions.10.2 I/O STREAMSYou can setup I/O streams with the I/O Simulation Setup dialog. There isvirtually no limit on the number of streams that can be opened or created.Each type of I/O stream (FIO, FSS, DIO) has its own numbering:FIO 0,1,2,...,kFSS 0,1,2,...,mDIO 0,1,2,...,nYou can map multiple streams to one terminal window.For File I/O you can use the ios_ commands to open or close a FIOstream on the command line. Streams can be opened manually or areopened at the first call or operation that accesses a specified I/O stream(for Debug Instrument I/O handling). For FSS the target application canopen streams with fopen() or open() calls and close streams withfclose() or close() calls.• • • • • • • •
10−4Chapter 10Streams can be mapped to a terminal window and/or a file that is NOT theterminal log file. If a stream is mapped to a terminal window and a file theoutput will go to the terminal window and also to the file. In case of inputthe input will be read from the file. The read input will be echoed on theconnected terminal window.I/O streams opened by FSS are closed when end of program is reached orif a program reset occurs. I/O streams opened by <strong>CrossView</strong> <strong>Pro</strong> will berewound. The windows to which the streams are mapped remain open.In the I/O Simulation Setup dialog you can connect an I/O stream to aterminal window before the stream is opened by specifying the streamtype, filename and terminal window name.10.2.1 SETTING UP FILE I/O STREAMSYou can set up an input or output stream. For input you may specifyeither a file or the keyboard, for output either a file or the screen. Eachstream has its own identifying number.You can also specify the format of the stream’s values. The default ischaracter, but you may want to use hexadecimal or octal values whendirecting data to or from a file.To setup a File I/O stream:From the menu system:I/O SIMULATION• From the Settings menu, select I/O Simulation Setup... to openthe I/O Simulation Setup dialog box.• Open the File I/O tab to setup a File I/O stream.• Select the Configure... button. This opens the File I/OConfiguration dialog.• In the <strong>Pro</strong>be point list box, select an existing probe point or pressthe New... button to set a new probe point. The Breakpoints dialogappears.• In the Stream list box, select a stream or press the New... button tocreate a new stream. Select a new stream and click OK.• Enter the Address and Length (in minimum addresable units,MAU) of the memory location you want to read from or write to.• Optionally, enable the Use hexadecimal format check box whenyou want the data to be interpreted as a hexadecimal value.
I/O Simulation10−5• Choose the Direction: Input if the stream must provide input to theapplication, or Output if the stream must be an output stream.• Click on the Apply button to accept the contents and enter anotherconfiguration or click on the OK button to close this dialog box.Enter the ios_open or ios_wopen command in the Command Window toopen a File I/O stream.FUNCTION:COMMAND:Open a File I/O streamios_open ["file"[,[mode][,[r][,$xvw_variable]]]]FUNCTION:COMMAND:Open a File I/O stream and map the stream to aterminal windowios_wopen [["terminal_window"][,$xvw_variable]]Enter the ios_read or ios_write command in the Command Window toread from or write to a File I/O stream.FUNCTION:COMMAND:Read from a File I/O streamios_read {stream | "file"},address,number_of_maus[,x]FUNCTION:COMMAND:Write to a File I/O streamios_write {stream | "file"},address,number_of_maus[,x]To read 1 MAU hexadecimal value from file mydata.dat and store it ataddress 0x100, type:ios_read "mydata.dat",0x100,1,x• • • • • • • •
10−6Chapter 1010.2.2 REDIRECTING I/O STREAMSIn the I/O Simulation Setup dialog you can connnect an I/O stream to aterminal window before the stream is opened or you can redirect anexisting stream to a file and/or terminal window.To redirect an I/O stream to a file and/or terminal window:From the menu system:• From the Settings menu, select I/O Simulation Setup... to openthe I/O Simulation Setup dialog box.• In the Connection tab select the I/O stream you want to changeand select the Redirect... button.• In the Connection Configuration dialog enter a filename and/or aterminal window name.• Click OK to accept the changes and close the dialog.Enter the ios_open or ios_wopen command in the Command Window toopen a File I/O stream.To disconnect an I/O stream from a file and/or terminal window:From the menu system:I/O SIMULATION• From the Settings menu, select I/O Simulation Setup... to openthe I/O Simulation Setup dialog box.• In the Connection tab select the I/O stream you want to changeand select the Redirect... button.• In the Connection Configuration dialog erase the filename and/orterminal window name.• Click OK to accept the changes and close the dialog.Enter the ios_close command in the Command Window to close a FileI/O stream.FUNCTION:COMMAND:Close a File I/O streamios_close {stream | "file"}
I/O Simulation10−7To disable/enable an I/O stream:From the menu system:• From the Settings menu, select I/O Simulation Setup... to openthe I/O Simulation Setup dialog box.• In te Connection tab clear the check box in front of the I/O streamyou want to disable. Set the check box to enable the stream.Disabling a File I/O stream means that I/O actions will not be honored.Writing is not passed to the output file, and reading does not result in newdata being placed in the target buffer.10.3 FILE SYSTEM SIMULATIONFile system simulation enables the application on the target board to usesystem calls (such as open, read, write) that are handled by the hostsystem file I/O services. These files can be read directly from the hostsystem, and output can be written to a file on the host system or in a<strong>CrossView</strong> <strong>Pro</strong> window. File system simulation is available for allexecution environments.The File System Simulation feature redirects I/O to a Terminal Window ifthe filename FSS_window:window_name is used in the "open" call,window_name is the name of a Terminal Window.You can specify a root directory for FSS. <strong>CrossView</strong> <strong>Pro</strong> will search for thefile from the root directory downwards. You can do this in the I/OSimulation Setup dialog, by entering a directory name in the FSS rootdirectory field of the Options tab. This setting is saved in the xvw.inifile. Another possibility is to set a temporary resource by specifying thecommand line option −−fss_root_dir="path" on <strong>CrossView</strong> <strong>Pro</strong> startup.You can redirect File System Simulation streams to a file or another stream.Redirection to a file can be needed when a stream is only mapped to awindow and you want it to be mapped to a file also.Redirection can be used for scripting purposes, using the FSS command.FSS { < | > }{&stream | "file"}• • • • • • • •
10−8Chapter 10For example,FSS 2>&1FSS 1
I/O Simulation10−910.4 DEBUG INSTRUMENT I/OIf you have a debug instrument that supports it, the debug instrument canperform input and output using GDI callback functions. The DebugInstrument I/O (DIO) stream number is passed as parameter to thesecallbacks. The output can be redirected to DDE (Windows only). The firstaccess to a DIO stream will create a new terminal window and the title ofthe window will be "DIO x", where x is is the number of the used stream.No new window will be created if the used stream is already mapped to aterminal window. You can use the I/O Streams Terminal Map dialog tomap one or more streams to one window.• • • • • • • •
10−10Chapter 1010.5 THE TERMINAL WINDOWIf you direct I/O simulation to the screen, <strong>CrossView</strong> <strong>Pro</strong> displays theoutput in the terminal window. Similarly, if you direct input from thekeyboard; whatever you input appears in the appropriate terminalwindow. See section 4.6.8, Terminal Window for more information.10.5.1 TERMINAL WINDOW KEYBOARD MAPPINGSThe following keyboard mappings, being both control codes and escapesequences, are supported by the VT100−like terminal mode of the terminalwindows:I/O SIMULATIONKeyBackspaceTABDELESCCharacter Sequenceand/or Decimal Value8d9d127d27dInsert ESC [ 2 ~Prev/Page Up ESC [ 5 ~Next/Page Down ESC [ 6 ~Arrow UpArrow RightArrow LeftArrow DownESC [ AESC [ BESC [ CESC [ DTable 10−1: General Keyboard Mappings
I/O Simulation10−11Display ControlThe VT100−like terminal mode of the terminal windows comprises thefollowing control codes and escape sequences for displaying:ASCIICodeDecimalValueOperationBELL 7 Ring the bellBS 8 Move cursor one position backTAB 9 Move cursor to next tab stopLF 10 Move cursor one line downCR 13 Move cursor to start of lineESC 27 Start escape sequence (see below)Table 10−2: Control CodesEscape SequencesEscapeSequenceESC DESC EESC MESC [ n1 AESC [ n1 BESC [ n1 CESC [ n1 DESC [ HESC [ n1 ; n2 HOperationCursor one line down (scrolls if already at last line)Cursor one line down and to left margin (scrolls)Cursor one line up (scrolls if already at top line)Cursor n1 lines upCursor n1 characters rightCursor n1 characters leftCursor n1 lines downCursor homeMove cursor to (n1,n2) with n1=row, n2=colTable 10−3: Cursor MotionParameters n1 and/or n2 may be left out, in which case a value of 1 isassumed.• • • • • • • •
10−12Chapter 10EscapeSequenceESC [ JESC [ p1 JESC [ KESC [ p1 KOperationClear screen from cursor till bottom−right0: Clear screen from cursor till bottom−right1: Clear screen from top−left till cursor2: Clear entire screenClear line from cursor till end0: Clear line from cursor till end1: Clear line from begin to cursor2: Clear entire lineTable 10−4: ErasingFor example, to clear the entire screen in the C programming language,you can enter:printf("\033[H\033[2J");fflush(stdout);EscapeSequenceOperationI/O SIMULATIONESC [ n1 @ Insert charactersESC [ n1 P Delete n1 charactersESC [ n1 L Insert n1 linesESC [ n1 M Delete n1 linesTable 10−5: Inserting and DeletingParameter n1 may be left out, in which case a value of 1 is assumed.
I/O Simulation10−13EscapeSequenceOperationESC [ mTurn off all attributesESC [ n1 m 0: turn off all attributes1: bold4: underline5: blinking7: reverse8: invisible22: turn off bold24: turn off underline25: turn off blinking27: turn off reverse28: turn off invisibleTable 10−6: Character AttributesMultiple parameters may be specified simultaneously:ESC [ n1 ; ... ; nN mSome attributes or combinations of attributes are mapped to a regularstandout mode.Parameters may be left out, in which case a value of 0 is assumed.EscapeSequenceESC [ 12 lESC [ 12 hESC [ ? 7 hESC [ ? 7 lESC [ ? 25 hESC [ ? 25 lESC [ ? 92 lOperationLocal echo onLocal echo offWrap around onWrap around offCursor onCursor offEnquire after the window’s sizeResponse:ESC [ ? rows, columns cTable 10−7: Miscellaneous• • • • • • • •
I/O SIMULATION10−14Chapter 10
CHAPTERSPECIAL FEATURES11
11−2Chapter 11SPECIAL FEATURESCHAPTER11
Special Features11−311.1 TRANSPARENCY MODETransparency mode allows you to communicate directly with theexecution environment. Most of the time <strong>CrossView</strong> <strong>Pro</strong> will handle all thelow level communications, freeing you to concentrate on the high level Ccode. Depending on the type of execution environment, however, youmay have to enter transparency mode to set up the execution environmentwhen the machine is first turned on.To enter transparency mode:From the View menu, select Command | Emulator.All commands entered in the Emulator Command Window are passeddirectly to the execution environment.To exit transparency mode:From the View menu, select Command | <strong>CrossView</strong>.In <strong>CrossView</strong> <strong>Pro</strong>, you can pass a string directly to the executionenvironment without leaving <strong>CrossView</strong> <strong>Pro</strong> with the o command:o mapThis passes the command map directly to the execution environment,while you remain in <strong>CrossView</strong> <strong>Pro</strong>. Naturally you will have to learn yourexecution environment’s command set to make use of the o command.FUNCTION:COMMAND:Pass a command to the execution environment.o stringDo not issue one−shot transparency commands that result in large output(or otherwise require intervention other than a carriage return to terminateoutput). Instead, enter transparency mode first, then issue the command.You may also enter transparency mode upon startup with the −T option.See the section on startup options.• • • • • • • •
11−4Chapter 1111.2 RTOS AWARE DEBUGGINGEDE<strong>CrossView</strong> <strong>Pro</strong> supports RTOS (Real−Time Operating System) awaredebugging for various kernels. Since each kernel is different, the RTOSaware features are not implemented in the <strong>CrossView</strong> <strong>Pro</strong> executable, butin a library (RADM: RTOS aware debugging module) that will be loaded atrun−time by <strong>CrossView</strong> <strong>Pro</strong>. The amount of windows and dialogs and theircontents is kernel dependent.<strong>CrossView</strong> <strong>Pro</strong> for the <strong>C166</strong>/<strong>ST10</strong> supports an OSEK RADM(osek_radm.dll) according to the OSEK standard. You have to createyour own OSEK Run Time Interface (ORTI) and specify this file to<strong>CrossView</strong> <strong>Pro</strong>. <strong>CrossView</strong> <strong>Pro</strong> supports ORTI specifications v2.0 and v2.1.From the <strong>Pro</strong>jects menu, select <strong>Pro</strong>ject Options... Expand the<strong>CrossView</strong> <strong>Pro</strong> entry and select RTOS Aware Debugging Module. SelectOSEK and specify the name of the ORTI file, or select User Defined andspecify your RADM DLL name.SPECIAL FEATURES<strong>CrossView</strong> <strong>Pro</strong>Within the <strong>CrossView</strong> <strong>Pro</strong>’s Target Settings dialog (Target |Settings...), select the <strong>CrossView</strong> <strong>Pro</strong> configuration you will use byselecting a "Target configuration". These target configuration files arenormal ASCII text files. The name of the shared library that contains thekernel aware code can be specified in the target configuration. The "radm"configuration item specifies the name of the shared library that containsthe kernel aware code.The syntax of a target configuration file is:field[! comment] field : field−valuefield−valuecommentone of the defined keywordsthe value assigned to the fieldoptional commentEmpty lines, lines consisting of only white space are allowed. Commentsstart at an exclamation−sign (’!’) and end at the end of the line.The line for the shared library that supports RTOS aware code could be:radm: yourrtos.dll
Special Features11−5Or you can specify the RADM filename on the <strong>CrossView</strong> <strong>Pro</strong> commandline with the following option:−−radm=osek_radm.dllYou can specify the ORTI filename on the <strong>CrossView</strong> <strong>Pro</strong> command linewith the following option:−−orti=ORT−filenameThe OSEK RADM adds an OSEK/ORTI menu to <strong>CrossView</strong> <strong>Pro</strong> that hasseveral items (each description in the notation ’’ is represented inthe syntax of the OSEK Run Time Interface file):• OSEK implementation name (if reading of the ORTI file succeeded)The OSEK implementation name is specified with in the of the ORTI file.For each a sub menu item will be created with thename represented for . When selecting an object item awindow will appear with all objects from the forthe specified . The new created window always contains theObject column and then the columns represented in the of the specified object.• Info MessagesThis menu item lists all expressions from the ORTI file that could notbe evaluated. This could be an expression within the represented in the . Howeverevaluating the expressions from the objects in the also could have problems. The problems couldoccur when the expression is to difficult to be evaluated or when oneof the variables of the expression is not available when the symbolicdebug info is loaded.When an expression could not be evaluated it results into ’N.A.’ for thespecified window object entry item. When the expression could beevaluated but the enumerated type could not be found or the specifiedtype could not be converted correctly this will result into ’n.a.’ for thespecified window object entry item.• • • • • • • •
11−6Chapter 11So, there are two situations:n.a. :N.A. :Expression could be evaluated but could not be convertedcorrectly at current moment. This expression will not occur inthe list when the menu item ’Info Message’ is selected.Expression could not be evaluated and will not change untilthe ORTI file is updated with a valid expression.For the second situation you can type the expression in the commandwindow and <strong>CrossView</strong> <strong>Pro</strong> will show a message box with the reasonwhy the expression could not be evaluated.• About RADMThis menu item shows the supported OSEK/ORTI version and theRADM version.11.3 COVERAGEYou can only use this feature if it is supported by the executionenvironment (see the addendum).SPECIAL FEATURESWhen the application program is executed as a result of a command suchas StepInto or Continue, <strong>CrossView</strong> <strong>Pro</strong> traces all memory access, i.e.memory read, memory write and instruction fetch. Through codecoverage, executed and not execute areas of the application program canbe found. Areas of unexecuted code may exist in case of programmingerrors or simply dead code which could be eliminated. Alternatively, yourprogram input or your test set is incomplete. It may not cover all paths inthe program.Data coverage allows you to verify which memory locations, i.e. whichvariables, are accessed during program execution. Additionally, stack andheap usage can be shown.To enable/disable coverage:From the Tools menu, select the Coverage checked menu item.When the menu item is checked, coverage is enabled. Select the menuitem again to disable coverage.Type the ce or cd command on the command line:
Special Features11−7ceFUNCTION:COMMAND:Enable coverage.ceFUNCTION:COMMAND:Disable coverage.cdTwo dialogs are present to give you coverage information. The codecoverage dialog shows the percentage of executed code withinapplication, module and function scope. Code coverage information canalso be displayed in the Source Window. The data coverage dialog showsthe data access of HLL variables in the executed program. Data coveragecan also be displayed in the Memory Window. The coverage dialogs canbe opened via the Tools menu.FUNCTION:COMMAND:List coverage information to output window or file.covinfo [[all | module_or_function_name][,filename]]You can display code coverage information in the Source Window byclicking on the Coverage button in the Source Window. In this case anextra column appears to the right of the breakpoint toggles (to the left ofthe source line). For each source code line that is executed (covered), thesource line is marked. The not executed lines are not marked. <strong>CrossView</strong><strong>Pro</strong> has special commands to move the cursor to the next or previouscovered or uncovered line:FUNCTION:COMMAND:Move cursor to next covered line.nCFUNCTION:COMMAND:Move cursor to next uncovered line.nU• • • • • • • •
11−8Chapter 11FUNCTION:COMMAND:Move cursor to previous covered line.pCFUNCTION:COMMAND:Move cursor to previous uncovered line.pUSPECIAL FEATURESYou can display data coverage information in the Memory Window byclicking on the Code Coverage button in the Memory Window. Besidesthe current value of memory locations, the memory window also displayswhether memory locations have been accessed during program execution.An application program may read from, write to, or fetch an instructionfrom a memory location. Of course all combinations may be legal.Although writing data to a memory location from which an instruction hasbeen fetched is suspicious. All types of accesss, read, write, fetch orcombinations of these, can be shown using different foreground andbackground colors. The color combination used to show "rwx" access arespecified in the Desktop tab of the File | Options... menu item. It isadvised to change the background color if instructions are fetched from amemory location, and to change the foreground color to show read andwrite access.11.4 PROFILINGYou can only use this feature if it is supported by the executionenvironment (see the addendum).<strong>Pro</strong>filing allows you to perform timing analysis on your software. Twoforms of profiling are implemented in <strong>CrossView</strong> <strong>Pro</strong>. Both forms ofprofiling are fully implemented in the <strong>CrossView</strong> <strong>Pro</strong> debugger. You donot have to recompile your source code to enable the profiling features.
Special Features11−911.4.1 FUNCTION PROFILINGFunction profiling, also called cumulative profiling, gives timinginformation about a particular function or set of functions. The time spentin functions called by the function being profiled is included in the timingresults. Within the Cumulative <strong>Pro</strong>filing Setup dialog you select one ormore functions to be profiled. The gathered profile is shown in theCumulative <strong>Pro</strong>filing Report dialog. For each function the number of calls,the minimum/maximum/average and total time spent in the function areshown. Also, the relative amount of time consumed by a function inrespect to the time consumed by the application is shown.Function profile data is gathered whenever the program is executed usingthe Continue command (not single stepped). Function profiling can besupported if the execution environment provides a clock that starts andstops whenever execution starts and stops. Basically function profiling isimplemented by using a special type of breakpoint. Breakpoints areinserted at the function entry address and all it’s return addressed.Whenever execution stops due to a profile−breakpoint hit, <strong>CrossView</strong> <strong>Pro</strong>will read the clock, update the internal profile tables, and restartexecution.To specify the functions to be profiled:From the Tools menu, select Cumulative <strong>Pro</strong>filing Setup...Type the cproinfo command on the command line:cproinfo add mainTo view the profiling results:From the Tools menu, select Cumulative <strong>Pro</strong>filing Report...Type the cproinfo command on the command line:cproinfo• • • • • • • •
11−10Chapter 11FUNCTION:COMMAND:List cumulative profining results to output window orfile, or add or remove functions from the list of profiledfunctions.cproinfo [all[,filename] | {add | remove } function]11.4.2 CODE RANGE PROFILINGCode range profiling presents timing information about a consecutiverange of program instructions. <strong>CrossView</strong> <strong>Pro</strong> displays the time consumedby each statement, C or assembly, in the source window. The timing datacan be displayed in three different formats: absolute, relative to program,and relative to function. To change the display format: position the cursoron the profile column and click the right mouse button. Select theappropriate format from the popup menu.Next to the source window, the profile report dialog (Tools |<strong>Pro</strong>filing Report...) shows the time spent in each function. The timeconsumed by functions called from the function being profiled is notincluded in the displayed time.SPECIAL FEATURESFUNCTION:COMMAND:List profile information to output window or file.proinfo [[all | module_or_function_name][,filename]]Code range profiling data is gathered whenever the program is executed.It does not matter if the program executes due to a continue, step−over orstep−into command. Code range profiling heavily relies on specialprofiling features in the execution environment. Normally code rangeprofiling is only supported by instruction set simulators.To enable/disable profiling:From the Tools menu, select the <strong>Pro</strong>filing checked menu item.When the menu item is checked, code range profiling is enabled. Enabledmeans that the execution environment starts gathering profiling data.Select the menu item again to disable profiling.
Special Features11−11Type the pe or pd command on the command line:peFUNCTION:COMMAND:Enable profiling.peFUNCTION:COMMAND:Disable profiling.pdSelect the <strong>Pro</strong>filing button in the Source Window to display profile datain the Source Window. If profiling is not enabled, this button also startsgathering of profiling data.Normally both function and code range profiling will slow down theexecution speed of the application being debugged. Therefore, switch offprofiling whenever the timing information is not required.11.5 DATA ANALYSIS<strong>CrossView</strong> <strong>Pro</strong> incorporates an advanced signal analysis interface designedto enable developers to monitor signal data more critically and thoroughly.This feature is useful when developing signal processing software forapplication areas such as communication, wireless and image processing.The Data Analysis window (as shown in figure 4−15) is used for thispurpose. This window is opened as result of processing a data analysisscript (CXL script) and is only updated on user request. TASKING providesscripts for standard signal analysis such as x−t plotting, x−y plotting, FFTpower spectrum, FFT waterfall, combined FFT power spectrum and phase,and eye diagram. However, the programmer can write CXL scripts andprocess the data in the format he desires.Refer to the CXL syntax specification in Appendix B, <strong>CrossView</strong> ExtensionLanguage (CXL), for details.• • • • • • • •
11−12Chapter 11Four processes are associated with the graph window:7. Get raw data8. Transform data9. Generate representation10. DrawThe get raw data process retrieves data from the target and stores the dataat the host system in one or more <strong>CrossView</strong> <strong>Pro</strong> internal acquisition databuffers. Since these buffers reside on the host system it is possible tomaintain a history of data.The transform data process takes the raw data as input, processes it, andthe result of the transformation, a set of (x, y) pairs, is saved in theprocessed data buffer associated with a window. Since the transformationsare described in CXL (<strong>CrossView</strong> eXtension Language) the user canprogram the data transformation that is of most interest for him. Forexample, an FFT power spectrum would produce (frequency, power)pairs.SPECIAL FEATURESThe generate representation process takes data from the processed databuffer, (x, y) pairs, as input and generates a display list. This process scalesthe data according to the given display window size. This process is codedin CXL. So, in addition to the scripts provided by TASKING, the user canwrite his own representation processes. For example, an FFT powerspectrum is usually represented by a bar graph.The drawing engine process takes the display list as input and producesthe graph that is displayed in the Data Analysis window. The drawingengine is part of the <strong>CrossView</strong> <strong>Pro</strong> executable and cannot be configuredby the user.A clear separation between data transformation (the transform dataprocess) and data presentation (generate representation process) has beenmade to increase the reusability of complex data presentation scripts.Once the scripts are written (a number of frequently used operations aresupplied), the following three steps must be made in order to display data:1. Set the display mode for the desired window using the graphmcommand. For example,graphm "demo","show_x_t.cxl"
Special Features11−13"demo" will be shown in the title bar of the window. It is also the nameused to refer to the window.2. Retrieve data from the target into a buffer using the memget command.For example,memget ((int []) 0x0)[$i],128,$buffer$i is the "iterator" to walk 128 times through the expression (Note: theretrieved elements are assumed to be equidistantly placed in memory) andstore the results in $buffer.Optionally the buffer contents can be appended to another buffer usingthe bufa command, in order to maintain a (limited) history. For example,bufa $all_data,$buffer,10243. Transform the buffer contents to displayable data using the graphcommand. For example,graph "demo","x_t.cxl",$buffer,0,1For details of the arguments provided to x_t.cxl, see below. Now a usedbuffer can be freed using the bufd command (if the target data is not tobe used anymore).Steps 1. and 2. can be repeated as many times as desired. The displaymode can be changed at any time by issuing a graphm command for thewindow to be changed. Using the graphp command, a window can bepositioned anywhere on the screen.11.5.1 SUPPLIED DATA ANALYSIS WINDOW SCRIPTSThe following scripts and commands are described for completeness.Normally, you will not use the commands directly, because they areautomatically invoked when you click OK in the Data Analysis WindowSetup dialog.For some graphm scripts both x− and y−axis can be user specified. If thelimits are not specified or low >= high, then autoscaling is used.• • • • • • • •
11−14Chapter 11X−T plottingAn x−t plot is the most straightforward way of displaying data. Data istaken from one buffer, each value is taken as the x value and the t value isincreasing linearly. It is displayed as a graph the way it is found in thebuffer (memory). The layout of the scales and the form of the graph (line,bar, dot) can be selected as shown below.1. Generating window data pairs:graph "win_title", "x_t.cxl", $buffer, t_offset, t_incrementgenerates (t, x) pairs: (t_offset + i * t_increment, $buffer[i]). Thegenerated data is attached to the specified window.2. Setting the display mode:graphm "win_title", "show_x_t.cxl" [, low_x, high_x [, low_y, high_y ] ]displays lines drawn between successive coordinates specified by thewindow data pairs.graphm "win_title", "show_cross.cxl" [, low_x, high_x [, low_y, high_y ] ]displays ’x’s at the coordinates specified by the window data pairs.SPECIAL FEATURESgraphm "win_title", "show_plus.cxl" [, low_x, high_x [, low_y, high_y ] ]displays ’+’s at the coordinates specified by the window data pairs.graphm "win_title", "show_bars.cxl" [, low_x, high_x [, low_y, high_y ] ]displays bars at the coordinates specified by the window data pairs.The x−coordinates are expected to be equidistant.X−Y plottingAn x−y plot takes values from two buffers, one from each at a time. Thefirst is interpreted as the x−value, the second as the y−value of a point todisplay. No further processing is done on these values. The most commondisplay mode is ’x’s or ’+’s (show_cross.cxl, show_plus.cxl, seeprevious description) to give a scattergram. The values can also beinterconnected in order (show_x_y.cxl) to create Lissajous−like displays.1. Generating window data pairs:graph "win_title", "x_y.cxl", $x_buffer, $y_buffer
Special Features11−152. Setting the display mode:graphm "win_title", "show_x_y.cxl" [, low_x, high_x [, low_y, high_y ] ]draws lines from all (x[i], y[i]) to (x[i+1], y[i+1]). Whenautoscaling is active, some space is reserved on both x− and y−axis.FFT power spectrumThe FFT power spectrum plot takes a buffer of arbitrary size to computethe power of all frequencies present in the signal (in decibels). If thebuffer size is not a power of two, it will expand its input set to the nexthigher power and augment it with zeroes. To handle non−recurrent datacorrectly, several window functions can be applied in the process. If noreference level is given the maximum level is calculated and set to be 0dB. The usual display mode is bars, although all x−t display methods canbe used. The horizontal axis is in frequency steps, the vertical axis indecibels.1. Generating window data pairs:graph "win_title", "fft.cxl", $buffer, filter_index, frequency_step[,ref_level]generates pairs ( i * frequency_step, log_power[i] ). The filter_indexspecifies one of the following FFT windowing functions:0 rectangular1 triangular2 Hanning3 Blackman−Harrisref_level is the 0 dB reference level.2. For displaying the generated pairs, any of the x−t plotting display scriptscan be used. "show_bars.cxl" is recommended.Multi FFT power spectrum ("waterfall")The multi FFT power spectrum displays a chronilogical series of FFTpower spectra. This diagram is also known as FFT waterfall. The FFTpower spectrum plot takes a buffer of arbitrary size and splits it up in anumber of frames of size 2 two_exp . You can specify the overlap betweensuccessive frames. The overlap can be negative indicating gaps betweensuccessive frames. For each frame, the power (in decibels) of allfrequencies present in the signal is computed.• • • • • • • •
11−16Chapter 111. Generating window data pairs:graph "win_title", "multi_fft.cxl", $buffer, filter_index, frequency_step,two_exp[,overlap[,ref_level]]generates pairs ( i * frequency_step, log_power[i] ). The filter_indexspecifies one of the following FFT windowing functions:0 rectangular1 triangular2 Hanning3 Blackman−Harris2 two_exp is the width of one single frame in number of input samples.two_exp must be a value between 2 and 14 (inclusive). If the inputbuffer does not contain enough samples to fill the last frame, the frameis completed with zeros.overlapSPECIAL FEATURESinput bufferF1F2F32 two_expF4the rest of frame F4will contain zerosoverlap is the number points shared by successive frames. Whennegative, a ’gap’ will occur between processed points. The first sampletaken from the input buffer of frame N is equal to the first sample offrame N + 2 two_exp − overlap. overlap must be smaller than 2 two_exp .ref_level is the 0 dB reference level.2. For displaying the generated pairs, the display script"show_multi_bars.cxl" is required.Multi FFT power spectrum in linesDisplays the same multi FFT power spectrum, but now in lines instead ofbars. Here a 3D graph is shown. The script name isshow_multi_lines.cxl.
Special Features11−17Multi FFT power spectrum in lines and gridDisplays the same multi FFT power spectrum as the multi lines spectrum..Now each point on a curve is interconnected with a point with the samex−coordinate of the previous graph. What you see here is a ’grid’ with thevalues. The script name is show_multi_grid.cxl.Use of colors in Multi FFT power spectrumFor all three graphm scripts show_multi_bars.cxl,show_multi_lines.cxl and show_multi_grid.cxl an optional thirdparameter can be added to set the color offset value. This allows you tocreate a dynamic display in which the color of each curve remains thesame. The color offset can range from 0 to the maximum number ofcolors, and the maximum number of colors is the number of curves to beplotted. When the color offset exceeds the number of colors, the modulowill be taken; if it is negative it will be set to zero. The colors selected forthe curves are spread evenly over the color spectrum. The number ofcolors can also be set as an (optional) fourth parameter of the script.An example of a command file for a running script can be:/* INITIALIZE */rst /* Rerun the program when the script is executed */$fast_mode=2 /* If on the simulator, go to fast mode */s /* Step to the main() routine to allow access *//* to the output[] array. */memget output[$i],256,$t /* It’s clear now. */bufa $f,$t,4096 /* Construct an empty time domain history */bufa $f,$t,4096bufa $f,$t,4096bufa $f,$t,4096bufa $f,$t,4096bufa $f,$t,4096bufa $f,$t,4096bufa $f,$t,4096$color=0 /* Initialize the $color variable to track the graphs *//* DEFINE THE TIME DOMAIN WINDOW */graphp "Output time domain",50,25,716,295 /* set window position */graphm "Output time domain","show_x_t.cxl" /* set draw method */graph "Output time domain","x_t.cxl",$t,0,1/* use the ’t’ buffer */graph_clear_updates "Output time domain"/* Set ’Output time domain’ window update actions: */graph_add_update "Output time domain",memget output[$i],256,$t/* Get new time domain data from output[] into $t buffer */graph_add_update "Output time domain",graph "Output timedomain","x_t.cxl",$t,0,1/* This command recalculates and redraws the window */• • • • • • • •
11−18Chapter 11/* DEFINE THE FREQUENCY DOMAIN WINDOW */graphp "Output freq domain",50,350,716,295/* set window position */graphmn "Output freq domain","show_multi_grid.cxl",−120,5,($color)/* set draw method */graph "Output freq domain","multi_fft.cxl",$f,0,1,256/* use the ’f’ buffer */graph_clear_updates "Output freq domain"/* Set ’Output freq domain’ window update actions: */graph_add_update "Output freq domain", bufa $f,$t,4096/* Add new data to buffer, max size 4096 (purging oldest) */graph_add_update "Output freq domain", $color = ($color+1) % 16/* 4096/256 = 16 graphs, increment color offset to follow */graph_add_update "Output freq domain", graphmn "Output freqdomain","show_multi_grid.cxl",−120,5,($color)/* Use the graphmn command to avoid double redraws *//* Place $color in braces to avoid confusion with buffers */graph_add_update "Output freq domain",graph "Output freqdomain","multi_fft.cxl",$f,0,1,256/* This command recalculates and redraws the window *//* PLACE COMPLEX BREAKPOINT, HAVE IT UPDATE THE GRAPHICAL DATAWINDOWS */main#141 bi { update! "Output time domain"; update! "Output freqdomain"; C }SPECIAL FEATURES/* CONTINUE RUNNING THE PROGRAM */CFor passing the parameter $color, the command interpreter requiresparentheses around it, otherwise it is interpreted as a buffer.Combined FFT power spectrum and phaseThe combined FFT power spectrum and phase plot adds a display of thephase of each component to the FFT power spectrum. The phase isnormalized between −180 degrees and +180 degrees. To display bothfeatures of the input data a special display script must be used(show_fft_pairs.cxl).1. Generating window data pairs:graph "win_title", "fft_pairs.cxl", $buffer, filter_index, freq_step[,ref_level]The filter_index specifies one of the following FFT windowingfunctions:0 rectangular1 triangular2 Hanning3 Blackman−Harris
Special Features11−19ref_level is the 0 dB reference level.2. Setting the display mode:For displaying the generated display list, the display script"show_fft_pairs.cxl" is required.graphm "win_title", "show_fft_pairs.cxl" [, min_power, max_power ]Eye diagramThe eye diagram is a recurrent x−t plot. The input data is not processed,but the time parameter is reset when the signal crosses the trigger level,and also after a specified interval (wrap_limit). After crossing trigger_level,retriggering is suppressed during the trigger_hold_off next data values. Theeye diagram uses the X−t plot method and exploits the feature ofsuppressing the fly−back of the displayed line.1. Generating window data pairs:graph "win_title", "eye.cxl", $buffer, wrap_limit [,t_increment [, t_offset[, trigger_level [, trigger_hold_off]]]]2. Setting the display mode:graphm "win_title", "show_x_t.cxl" [, low_x, high_x [, low_y, high_y ] ]displays lines drawn between successive coordinates specified by thewindow data. If x[i+1] < x[i] (going back in time), no line isdrawn from (x[i], y[i]) to (x[i+1], y[i+1]), which can beregarded as the fly−back suppression in an oscilloscope.11.6 PROGRAM A FLASH DEVICEWith <strong>CrossView</strong> <strong>Pro</strong> you can download an application file to FLASHmemory. Before you download the file, you must specify the type ofFLASH devices you use in your system and the address range(s) used bythese devices.• • • • • • • •
11−20Chapter 11There are two ways you can program a FLASH device. <strong>CrossView</strong> <strong>Pro</strong> canprogram the FLASH device through target memory read/write accesses(host−target communication), or alternatively <strong>CrossView</strong> <strong>Pro</strong> can downloada FLASH programming monitor to the target to execute the FLASHprogramming algorithm (target−target communication). The secondmethod is faster, however you use temporary target memory to store theFLASH programming monitor and you have to specify a temporary dataworkspace for interaction between <strong>CrossView</strong> <strong>Pro</strong> and the FLASHprogramming monitor.Most flash devices require a sequence of memory accesses to set thedevice in programming mode. These accesses must occur in a given timeinterval. So, if the interface between <strong>CrossView</strong> <strong>Pro</strong> and the target is ratherslow (for example an RS−232 interface) you can better choose todownload a FLASH programming monitor (do not use target memoryaccesses).The Use target memory accesses to program flash devices check boxin the Flash Setup dialog specifies the type of access to the FLASH device.To setup a FLASH deviceFrom EDE:SPECIAL FEATURES1. From the <strong>Pro</strong>ject menu, select <strong>Pro</strong>ject Options...The <strong>Pro</strong>ject Options dialog appears.2. Expand the Application | FLASH Setup entry.3. Specify On−Chip Flash or specify an External Flash Chip.From <strong>CrossView</strong> <strong>Pro</strong>:1. From the Target menu, select FLASH Setup...The FLASH Setup dialog appears.2. Click Add... to specify a FLASH device.The Add FLASH Device dialog appears.3. In the Device type box, double−click on the name of the manufacturerof the device.4. Select a flash device.
Special Features11−215. Click on the Base address edit field and enter the start address of thememory range that will be covered by the FLASH device.6. In the Chip width field select the width of the FLASH device.7. In the Number of chips field, enter the number of FLASH devices thatare located in parallel. For example, if you have two 8−bit devices inparallel attached to a 16−bit data bus, enter 2.8. Click OK.The FLASH Setup dialog appears again and the new device is shown inthe list.9. Specify the data workspace address used by the FLASH programmingmonitor. This address may not conflict with the addresses of the FLASHdevices.10. Click OK.The FLASH device is now known to <strong>CrossView</strong> <strong>Pro</strong>.Type the fa and fw commands on the command line, for example:fa AM29F040,0xFFE00000,8,2fw 0x10000FUNCTION:COMMAND:Add a FLASH devicefa device_name,base_address,chip_width[,nr_of_chips]FUNCTION:COMMAND:Specify FLASH programming monitor workspacefw [address]To flash an application file1. From the File menu, select Load Symbolic Debug Info... orDownload Application...The Load Symbolic Debug Info dialog or Download Application dialogappears.• • • • • • • •
SPECIAL FEATURES11−22Chapter 112. Specify the name of the application you want to debug/download andflash into a FLASH device.3. Select Enable flash if you want to start the flash programming whenyou click Load.4. Click Load.<strong>CrossView</strong> <strong>Pro</strong> downloads the application file and flash programmingstarts.
Special Features11−2311.7 BACKGROUND MODEBackground mode is a feature for running the application under debugand <strong>CrossView</strong> <strong>Pro</strong> at the same time. This allows you to monitor the targetapplication using <strong>CrossView</strong> <strong>Pro</strong>, while the application is running.Depending on the target hardware and/or debug instrument connected to<strong>CrossView</strong> <strong>Pro</strong>, target execution can even be real−time.Since <strong>CrossView</strong> <strong>Pro</strong>’s monitoring of the target hardware must benon−intrusive, not all functions of the debugger are enabled while runningin background mode.You can only use this feature if it is supported by the executionenvironment (see the addendum).11.7.1 CONFIGURATION<strong>CrossView</strong> <strong>Pro</strong> can be instructed to automatically refresh one or morewindows of the debugger periodically while running in background mode.You can use the Background Mode Setup dialog for specifying the desiredset of windows to be refreshed.From the Settings menu, select Background Mode Setup... to open theBackground Mode Setup dialog.A distinction has been made between updating the Source lines windowand updating the Disassembly window. Updating the Disassembly windowmay be to time−consuming, so you may want to disable its updating inBackground mode, while still keeping the Source lines windowup−to−date when that is displayed on screen.Use the u command to toggle the updating of windows in backgroundmode.FUNCTION:COMMAND:Toggle update of window in background mode.[interval] u [d|k|r|cd|ck|cr|s|a|mem|t]• • • • • • • •
11−24Chapter 11The following windows can be updated in background mode:d (Data), k (Stack), r (Register),s (Source), a (Assembly), mem (Memory), t (Trace)Initially only the data window will be updated. <strong>CrossView</strong> <strong>Pro</strong> repeatedlylooks at the execution environment to react on changes. Itpseudo−simultaneously looks for user commands from the keyboard (orfrom the playback file), and periodically it updates the windows.If all windows would be updated the update frequency would drop. Thatis why you can toggle a switch for each window. To toggle the updatingof the register window, you can type:xvw% u rIf the switch for a window is ’on’, it will be updated, otherwise it will beskipped.You can also specify a new update interval.Without arguments, <strong>CrossView</strong> <strong>Pro</strong> displays all windows updatedperiodically plus the update interval.SPECIAL FEATURESNotice that simulated I/O is done through ’invisible’ breakpoints, and thesemust be handled inside the loop. Hence, if updating the windows takes alot of time (many monitor commands), it will also slow down simulatedI/O.11.7.2 MANUAL REFRESHIf you have windows which you do not want to refresh periodically, youcan disable them in the Background Mode Setup dialog’s refresh list, andrefresh these windows manually.From the View menu, select Background Mode and select one of therefresh options.Use the ubgw command.
Special Features11−25FUNCTION: Update the appropriate window when the target runs inthe background.COMMAND: ubgw [ s | a | k | r | d | mem | t | all ]]Section Refresh Limitation in this chapter.11.7.3 ENTERING BACKGROUND MODETo run a program in background mode:From the Run menu, select Background Mode | Run in BackgroundType the CB command on the command line.FUNCTION:COMMAND:Run a program in background mode.[count] CB [linenumber]This will start the application under debug to run continuously (as withthe C command), and switch <strong>CrossView</strong> <strong>Pro</strong> from Halted to BackgroundMode. count is assigned to the breakpoint at the current executionposition as the number of times to hit this breakpoint before execution tostop. linenumber specifies the source line to place a temporarybreakpoint.The mouse pointer changes to an arrow with a small watch faceunderneath. This indicates that <strong>CrossView</strong> <strong>Pro</strong> is now in backgroundmode. Some commands are treated a little different in this mode, becausethey can otherwise influence the running program badly. Commands thatneed information from the stack (like bU, bu, bb or bB) are not allowedbecause that information is not reliable. Other commands require greatcare, for example the o command.For example if you type the g while in background mode you will see:xvw% g 56Command "g" is not allowed while the emulator isrunning in background.• • • • • • • •
11−26Chapter 1111.7.4 LEAVING BACKGROUND MODEYou can leave Background Mode in three ways:1. Stop the target immediately:From the Run menu, select Background Mode | Halt TargetEnter the st command:xvw% st2. Let <strong>CrossView</strong> wait for the target to stop:From the Run menu, select Background Mode | Wait for Target to StopTo wait for a breakpoint, you can use the wt command:xvw% wt3. A program running in background mode also stops when it encounters abreakpoint.SPECIAL FEATURESFUNCTION:COMMAND:Stop a program in background mode.stThe wt command behaves just as if you have typed the C command.<strong>CrossView</strong> <strong>Pro</strong> returns with a prompt, after the program hits a breakpoint.However, there is an interesting difference with the C command. If youpush the Halt button, it returns with the background prompt. Theprogram that runs in the execution environment continues withoutinterruption.FUNCTION:COMMAND:Wait for the running process to stopwt
Special Features11−2711.7.5 THE STACK IN BACKGROUND MODEWhile the execution environment runs in background, <strong>CrossView</strong> <strong>Pro</strong> doesnot allow the use of information that comes from the stack. The reason isthat the running program must be stopped in order to get consistentinformation from the stack. Stopping (and afterwards continuing) theprogram conflicts with the "realtime" nature of the background mode.If there is a need for it, you can make a macro that performs the desiredoperations.11.7.6 LOCAL AND GLOBAL VARIABLESIn background mode you can continuously monitor variables. However,realize that local variables (in <strong>CrossView</strong> <strong>Pro</strong> variables are called ’local’ ifthey reside on the stack) cannot be monitored. Instead you will see"unknown name". Global variables have a fixed address, so <strong>CrossView</strong> <strong>Pro</strong>knows where to get their contents from.If you are very anxious to see local variables you can first get an addressand then use that address to monitor the contents. For example:$adr_sum = &summ *(adr_sum)/x4In this example sum is a long (4 bytes). You must be sure that sumremains at that address while the program is running.The values you get this way are only valid under specific conditions. Localvariables from the function main normally meet these conditions.11.7.7 REFRESH LIMITATIONWhile running the application in the background mode, the automaticrefresh functionality may not be able to keep up with all the debugginginformation produced by the running target. Typically, the collectedinformation will be correctly displayed and automatically updated in thecurrent open views and no information will be lost. You might lose thedebugging information when scrolling these views during the backgroundmode. The reason is that either <strong>CrossView</strong> <strong>Pro</strong> does not run fast enough orthe communication with the target hardware is not handled fast enough bythe operating system.• • • • • • • •
SPECIAL FEATURES11−28Chapter 11The information that cannot be processed by <strong>CrossView</strong> <strong>Pro</strong> within thespecified update interval, is displayed as either ’’ or dashes.The way the lost information is displayed depends on the internalcommunication level within <strong>CrossView</strong> <strong>Pro</strong> where the information is lost.Information lost during communication with the target hardware isdisplayed as ’’. Information lost by <strong>CrossView</strong> <strong>Pro</strong> whileprocessing and interpreting this information, is displayed as dashes.On the next automatic or manual update, all debugging information in thecurrently open views is automatically updated. All visible ’’values and dashes are replaced with their actual values as produced by therunning target.11.7.8 ASSERTIONS<strong>CrossView</strong> <strong>Pro</strong> automatically suspends assertions with the CB command.
CHAPTERDEBUGGING NOTES12
12−2Chapter 12DEBUGGING NOTESCHAPTER12
Debugging Notes12−3Here are a few notes about debugging in special situations:12.1 DEBUGGING ASSEMBLY LANGUAGEJust as with C sources, you can debug assembly language programs ormodules. The s, S and si commands single step through the assemblysource. You may place code breakpoints on assembly languageinstructions with the bi command.For additional information on debugging assembly code, see $autosrc,$mixedasm and $symbols in the Reserved Special Variables table insection 3.4.There is a restriction on debugging assembly language code:• Assembly language subroutines cannot be called from the commandline.12.2 DEBUGGING MULTIPLE PROGRAMSYou probably have only one linked and located absolute object file thatdescribes the whole system load. However, for various reasons, you maywant to build your system load by linking and locating into several files.The debugger can handle the symbols from only one load module in oneabsolute object file at a time. Consequently, if there are several absolutefiles or several load modules within one absolute file, you will have tochange the context from one to another explicitly. Use the N command orthe Load Symbolic Debug Info dialog to load the appropriate symbols.This does not disturb the state of the target system.You can also download the image part of another absolute object file(using the dn command), without leaving the debugger.• • • • • • • •
DEBUGGING NOTES12−4Chapter 12
CHAPTERCOMMANDREFERENCE13
REFERENCE13−2Chapter 13CHAPTER13
Command Reference13−3This chapter contains a summary of all <strong>CrossView</strong> <strong>Pro</strong> commands,followed by a complete description of each command.13.1 CONVENTIONS USED IN THIS CHAPTEREach <strong>CrossView</strong> <strong>Pro</strong> command has a particular syntax, that is, the form itmust take for <strong>CrossView</strong> <strong>Pro</strong> to recognize it. To help you learn the syntaxof each command, this chapter uses a special notation to describe thesyntax of each command. Consider the following example:ios_read {stream | "file"},address,number_of_maus[,x]Command items in bold font are the actual command keywords typedfrom the keyboard. In the example above, ios_read is in bold font sinceyou must type it exactly as shown.Items in italics are names of the command part. Here stream is in italics,since you must substitute the appropriate value for stream. TheDescription section for each command describes what kinds of valuesshould be substituted for italicized terms.Expressions in [brackets] are optional items you may include in a particularcommand. In this example ,x is not necessary for the ios_read commandto work. Usually if you omit an optional expression, <strong>CrossView</strong> <strong>Pro</strong> uses adefault value.The | symbol means or. For instance, {stream | "file"} means a streamnumber or a filename between double−quotes (but not both) can be usedin the command.• • • • • • • •
13−4Chapter 1313.2 COMMANDS: SUMMARY13.2.1 VIEWING COMMANDS^[format]expDisplay contents of preceding memory location.Print value of expression using /n format.exp @ formatPrint address of expression exp in format format.exp/format Print value of expression exp in format format.lineclearnumber ctMove viewing position to line line.Clear the Command Output Window.Display a source−level trace corresponding to the lastnumber of machine instructions executed. This command isnot available for all execution environments.number ct i Display a disassembled assembly−level trace correspondingto the last number of machine instructions executed. Thiscommand is not available for all execution environments.number ct r Display a raw trace corresponding to the last number of traceframes. This command is not available for all executionenvironments.e [func | file]Enter function func or file file or view current viewingposition.REFERENCEstack e[addr] eiEnter function using stack address.View current viewing position or view instruction at addressaddr.f ["printf−style−format"]Change default address display format.gus {on|off}Suppress or reactivate <strong>CrossView</strong> <strong>Pro</strong> window updating.LSynchronize the viewing position with the executionposition. Print current file, function and line number.
Command Reference13−5l {a|b|d|f|g|k|l|L|m|p|r|s|S} [string]List assertions, breakpoints, directories, files, globals, kernelstate data, labels (on module scope), all Labels, memory map(of application code sections), procedures, registers, specialvariables, Symbol tables. If given, only those starting withstring.l [func]l stacknCnUList all parameters and locals of function func. Without afunction, this command lists all parameters and locals of thecurrent function in view.List all parameters and locals of function at depth stack.Move viewing position to next covered line.Move viewing position to next uncovered line.opt [option [= value]]List or set option value. Without an argument, list all optionvalues.[line] P [exp] Print exp lines of source starting at line line, include machineaddresses.[line] p [exp] Print exp lines of source starting at line line.pCpU[exp] T[exp] ttdteMove viewing position to previous covered line.Move viewing position to previous uncovered line.Trace the stack for exp number of levels, list local variables.Trace the stack for exp number of levels, printing activefunctions and parameters passed.Disable tracing.Enable tracing.13.2.2 CODE AND DATA MONITORINGcdceDisable, turn off, gathering of coverage information.Enable, turn on, gathering of coverage information.• • • • • • • •
13−6Chapter 13covinfo [[all | module_or_function_name][,filename]]List coverage info.cproinfo [all[,filename] | {add | remove } function]List cumulative profiling info or add or remove functionsfrom the list of profiled functions.dis address [, {address|#count} [,i]]Disassemble a range of memory.dump address [, [address|#count] [, [style [width]] [, filename [,a]]]Dump a memory range.Mm expnum m dDisplay list of monitored expressions in the Commandwindow.Monitor the expression exp.Remove monitored expression labeled num.addr_start mcp addr_end, addr_destMemory copy.addr mF exp[,exp]...Single fill memory address addr with expressions.addr_start mf addr_end, exp[,exp]...Fill memory address range with expressions and repeat thepattern until the end address of the memory region isreached.addr_start ms addr_end, exp[,exp]...Search memory address range for a given pattern.REFERENCEpdpeDisable, turn off, profiling.Enable, turn on, profiling.proinfo [[all | module_or_function_name][,filename]]List profiling info.
Command Reference13−713.2.3 DATA ANALYSISbufa target_buffer_name,added_buffer_name[,size_limit]Add the contents of buffer added_buffer_name to buffertarget_buffer_name.bufd buffer_nameDiscard the specified buffer.graph "window","script"[,arg]...Create Data Analysis window and execute CXL script.graphm "window","script"[,arg]...Set the representation script for the window specified.graphmn "window","script"[,arg]...Similar to the graphm command, but without an update ofthe graph window.graphp "window",left_top_x,left_top_y,width,heightPosition the named window at the specified screencoordinates.graph_add_update "window",commandAdd command to the sequence of update commands for thespecified window.graph_clear_updates "window"Clear the update commands associated with the specifiedwindow.graph_close "window"Close the specified window.graph_debug expressionEnable the "graphical data window debugging mode",showing all communication between the scripts and thewindows in the command window.memget expr,count,buffernameRetrieve symbolically specified data from the target systemand store the data in the acquisition buffer.rawmemget address,type,count,buffername [,interleave]Retrieve data from the target system and store the data in theacquisition buffer.• • • • • • • •
13−8Chapter 13update "window"Update the window specified.13.2.4 EXECUTION CONTROL COMMANDSA [a|s]a cmdsToggle state of assertion mechanism.Create a new assertion with the command list cmds.exp a {a|d|s}Activate, delete, suspend assertion exp.BList all breakpoints.[line] b [cmds]Set breakpoint at source line line, and associate command listcmds with breakpoint.[stack] bB [cmds]Set temporary breakpoint at beginning of function at stacklevel stack and associate command list cmds.[stack] bb [cmds]Set breakpoint at beginning of function at stack level stackand associate command list cmds.[number] bc [count] [reset_count]Set breakpoint count and reset_count for breakpoint withnumber number.REFERENCEcount bCYC [cmds]Set temporary breakpoint after the specified cycle count andassociate command list cmds.count bcyc [cmds]Set breakpoint after the specified cycle count and associatecommand list cmds.exp bD {r|w|b} exp2 [cmds]Set a data range breakpoint (between addresses exp andexp2) read (r), write (w) or both read and write (b), andassociate command list cmds. This command is not availablefor all execution environments.
Command Reference13−9exp bd {r|w|b} [cmds]Set a data breakpoint, read (r), write (w) or both read andwrite (b) at address exp, and associate command list cmds.This command is not available for all executionenvironments.num bdisnum benaDisable code breakpoint.Enable code breakpoint.[addr] bI [cmds]Set temporary breakpoint at machine instruction andassociate command list cmds.[addr] bi [cmds]Set breakpoint at machine instruction and associate commandlist cmds.count bINST [cmds]Set temporary breakpoint after count machine instructionsand associate command list cmds.count binst [cmds]Set breakpoint after count machine instructions and associatecommand list cmds.break [type] where [, option]...Universal breakpoint command. Several types of breakpointsare available. The meaning of where depends on the selectedtype. Breakpoint options must be separated by commas.time bTIM [cmds]Set temporary breakpoint after time number of seconds andassociate command list cmds.time btim [cmds]Set breakpoint after time number of seconds and associatecommand list cmds.[stack] bU [cmds]Set a temporary up−level breakpoint at stack level stack andassociate command list cmds.[stack] bu [cmds]Set up−level breakpoint at stack level stack and associatecommand list cmds.• • • • • • • •
13−10Chapter 13[exp] C [line] Continue execution from current value of program counter. Ifline is specified, execution continues up to that line.Breakpoint’s count is set to exp.[exp] CB [line]Continue execution in background from current value ofprogram counter. If line is specified, execution continues upto that line. Breakpoint’s count is set to exp.This command is not available for all executionenvironments.cxl "script"Execute a CXL script.cxl_reset ["script"]Reset all variables of all CXL scripts or of a specific CXLscript.DDy[number] dcpu eC[cpu] ecg lineaddress giDelete all breakpoints.Delete all breakpoints without prompt for confirmation.Delete breakpoint number.Start execution on the current CPU and switch to cpu.Select CPU or show current CPU number.Go to the specified line in the current procedure.Go to the specified adrress.REFERENCEif (exp) {cmds} [{cmds}]Conditionally execute commands.prstQq [y]q sRrst[exp] SReset program counter.Report breakpoint quietly.Quit debugger (do not save desktop settings).Save current desktop settings and quit debugger.Reset program counter and start execution.Reset target system to initial conditions.Single step for exp lines, step over function calls.
Command Reference13−11[exp] s[exp] Si[exp] sistSingle step for exp lines, step into function calls.Single machine step for exp machine instructions, step oversubroutine calls.Single machine step for exp machine instructions, step intosubroutine calls.Stop the execution of the target immediately.This command is not available for all executionenvironments.[interval] u [d|k|r|s|a|mem|t]Toggle updating of the appropriate window when the targetruns in the background. You can specify the update interval,in seconds. If interval is zero, never update automatically.This command is not available for all executionenvironments.ubgw [s|a|k|r|d|mem|t|all]Refresh the appropriate window, or all open windows, whenthe target runs in the background. This command is notavailable for all execution environments.use [path]...wt[exp] xClear source directory search path or use the specified pathto search for source files.Wait for the completion of the target.This command is not available for all executionenvironments.Force an exit from assertion mode. If exp is non−zero, finishexecuting command list of the current assertion.13.2.5 RECORD & PLAYBACK
13−12Chapter 13> Report status of command recording mechanism.>#file>#{t|f|c}>@file>@{t|f|c}>>file>>{t|f|c}Record emulator commands in file.Set emulator recording file status, true (t), false (f) or closed(c)Record <strong>CrossView</strong> <strong>Pro</strong> and emulator commands in file.Set <strong>CrossView</strong> <strong>Pro</strong>/emulator recording file status, true (t),false (f) or closed (c)Log commands and screen output in file.Set logging file status, true (t), false (f) or closed (c)>> Report status of command and screen output loggingmechanism.>&file>&{t|f|c}>&>*file>*{t|f|c}Log host−to−target communication in file. Not available for allexecution environments.Turn target communication logging on (t), off (f) or close (c)log file. Not available for all execution environments.Report status of target communication logging mechanism.Not available for all execution environments.Log GDI accesses in file.Set GDI accesses log file status, true (t), false (f) or closed (c)REFERENCE13.2.6 MACROSecho string Display macro expansion of string.save filesetSave current macros to file.Display all macros.set macro "cmds"Define macro macro as command list cmds.unsetDelete all macros.
Command Reference13−13unset macro!Delete definition of macro macro.macro!Prevent expansion of macro.13.2.7 INPUT/OUTPUT SIMULATIONios_open ["file"[,[mode][,[r][,$xvw_variable]]]]Open a <strong>CrossView</strong> <strong>Pro</strong> File I/O stream.ios_wopen [["terminal_window"][,$xvw_variable]]Open a <strong>CrossView</strong> <strong>Pro</strong> File I/O stream an map the stream toa terminal window.ios_close {stream | "file"}Close a <strong>CrossView</strong> <strong>Pro</strong> File I/O stream.ios_read {stream | "file"},address,number_of_maus[,x]Read binary data from a File I/O stream. Optionally, interpretthe read data as hexadecimal values.ios_readf {stream | "file"},"format",expressionFormatted read from a File I/O stream (scanf).ios_write {stream | "file"},address,number_of_maus[,x]Write binary data to a File I/O stream. Optionally, interpretthe data as hexadecimal values.ios_writef {stream | "file"},"format",expressionFormatted write to a File I/O stream (printf).ios_rewind {stream | "file"}Move File I/O file pointer to the beginning of the file.• • • • • • • •
13−14Chapter 1313.2.8 FILE SYSTEM SIMULATIONFSS { < | > }{&stream | "file"}Redirect to or from a stream or file.FSS_stdio_open filename,rwdirection,streamnumberRedirect the output of a stream to a file.FSS_stdio_close streamnumberClose the specified stream.13.2.9 TARGET SYSTEM CONTROLdcmp [file[,[number_of_hits][,d]]Compare an application file with the memory contents anddisplay differences.dndn fileDownload the image part of the current absolute file,specified when <strong>CrossView</strong> <strong>Pro</strong> was invoked or loaded withthe N command.Download the image part of the absolute file file.fa device_name,base_address,chip_width[,nr_of_chips]Add FLASH device to list of configured FLASH devices.fc device_numberCheck the manufacturer and device identifiers of a FLASHdevice.REFERENCEfd device_numberDelete FLASH device.flList FLASH devices.fp device_numberGet protection status of a FLASH device.fpe device_number<strong>Pro</strong>tect FLASH device.fpd device_numberUnprotect FLASH device.
Command Reference13−15fw [address]load [file]N [file]n [addr]o [cmd]Specify workspace address of FLASH programming monitor.Load symbol table of file in <strong>CrossView</strong> <strong>Pro</strong> and download theimage part to the target. This is a combination of N and dn.Load symbol table of file in <strong>CrossView</strong> <strong>Pro</strong>.Set code address bias (for overlays) to addr. If no address isgiven, then display the current bias.Enter transparency mode (exit with ctrl−D). If cmd is present,pass cmd to the execution environment. Not available for allexecution environments.! [command−line]Execute shell command command−line or invoke new shell.13.2.10 SAVE AND RESTORE TARGET STATEThis feature is only available when it is supported by the debuginstrument.di_state open state_nameOpen the state with the specified state_name.di_state save state_name, numberSave the state of the debug instrument with the specifiedstate_name and number.di_state restore state_name, numberRestore the state of the debug instrument with the specifiedstate_name and number.di_state close state_name, deleteClose the state with the specified state_name. delete can be 1to delete the state or use 0 to keep the state.13.2.11 HELP COMMANDSIPrint information about debugger state.• • • • • • • •
REFERENCE13−16Chapter 1313.2.12 SEARCH COMMANDSZ/[string]?[string]"string"Toggle case sensitivity in searches.Search forwards in source file for string. If string is notpresent, perform previous search again.Search backwards in source file for string. If string is notpresent, perform previous search again.Print string.13.3 COMMANDS: DETAILED DESCRIPTIONSThe rest of this chapter provides the detailed descriptions of the <strong>CrossView</strong><strong>Pro</strong> commands.
Command Reference13−17expressionFunctionPrint the value or address of an expression.From the Data menu, select Evaluate Expression... Enter an expressionand optionally select a display format. You may set up a monitor, whichinstructs the debugger to evaluate a particular expression each time theprogram stops, from the Source Window by selecting text there and byclicking on the Watch Expression button.Enter the expression in the Command Window. You may specify in whichformat you want <strong>CrossView</strong> <strong>Pro</strong> to display the answer.DescriptionIn the Command Window, the syntax for this command is:exp [/ format |@ format]Print the value or address of exp with format format. A / (slash) is used toprint the value of exp and a @ (commercial at) is used to print the addressof exp. If format is not supplied, the natural (/n) format of the expressionis used.Formats have the syntax:[count] style [size]count is the number of times to apply the format style and defaults to 1.style may be one of:a c D O U X d o u x E F G e f g i I n P p s tSee Chapter 6, Accessing Code and Data, and section 3.5 FormattingExpressions in Chapter 3, Command Language, for details on each of theformat styles.size indicates the number of bytes to be formatted. Rather than a numberfor the integer type styles, size can also be: c for char, s for short, i for int,and l for long.The default action, if no modifier is specified, is to print the value of expusing the /n (normal) format.• • • • • • • •
13−18Chapter 13Be careful with one letter variable names, as they may be taken as an<strong>CrossView</strong> <strong>Pro</strong> command rather than as a variable. If an expression beginswith a variable that might be mistaken for a command, then eliminate anywhite space between the variable and the first operator. For example: useh=9 instead of h = 9.To display the value of a variable that has the same name as an <strong>CrossView</strong><strong>Pro</strong> command you must use the natural format modifier. For example: toprint the value of the variable C, use C/n.Variables may be altered as a side effect of evaluation of exp. See theexample below.ExampleTo set variable aux to t times 8, type:aux = t++*8As a side effect the variable t is post−incremented. If you type:$s_aux = func(t,s)<strong>CrossView</strong> <strong>Pro</strong> will set special variable $s_aux to the result of the functioncall to func with the variables t and s passed as parameters. If you type:$s_aux/x4Print the value of the special variable $s_aux as four hex bytes; you couldalso use: $s_aux/xl.^REFERENCE
Command Reference13−19lineFunctionDisplay the C source line numbered line in the current source file.From the Edit menu, select Find Line... Enter the line number and clickon the Find button. Alternately, you may click on the desired source linein the Source Window.Enter the line number in the Command Window. The syntax is:lineDescriptionThe current viewing position becomes line.ExampleTo display the twelfth line in the current source file, type:12e, p, P• • • • • • • •
13−20Chapter 13stringFunctionEcho a string to the terminal.Enter the string to the Command Window.DescriptionA string may contain standard C escapes, such as \n for a newline. Thesyntax for a string in the Command Window is:"string"ExampleThis function can be useful for labelling breakpoints. For example, toinsert a breakpoint at line 12 and have a message printed when that line isreached, enter:12 b {"At the twelfth line\n"; C}When <strong>CrossView</strong> <strong>Pro</strong> reached line 12, the message At the twelfth line"will be printed and the program will continue. If you only type:"Debug"<strong>CrossView</strong> <strong>Pro</strong> will simply echo the word Debug."Q, expressionREFERENCE
Command Reference13−21!FunctionInstruct <strong>CrossView</strong> <strong>Pro</strong> to interpret a command literally, ignoring anymacro definitions of the same name. Also, enter a shell command.The syntax for this command is:or:[ string ] !! [ string ]DescriptionThis command is useful whenever string should be treated literally and notas a potential macro invocation. It can be used, for example, in executingan <strong>CrossView</strong> <strong>Pro</strong> command whose name has been defined as a macro.ExampleTo enter the host environment under a new shell, type:!To execute the host date command, type:!dateTo execute the <strong>CrossView</strong> <strong>Pro</strong> command b instead of the macro named b,type:b!set, unset, echo, save• • • • • • • •
13−22Chapter 13/FunctionSearch down (forward) for a string.To search for a string in the Source Window, select Search String... fromthe Edit menu and select the up radio button. To repeat your search clickon the Find Next Text String button.The command line syntax is:/ [ string ]DescriptionThe search begins with the line after the current line. If the string is foundthe viewing position is changed to the line containing the string. Theexecution position is not affected. If you do not specify a string to searchfor, <strong>CrossView</strong> <strong>Pro</strong> will look for the most recent specified string.Searches wrap around to the beginning of the file. Regular expressions arenot recognized.ExampleTo look for the next occurrence of Random in the current file, beginningwith the line after the current line, type:/RandomREFERENCE?, Z
Command Reference13−23?FunctionSearch up (backward) for a string.To search for a string in the Source Window, select select Search String...from the Edit menu and select the down radio button. To repeat yoursearch click on the Find Next Text String button.The command line syntax is:? [ string ]DescriptionThe search begins with the line before the current line. If string is found,the current line is changed to point to the line containing the string. Theexecution position is not affected. If you do not specify string, <strong>CrossView</strong><strong>Pro</strong> searches for the previously−specified string again.Searches wrap around to the end of the file. Regular expressions are notrecognized.ExampleTo look for the previous occurrence of Random in the current file,beginning with the line above the current line, type:/, Z?Random• • • • • • • •
13−24Chapter 13
Command Reference13−25
13−26Chapter 13>FunctionRecord <strong>CrossView</strong> <strong>Pro</strong> commands to a file.To start recording or toggle the state of the command recordingmechanism, select Record | <strong>CrossView</strong>... from the Tools menu. Type orselect a file to record commands in and click on the Start button to startrecording. To suspend recording click on the Suspend button. To resumerecording click on the Resume button. To stop recording click on theStop button.The command line syntax is (note that the greater than sign must be typedas shown):> [ ! ] [ file | t | f | c ]Description<strong>CrossView</strong> <strong>Pro</strong> will start recording commands in a file if file is specified,otherwise, turn recording on (t), off (f), or close (c) the recording file.Specifying a different file while recording is on will cause the old outputfile to be closed and all successive commands will be sent to the new file.If no arguments are given, the state of the recording mechanism will bedisplayed.The optional ’!’ forces flushing of the output after every write.REFERENCEThe commands recorded can be played back by using the < or
Command Reference13−27To suspend recording commands, type:>fTo resume recording the commands to the recording file, type:>tTo stop recording commands and close the file, type:>cTo display the state of the recording mechanism, type:>>>, >&,
13−28Chapter 13>@FunctionRecord <strong>CrossView</strong> <strong>Pro</strong> and emulator commands to a file.To start recording or toggle the state of the command recordingmechanism, select Record | <strong>CrossView</strong>... from the Tools menu. Type orselect a file to record commands in, select Include emulator commandsand click on the Start button to start recording. To suspend recordingclick on the Suspend button. To resume recording click on the Resumebutton. To stop recording click on the Stop button.The command line syntax is (note that the greater than sign must be typedas shown):>@ [ ! ] [ file | t | f | c ]Description<strong>CrossView</strong> <strong>Pro</strong> will start recording commands in a file if file is specified,otherwise, turn recording on (t), off (f), or close (c) the recording file.Specifying a different file while recording is on will cause the old outputfile to be closed and all successive commands will be sent to the new file.If no arguments are given, the state of the recording mechanism will bedisplayed.The optional ’!’ forces flushing of the output after every write.REFERENCEThe commands recorded can be played back by using the < or
Command Reference13−29To suspend recording commands, type:>@fTo resume recording the commands to the recording file, type:>@tTo stop recording commands and close the file, type:>@c>, >#, >>, >&,
13−30Chapter 13>#FunctionRecord emulator commands to a file.To start recording or toggle the state of the command recordingmechanism, select Record | Emulator... from the Tools menu. Type orselect a file to record commands in and click on the Start button to startrecording. To suspend recording click on the Suspend button. To resumerecording click on the Resume button. To stop recording click on theStop button.The command line syntax is (note that the greater than sign must be typedas shown):># [ ! ] [ file | t | f | c ]Description<strong>CrossView</strong> <strong>Pro</strong> will start recording emulator commands in a file if file isspecified, otherwise, turn recording on (t), off (f), or close (c) therecording file. Specifying a different file while recording is on will causethe old output file to be closed and all successive commands will be sentto the new file. If no arguments are given, the state of the recordingmechanism will be displayed.The optional ’!’ forces flushing of the output after every write.REFERENCEThe emulator commands recorded can only be played back by selectingPlayback | Emulator... from the Tools menu It is possible to have acommand recording file and a screen output recording file to be openconcurrently. The file is also closed as a side effect of the q command.Files may not be named: t, f or c.ExampleTo set (or change) the emulator command recording file to emu.cmd andturn command recording on, type:>#emu.cmd
Command Reference13−31To suspend recording emulator commands, type:>#fTo resume recording the emulator commands to the recording file, type:>#tTo stop recording emulator commands and close the file, type:>#c>, >>, >&,
13−32Chapter 13>>FunctionLog Command Window screen output. All Command Window input andoutput will be saved to a file.To create a log of Command Window screen output, select Log |Command Input/Output... from the Tools menu. Type or select a file tolog to and click on the Start button to start logging. To suspend loggingclick on the Suspend button. To resume logging click on the Resumebutton. To turn off logging click on the Stop button.The command line syntax is:>> [ ! ] [ file | t | f | c ]DescriptionStart logging the commands typed and their output in a file if file isspecified, otherwise, turn logging on (t), off (f), or close (c) the log file.Specifying a different file while logging is on will cause the old output fileto be closed and all successive Command window output will be sent tothe new file. If no arguments are given, the state of the recording andlogging mechanism is displayed.The optional ’!’ forces flushing of the output after every write.Because output is logged as well as commands, files logged using >>cannot be played back like those recorded with the > command.REFERENCEIt is possible to have both a command recording file and a screen outputlogging file open concurrently. The log file is also closed as a side effectof the q command. Log files may not be named: t, f or c.ExampleTo set (or change) screen output recording file to the file screen.logand turn screen output recording on, type:>>screen.logTo suspend recording the screen output, type:>>f
Command Reference13−33To resume recording the screen output in the recording file, type:>>tTo stop recording the screen output and close the file, type:>>cTo display the state of the recording mechanism, type:>>>, >&, I, q• • • • • • • •
13−34Chapter 13>&FunctionLog communications between debugger and emulator.To save debugger/emulator communications, select Log |<strong>CrossView</strong>−Emulator I/O... from the Tools menu. Type or select a file tolog to and click on the Start button to start logging. To suspend loggingclick on the Suspend button. To resume logging click on the Resumebutton. To turn off logging click on the Stop button.The command line syntax is:>& [ ! ] [ file | t | f | c ]DescriptionStart host−to−execution environment communication logging in a file if fileis specified; otherwise, turn logging on (t), off (f), or close (c) the log file.This feature is most often used to diagnose problems with <strong>CrossView</strong> <strong>Pro</strong>itself.The optional ’!’ forces flushing of the output after every write.The commands captured cannot be played back the way commandsrecorded by the > command can. The log file is also closed as a side effectof the q command.Not available for all execution environments.REFERENCEExampleTo open the file out.log and put the following host−to−emulatorcommunications in this file, type:>&out.logTo suspend logging communications in the log file, type:>&fTo resume logging communications in the log file, type:>&t
Command Reference13−35To stop logging communications and close the file, type:>&c>, >>, q• • • • • • • •
13−36Chapter 13>*FunctionLog GDI accesses.To save GDI accesses, select Log | <strong>CrossView</strong>−GDI Accesses... from theTools menu. Type or select a file to log to and click on the Start button tostart logging. To suspend logging click on the Suspend button. To resumelogging click on the Resume button. To turn off logging click on the Stopbutton.The command line syntax is:>* [ ! ] [ file | t | f | c ]DescriptionStart GDI accesses logging in a file if file is specified; otherwise, turnlogging on (t), off (f), or close (c) the log file. This feature is most oftenused to diagnose problems with the Debug Instrument.The optional ’!’ forces flushing of the output after every write.The commands captured cannot be played back the way commandsrecorded by the > command can. The log file is also closed as a side effectof the q command.ExampleTo open the file gdi.log and start logging GDI accesses in this file, type:REFERENCE>*gdi.logTo stop logging GDI accesses and close the file, type:>*c>, >>, q
Command Reference13−37^FunctionDisplay contents of preceding memory location based on the size of thelast data item displayed.The command line syntax is:^ [ format ]DescriptionUse previous format or format, if supplied. Formats have the syntax:[count] style [size]count is the number of times to apply the format style and defaults to 1.style may be one of:a c D O U X d o u x E F G e f g i I n P p s tSee Chapter 6, Accessing Code and Data, and section 3.5 FormattingExpressions in Chapter 3, Command Language, for details on each of theformat styles.size indicates the number of bytes to be formatted. Rather than a numberfor the integer type styles, size can also be: c for char, s for short, i for int,and l for long.This command is most often used in combination with exp/format to lookat the value of some variable or memory location.ExampleTo display the variable aux as two octal values of length two, type:^ aux/2o2To show the eight bytes before aux in hexadecimal format, next type:^2x4expression• • • • • • • •
13−38Chapter 13AFunctionToggle the state of the assertion mode.To activate or suspend assertion mode, select Assertions... from theBreakpoints menu, and enable or disable the Assertion Mode Activecheck box.The command line syntax is:A [ a | s ]DescriptionActivate (A a) or suspend (A s) overall state of the assertion mechanism. Ifno operand is given, toggle the state.ExampleTo activate the assertion mechanism, type:A aTo suspend the assertion mechanism, type:A sTo toggle the state of the assertion mechanism, simply type:AREFERENCEa
Command Reference13−39aFunctionDefine or modify an assertion.From the Breakpoints menu, select Assertions... to open the Assertionsdialog box. Click the New... button to define an assertion. Select anassertion and click the Edit... button to modify an assertion.The command line syntax is:exp a { a | d | s }a cmdsDescriptionThe a command is used to invoke two different commands. The syntax foreach command is distinct. The first version allows modification of the stateof the assertion specified by the expression exp. (The assertion can beactivated (a a), deleted (a d) or suspended (a s).) The second versioncreates a new assertion with the given command list cmds. Using themouse, you can create a new assertion or toggle the state of an existingone from the Assertions dialogue box.Suspended assertions continue to exist, but are not active. Deletedassertions must be explicitly redefined in order to be made active again.The commands for every active assertion are executed after every sourcestatement is executed. The x command in an assertion command listforces an exit from assertion mode.This command is not allowed when the target runs in the background.ExampleTo suspend assertion 3, type:3 a sTo delete assertion 1, type:1 a d• • • • • • • •
REFERENCE13−40Chapter 13To set an assertion to stop the program when global variable myvarexceeds 3, type:a if (myvar > 3) {x}A, l, x
Command Reference13−41BFunctionList all of the currently defined breakpoints.From the Breakpoints menu, select Breakpoints... to open theBreakpoints dialog box.The command line syntax is:BDescriptionBreakpoints are listed with numbers associated with them. These numberscan be used to delete individual breakpoints.break, b, bb, bB, bi, bI, bu, bU, R, C, D, l• • • • • • • •
13−42Chapter 13bFunctionSet a code breakpoint.From the Breakpoints menu, select Breakpoints... to open theBreakpoints dialog box. Click the Add > button and select CodeBreakpoint... to open the Add Code Breakpoint dialog. Enter the name ofthe source module or click the Break At... button to select a sourcemodule and enter a line number.Alternatively, you can set a code breakpoint directly in the source byclicking on a green breakpoint toggle next to the source line.The command line syntax is:[line] b [commands]DescriptionYou can attach a list of <strong>CrossView</strong> <strong>Pro</strong> commands with the breakpoint. Ifno line is given, set the breakpoint at the current viewing position.When the breakpoint is hit execution is halted. By default the currentexecution position, function, line number, and source statement aredisplayed. Next, any commands associated with the breakpoint areexecuted. The Q command can be used to suppress the output from the bcommand.REFERENCEExampleTo set a breakpoint at the current line, type:bTo set a breakpoint at line 10 that will list all global variables and haltexecution, type:10 b {l g}break, bd, bD, bdis, bena, bb, bB, bi, bI, bt, bti, btI, bu, bU, Q
Command Reference13−43bBFunctionSet a temporary breakpoint at the beginning of a function.In the Stack Window, click on the desired function and select StackBreakpoint | At Function Entry from the Breakpoints menu.The command line syntax is:[ stack ] bB [ cmds ]DescriptionThe function is designated by the stack level stack. If no function isspecified, <strong>CrossView</strong> <strong>Pro</strong> uses the current function (stack level 0), andassociates the list of <strong>CrossView</strong> <strong>Pro</strong> commands cmds with the breakpoint.Breakpoints set in the Stack Window are always temporary, meaning theywill be deleted after the first time you reach them. A breakpoint set in thismanner will not be visible in the Source Window.When the breakpoint is hit, execution is halted; the breakpoint is thenremoved. By default the current execution position, function, line number,and source statement are displayed. Next, any commands associated withthe breakpoint are executed. The Q command can be used to suppress theoutput from the bB command.This command is not allowed when the target runs in the background.ExampleTo set a temporary breakpoint at the beginning of the current functionwhich prints a stack trace, type:bB {T}To set a temporary breakpoint at the beginning of the function whosestack number is 2, type:2 bBbreak, b, bb, bd, bD, bi, bI, bt, bti, btI, bu, bU, Q• • • • • • • •
13−44Chapter 13bbFunctionSet a permanent breakpoint at the beginning of a function.In the Stack Window, click on the desired function and select StackBreakpoint | At Function Entry from the Breakpoints menu. To makethe stack breakpoint permanent, select Breakpoints... from theBreakpoints menu, select the desired breakpoint and click on the Edit...button. The Edit Code Breakpoint dialog appears. Click on theAdvanced>> button and disable the Remove when hit check box.The command line syntax is:[ stack ] bb [ cmds ]DescriptionSet a breakpoint at the beginning of the function designated by the stacklevel stack. Otherwise, use the current function (stack level 0), andassociate the list of <strong>CrossView</strong> <strong>Pro</strong> commands cmds with the breakpoint.When the breakpoint is hit, execution is halted. By default the currentexecution position, function, line number, and source statement aredisplayed. Next, any commands associated with the breakpoint areexecuted. The Q command can be used to suppress the output from thebb command.This command is not allowed when the target runs in the background.REFERENCEExampleTo set a breakpoint at the beginning of the current function, which prints astack trace, type:bb {T}To set a breakpoint at the beginning of a function whose stack number is2, type:2 bbbreak, b, bB, bd, bD, bi, bI, bt, bti, btI, bu, bU, Q
Command Reference13−45bcFunctionSet a breakpoint’s count and reset count.From the Breakpoints menu, select Breakpoints... , select thebreakpoint for which you want to set the count and reset count and clickon the Edit... button. The Edit Code Breakpoint dialog appears. Click onthe Advanced button and enter a breakpoint count.The command line syntax is:[ number ] bc [ count ] [ reset_count ]DescriptionSet the count and reset_count for the breakpoint with breakpoint numbernumber. When no arguments are given, the breakpoint at the currentviewing position is set to a count of 1 and a reset count of 1. If nobreakpoint is present at the current viewing position, the message "Nosuch breakpoint" appears.Each time a breakpoint is hit, <strong>CrossView</strong> <strong>Pro</strong> decrements the count. Whenthe count reaches 0, execution is halted and the count is reset to thereset_count.This command is not allowed when the target runs in the background.ExampleTo set a breakpoint’s count and reset count to 1 for the breakpoint at thecurrent viewing position, type:bcTo set the count to 3 and the reset count to 4 for the breakpoint whosebreakpoint number is 2, type:2 bc 3 4break, C• • • • • • • •
13−46Chapter 13bCYCFunctionSet a temporary cycle count breakpoint.From the Breakpoints menu, select Breakpoints... to open theBreakpoints dialog box. Click the Add > button and select CycleBreakpoint... to open the Add Cycle Breakpoint dialog. Click theAdvanced button and enable the Remove when hit check box.The command line syntax is:count bCYC [cmds]DescriptionSet a temporary breakpoint after the specified cycle count. count can beany expression evaluating to a number. The list of <strong>CrossView</strong> <strong>Pro</strong>commands cmds are executed when the breakpoint is hit.When the breakpoint is hit, execution is halted; the breakpoint is thenremoved. By default the current execution position, function, line number,and source statement are displayed. Next any commands associated withthe breakpoint are executed. The Q command can be used to suppress theoutput from the bCYC command.ExampleTo set a temporary breakpoint after 4 clock cycles and list all globalvariables, type:REFERENCE4 bCYC {l g}break, b, bcyc, bINST, binst, bTIM, btim, D
Command Reference13−47bcycFunctionSet a permanent cycle count breakpoint.From the Breakpoints menu, select Breakpoints... to open theBreakpoints dialog box. Click the Add > button and select CycleBreakpoint... to open the Add Cycle Breakpoint dialog. Enter a cyclecount and click the OK button.The command line syntax is:count bcyc [cmds]DescriptionSet a permanent breakpoint after the specified cycle count. count can beany expression evaluating to a number. The list of <strong>CrossView</strong> <strong>Pro</strong>commands cmds are executed when the breakpoint is hit.When the breakpoint is hit, execution is halted. By default the currentexecution position, function, line number, and source statement aredisplayed. Next any commands associated with the breakpoint areexecuted. The Q command can be used to suppress the output from thebcyc command.ExampleTo set a cycle count breakpoint after 4 clock cycles and list all globalvariables, type:4 bcyc {l g}break, b, bCYC, bINST, binst, bTIM, btim, D• • • • • • • •
13−48Chapter 13bDFunctionSet a read and/or write data breakpoint over a range of addresses.From the Breakpoints menu, select Breakpoints... to open theBreakpoints dialog box. Click the Add > button and select DataBreakpoint... to open the Add Data Breakpoint dialog. Enter an addressor click the Address... button to select a symbol to use as the address.Click the Advanced button. Enter an address in the End adress field orclick the Browse... button to select a symbol to use as the end address.Click the OK button to add the data breakpoint.The command line syntax is:exp1 bD { r | w | b } exp2 [cmds]DescriptionSet a read, write, or both (read and write) data breakpoint in the addressrange exp1 to exp2 and associate the list of <strong>CrossView</strong> <strong>Pro</strong> commandscmds with the breakpoint.When the breakpoint is hit, execution is halted. By default the currentexecution position, function, line number, and source statement aredisplayed. Next, any commands associated with the breakpoint areexecuted. The Q command can be used to suppress the output from thebD command.REFERENCEIf exp1 is the address of a local (stack) variable, the function in which itwas declared must be currently active on the stack. If the local variablecorresponding to a data breakpoint goes out of scope due to a return fromthe function in which it is currently active, the data breakpoint will beremoved and a message will be printed telling the user that the variable isno longer active.Not available for all execution environments.ExampleTo set a data breakpoint that includes the entire structure rec1, type:&rec1 bD r (int)&rec1+sizeof(rec1)−1
Command Reference13−49This breakpoint will be hit only if any address in the range of addresses isread from.To set a data breakpoint for the address range 10 to 10f hex (256 bytes)that will list all global variables, type:0x10 bD b 0x10f {l g;}This breakpoint will be hit if any memory locations within the range10−10f hex are either read from or written to.break, b, bb, bB, bd, bi, bI, bt, bti, btI, bu, bU, Q• • • • • • • •
13−50Chapter 13bdFunctionSet a read and/or write data breakpoint at an address.From the Breakpoints menu, select Breakpoints... to open theBreakpoints dialog box. Click the Add > button and select DataBreakpoint... to open the Add Data Breakpoint dialog. Enter an addressor click the Address... button to select a symbol to use as the address.Click the OK button to add the data breakpoint.The command line syntax is:exp bd { r | w | b } [cmds ]DescriptionSet a read, write or both (read and write) data breakpoint at the addressspecified by exp and associate the list of <strong>CrossView</strong> <strong>Pro</strong> commands cmdswith the breakpoint.When the breakpoint is hit, execution is halted. By default the currentexecution position, function, line number, and source statement aredisplayed. Next any commands associated with the breakpoint areexecuted. The Q command can be used to suppress the output from thebd command.REFERENCEIf exp corresponds to a local (stack) variable, the function in which it wasdeclared must be currently active on the stack. If the local variablecorresponding to a data breakpoint goes out of scope due to a return fromthe function in which it is currently active, the data breakpoint will beremoved and a message will be printed telling you that the variable is nolonger active.Not available for all execution environments.ExampleTo set a breakpoint at the variable count which will all be hit only if thevariable is read from memory, type:&count bd r
Command Reference13−51Note that the breakpoint only acts on the lowest byte in memory of thisvariable.To set a breakpoint at address 10 hex that will list all global variables,type:0x10 bd b {l g}This breakpoint will be hit if address 10 hex is either read from or writtento.break, b, bb, bB, bD, bi, bI, bt, bti, btI, bu, bU, Q• • • • • • • •
13−52Chapter 13bdisFunctionDisable code breakpoint.From the Breakpoints menu, select Breakpoints... On Windows togglethe check box in front of the breakpoint to enable or disable thebreakpoint. On UNIX select the breakpoint and click the Enable orDisable button.The command line syntax is:number bdisDescriptionDisable the code breakpoint associated with the given number.This does not delete the code breakpoint. It disables the code breakpointuntil you enable it again with the bena command.This command does not work on data breakpoints, only on codebreakpointsExampleTo disable code breakpoint number 3, type:3 bdisREFERENCEbreak, b, bena, D
Command Reference13−53benaFunctionEnable code breakpoint.From the Breakpoints menu, select Breakpoints... On Windows togglethe check box in front of the breakpoint to enable or disable thebreakpoint. On UNIX select the breakpoint and click the Enable orDisable button.The command line syntax is:number benaDescriptionEnable the code breakpoint associated with the given number, which waspreviously disabled by the bdis command.This command does not work on data breakpoints, only on codebreakpointsExampleTo enable code breakpoint number 3, type:3 benabreak, b, bdis, D• • • • • • • •
13−54Chapter 13bIFunctionSet a temporary low−level breakpoint at a machine instruction.From the Breakpoints menu, select Breakpoints... to open theBreakpoints dialog box. Click the Add > button and select CodeBreakpoint... to open the Add Code Breakpoint dialog. Edit the BreakAt... field. In the Advanced dialog enable the Remove when hit checkbox.The command line syntax is:[addr] bI [cmds]DescriptionSet a temporary breakpoint at the machine instruction at address addr, orthe current viewing position’s address if addr is not specified; the list of<strong>CrossView</strong> <strong>Pro</strong> commands cmds are executed when the breakpoint is hit.Make sure that addr is the start address of a machine instruction,otherwise the results are unpredictable. When the breakpoint is hitexecution is halted. By default the current execution position, function,line number, and source statement are displayed. Next any commandsassociated with the breakpoint are executed. The Q command can be usedto suppress the output from the bI command.REFERENCEExampleTo set a temporary breakpoint at the current viewing position’s address,type:bITo set a temporary breakpoint at address 100 that will print the addressesof the next five source statements, type:100 bI {P 5}break, b, bb, bB, bd, bD, bi, bt, bti, btI, bu, bU, Q
Command Reference13−55biFunctionSet a permanent low−level breakpoint at a machine instruction.From the Breakpoints menu, select Breakpoints... to open theBreakpoints dialog box. Click the Add > button and select CodeBreakpoint... to open the Add Code Breakpoint dialog. Edit the BreakAt... field. In the Advanced dialog disable the Remove when hit checkbox.Alternatively, you can place a breakpoint in the intermixed window orassembly window by double clicking on the desired instruction.The command line syntax is:[addr] bi [cmds]DescriptionSet a permanent breakpoint at the machine instruction at address addr, orthe current viewing position’s address if addr is not specified; the list of<strong>CrossView</strong> <strong>Pro</strong> commands cmds are executed when the breakpoint is hit.Make sure that addr is the start address of a machine instruction,otherwise the results are unpredictable. When the breakpoint is hitexecution is halted. By default the current execution position, function,line number, and source statement are displayed. Next any commandsassociated with the breakpoint are executed. The Q command can be usedto suppress the output from the bi command.ExampleTo set a breakpoint at the current viewing position’s address, type:biTo set a breakpoint at address 100 that will print the addresses of the nextfive source statements, type:100 bi {P 5}break, b, bb, bB, bd, bD, bI, bt, bti, btI, bu, bU, Q• • • • • • • •
13−56Chapter 13bINSTFunctionSet a temporary instruction count breakpoint.From the Breakpoints menu, select Breakpoints... to open theBreakpoints dialog box. Click the Add > button and select InstructionBreakpoint... to open the Add Instruction Breakpoint dialog. Type avalue in the Instruction count field and enable the Remove when hitcheck box in the Advanced dialog.The command line syntax is:count bINST [cmds]DescriptionSet a temporary breakpoint after the specified count number of machineinstructions have been executed. count can be any expression evaluatingto a number. The list of <strong>CrossView</strong> <strong>Pro</strong> commands cmds are executedwhen the breakpoint is hit.When the breakpoint is hit, execution is halted; the breakpoint is thenremoved. By default the current execution position, function, line number,and source statement are displayed. Next any commands associated withthe breakpoint are executed. The Q command can be used to suppress theoutput from the bINST command.REFERENCEExampleTo set a temporary breakpoint after execution of 5 instructions and list allglobal variables, type:5 bINST {l g}break, b, bCYC, bcyc, binst, bTIM, btim, D
Command Reference13−57binstFunctionSet a permanent instruction count breakpoint.From the Breakpoints menu, select Breakpoints... to open theBreakpoints dialog box. Click the Add > button and select InstructionBreakpoint... to open the Add Instruction Breakpoint dialog. Type avalue in the Instruction count field and disable the Remove when hitcheck box in the Advanced dialog.The command line syntax is:count binst [cmds]DescriptionSet a permanent breakpoint after the specified count number of machineinstructions have been executed. count can be any expression evaluatingto a number. The list of <strong>CrossView</strong> <strong>Pro</strong> commands cmds are executedwhen the breakpoint is hit.When the breakpoint is hit, execution is halted. By default the currentexecution position, function, line number, and source statement aredisplayed. Next any commands associated with the breakpoint areexecuted. The Q command can be used to suppress the output from thebinst command.ExampleTo set a permanent breakpoint after execution of 5 instructions and list allglobal variables, type:5 binst {l g}break, b, bCYC, bcyc, bINST, bTIM, btim, D• • • • • • • •
13−58Chapter 13breakFunctionUniversal breakpoint command.From the Breakpoints menu, select Breakpoints... toadd/remove/enable/disable breakpoints.The general command line syntax is:break [type] where [, option]...DescriptionThis is a universal breakpoint command.type can be one of: code | data | instructions | cycles | time |sequence | set | delete | enable | disable. The type can beabbreviated. So, t|ti|tim|time are the same. When the type field is notspecified the type defaults to code.Depening on the type field the where field will evaluate to an address,count, name, breakpoint number or a sequence.The available options are listed below.Code breakpointsSyntax:break code address [, option]...REFERENCEaddress can be any expression evaluating to an address.Data breakpointsSyntax:break data address [, option]...address can be any expression evaluating to an address.
Command Reference13−59Instruction count breakpointsSyntax:break instructions count [, option]...count can be any expression evaluating to the number of instructions.Cycle count breakpointsSyntax:break cycles count [, option]...count can be any expression evaluating to the number of cycles.Timer breakpointsSyntax:break timer time [, option]...time can be any expression evaluating to a time value. Depending on thesetting of the timer_unit option this value is in seconds or timer ticks(default is in seconds).Sequence breakpointsSyntax:break sequence sequence [, option]...sequence is a combination of breakpoints.Set/change breakpoint attributesSyntax:break set bp_number | bp_name [, option]...bp_number is the breakpoint number. If the breakpoint has a name(bp_name) you can use this name instead of a number.• • • • • • • •
13−60Chapter 13Delete breakpoint attributesSyntax:break delete bp_number | bp_name | all [, option]...bp_number is the breakpoint number. If the breakpoint has a name(bp_name) you can use this name instead of a number.Enable/disable breakpointsSyntax:break enable bp_number | bp_namebreak disable bp_number | bp_namebp_number is the breakpoint number. If the breakpoint has a name(bp_name) you can use this name instead of a number.Optionsname=strChange/set the name of a breakpoint. Note that when a name of abreakpoint which name is used in a sequence is changed the name inthe sequence is not automatically changed.temporary[=bool]Single shot breakpoint, temporary breakpoints are deleted after theyare hit.enabled[=bool]REFERENCEEnable or disable a breakpoint.curr_count=exprSet current count.reset_count=exprSet reset count.count=exprSet current and reset count of a breakpoint.
Command Reference13−61access_type=r | w | rwSet the access type of a data breakpoint: read (r), write (w) orread/write (rw).addr=exprSet the (start)address for a code or data breakpoint.value=exprset the value for a data breakpoint.method=hardware | software | noneSet the breakpoint method.probe_point[=bool]Treat the breakpoint as a probe point. When a probe point is hit, theassociated commands are executed and program execution iscontinued. <strong>Pro</strong>be points do not update <strong>CrossView</strong> <strong>Pro</strong> windows.size=exprLength of a data or code breakpoint (end_addr = begin_addr+size−1).end_addr=exprThe end address of a range is inclusive.end_value=exprThe end value is inclusive.value_is_absolute[=bool]For instructions and cycles breakpoints only, the specified value is anabsolute count, breakpoint will hit when count has value, otherwiserepeat every number of instructions.commands={ commands }Set breakpoint commands.timer_unit=seconds | ticksThe specified timer value is in seconds or ticks.• • • • • • • •
13−62Chapter 13boolexpr1 | 0 | true | falseTrue/false, case insensitive.Appropriate <strong>CrossView</strong> expression.ExampleTo set a code breakpoint at an address range, type:break code code:0x10, end_addr=code:0x1fTo set a code breakpoint at an address range by specifying a size, type:break code:0x10, size=0x10To set a code breakpoint with a name, type:break code:0x10, name=brk_1To disable the breakpoint with name brk_1, type:break dis brk_1To set a cycle count breakpoint and treat the value as an absolute count,type:break cycles 1000, value_is_absoluteChapter 7, Breakpoints.REFERENCE
Command Reference13−63btFunctionSet a task aware code breakpoint.From the Breakpoints menu, select Breakpoints... to open theBreakpoints dialog box. Click the Add > button and select CodeBreakpoint... to open the Code Breakpoint dialog. Fill in the Task IDfield.The command line syntax is:[line] bt "TaskId" [cmds]DescriptionSet a task aware code breakpoint at the specified source line and associatethe list of <strong>CrossView</strong> <strong>Pro</strong> commands cmds with the breakpoint. If no line isgiven, set the breakpoint at the current viewing position. The TaskId is theidentification of the task as displayed in the Tasks Window or specified bythe l k command.When the breakpoint is hit, execution is halted. By default the currentexecution position, function, line number, and source statement aredisplayed. Next, any commands associated with the breakpoint areexecuted. The Q command can be used to suppress the output from thebt command.ExampleTo set a breakpoint for task 4 at the current viewing position, type:bt "4"To set a breakpoint for task 4 at line 10, which lists all global variables,type:10 bt "4" {l g}break, b, bb, bB, bd, bD, bi, bI, bti, btI, bu, bU, l, Q• • • • • • • •
13−64Chapter 13btIFunctionSet a temporary low−level task aware breakpoint at a machine instruction.From the Breakpoints menu, select Breakpoints... to open theBreakpoints dialog box. Click the Add > button and select CodeBreakpoint... to open the Code Breakpoint dialog. Edit the Break At...field and fill in the Task ID field. In the Advanced dialog enable theRemove when hit check box.The command line syntax is:[addr] btI "TaskId" [cmds]DescriptionSet a temporary task aware breakpoint at the machine instruction ataddress addr, or the current viewing position’s address if addr is notspecified; the list of <strong>CrossView</strong> <strong>Pro</strong> commands cmds are executed whenthe breakpoint is hit. The TaskId is the identification of the task asdisplayed in the Tasks Window or specified by the l k command.Make sure that addr is the start address of a machine instruction,otherwise the results are unpredictable. When the breakpoint is hitexecution is halted. By default the current execution position, function,line number, and source statement are displayed. Next any commandsassociated with the breakpoint are executed. The Q command can be usedto suppress the output from the btI command.REFERENCEExampleTo set a temporary breakpoint for task 4 at the current viewing position’saddress, type:btI "4"To set a temporary breakpoint for task 4 at address 0xF00 and print themessage, type:0xF00 btI "4" {"breakpoint triggered:address 0xF00, task 4"}break, b, bb, bB, bd, bD, bi, bI, bt, bti, bu, bU, l, Q
Command Reference13−65btiFunctionSet a permanent low−level task aware breakpoint at a machine instruction.From the Breakpoints menu, select Breakpoints... to open theBreakpoints dialog box. Click the Add > button and select CodeBreakpoint... to open the Code Breakpoint dialog. Edit the Break At...field and fill in the Task ID field. In the Advanced dialog disable theRemove when hit check box.The command line syntax is:[addr] bti "TaskId" [cmds]DescriptionSet a permanent task aware breakpoint at the machine instruction ataddress addr, or the current viewing position’s address if addr is notspecified; the list of <strong>CrossView</strong> <strong>Pro</strong> commands cmds are executed whenthe breakpoint is hit. The TaskId is the identification of the task asdisplayed in the Tasks Window or specified by the l k command.Make sure that addr is the start address of a machine instruction,otherwise the results are unpredictable. When the breakpoint is hitexecution is halted. By default the current execution position, function,line number, and source statement are displayed. Next any commandsassociated with the breakpoint are executed. The Q command can be usedto suppress the output from the bti command.ExampleTo set a breakpoint for task 4 at the current viewing position’s address,type:bti "4"To set a breakpoint for task 4 at address 0xF00 and print the message,type:0xF00 bti "4" {"breakpoint triggered:address 0xF00, task 4"}break, b, bb, bB, bd, bD, bi, bI, bt, btI, bu, bU, l, Q• • • • • • • •
13−66Chapter 13bTIMFunctionSet a temporary time breakpoint.From the Breakpoints menu, select Breakpoints... to open theBreakpoints dialog box. Click the Add > button and select TimerBreakpoint... to open the Add Timer Breakpoint dialog. Enter a value inthe Time field and enable the Remove when hit check box in theAdvanced dialog.The command line syntax is:time bTIM [cmds]DescriptionSet a temporary breakpoint after the specified time (in seconds). time canbe any expression evaluating to a number. The list of <strong>CrossView</strong> <strong>Pro</strong>commands cmds are executed when the breakpoint is hit.When the breakpoint is hit, execution is halted; the breakpoint is thenremoved. By default the current execution position, function, line number,and source statement are displayed. Next any commands associated withthe breakpoint are executed. The Q command can be used to suppress theoutput from the bTIM command.REFERENCEExampleTo set a temporary breakpoint after 0.5 seconds and list all globalvariables, type:0.5 bTIM {l g}break, b, bCYC, bcyc, bINST, binst, btim, D
Command Reference13−67btimFunctionSet a permanent time breakpoint.From the Breakpoints menu, select Breakpoints... to open theBreakpoints dialog box. Click the Add > button and select TimerBreakpoint... to open the Add Timer Breakpoint dialog. Enter a value inthe Time field and disable the Remove when hit check box in theAdvanced dialog.The command line syntax is:time btim [cmds]DescriptionSet a permanent breakpoint after the specified time (in seconds). time canbe any expression evaluating to a number. The list of <strong>CrossView</strong> <strong>Pro</strong>commands cmds are executed when the breakpoint is hit.When the breakpoint is hit, execution is halted. By default the currentexecution position, function, line number, and source statement aredisplayed. Next any commands associated with the breakpoint areexecuted. The Q command can be used to suppress the output from thebtim command.ExampleTo set a permanent breakpoint after 0.5 seconds and list all globalvariables, type:0.5 bTIM {l g}break, b, bCYC, bcyc, bINST, binst, bTIM, D• • • • • • • •
13−68Chapter 13bUFunctionSet a temporary up−level breakpoint (to finish the function at a specificstack level).In the Stack Window, double−click on the desired function. Alternately,you can click on the desired function in the Stack Window and selectStack Breakpoint | After Call to Function from the Breakpoints menu.The command line syntax is:[ stack ] bU [ commands ]DescriptionThis command sets a temporary up−level breakpoint immediately after thecall to the function designated by the stack number stack, otherwise thecurrently viewed function is used. Associate the list of <strong>CrossView</strong> <strong>Pro</strong>commands commands with the breakpoint.When the breakpoint is hit execution is halted. By default the currentexecution position, function, line number, and source statement aredisplayed. Next any commands associated with the breakpoint areexecuted. The Q command can be used to suppress the output from thebU command.REFERENCEBreakpoints set in the Stack Window are always temporary, meaning theywill be deleted after the first time you reach them. A breakpoint set in thismanner will not be visible in the Source Window.This command is not allowed when the target runs in the background.ExampleTo set a temporary up−level breakpoint immediately after the call to thecurrently viewed function, type:bUTo set a temporary up−level breakpoint immediately after the call to thefunction at stack level 2, type:2 bU {1}
Command Reference13−69After stopping, this command will cause <strong>CrossView</strong> <strong>Pro</strong> to print out thefunction’s local variables and arguments.break, b, bb, bB, bd, bD, bi, bI, bt, bti, btI, bu, Q• • • • • • • •
13−70Chapter 13buFunctionSet a permanent up−level breakpoint (to finish the function at a specificstack level).Click on the desired function in the Stack Window and select StackBreakpoint | After Call to Function from the Breakpoints menu. Tomake the stack breakpoint permanent, select Breakpoints... from theBreakpoints menu, select the desired stack breakpoint and click on theEdit... button. The Edit Code Breakpoint dialog appears. Click on theAdvanced>> button and disable the Remove when hit check box.The command line syntax is:[ stack ] bu [ commands ]DescriptionSet a permanent up−level breakpoint immediately after the call to thefunction designated by the stack number stack, otherwise the currentlyviewed function is used. Associate the list of <strong>CrossView</strong> <strong>Pro</strong> commandscommands with the breakpoint.When the breakpoint is hit execution is halted. By default the currentexecution position, function, line number, and source statement aredisplayed. Next any commands associated with the breakpoint areexecuted. The Q command can be used to suppress the output from thebu command.REFERENCEThis command is not allowed when the target runs in the background.ExampleTo set a temporary up−level breakpoint immediately after the call to thecurrently viewed function, type:buTo set an up−level breakpoint immediately after the call to the function atstack level 2 and, after stopping, print out the local variables andarguments of that function, type:2 bu {l}
Command Reference13−71break, b, bb, bB, bd, bD, bi, bI, bt, bti, btI, bU, Q• • • • • • • •
13−72Chapter 13bufaFunctionAppend the contents of one buffer to another buffer.The command line syntax is:bufa target_buffer_name,added_buffer_name[,size_limit]DescriptionAdd the contents of buffer added_buffer_name to buffertarget_buffer_name. If size_limit is specified, buffer target_buffer_namewill be trimmed down to the specified size (keeping size_limit elements ofthe tail of the buffer).ExampleTo append the contents of $buffer to buffer $all_data, and keep thelast 1024 elements, type:bufa $all_data,$buffer,1024bufd, graph, memget.Section 11.5, Data Analysis, in Chapter Special Features.REFERENCE
Command Reference13−73bufdFunctionFree a used buffer.The command line syntax is:bufd buffer_nameDescriptionDiscard the specified buffer (if the target data is not to be used anymore).ExampleTo discard buffer $buffer, type:bufd $bufferbufa, graph, memget.Section 11.5, Data Analysis, in Chapter Special Features.• • • • • • • •
13−74Chapter 13CFunctionContinue using the current value of the program counter.In the Source Window, click on the Run/Continue button. You can alsoselect Run from the Run menu.The command line syntax is:[ exp ] C [ line ]DescriptionIf exp is specified and you are stopped at a breakpoint, then thebreakpoint count is set to this value. If line is specified, a temporarybreakpoint is set at that line number. Note that this temporary breakpointwill overwrite any existing breakpoint at that line.The C command can be used in the command lists of breakpoints toresume execution automatically.This command is not allowed when the target runs in the background.ExampleTo continue execution from the current target program counter, type:CTo set the breakpoint’s count to 4 and continue, type:REFERENCE4 CTo set a temporary breakpoint at line 52 and continue, type:C 52break, bc, g, R, CB
Command Reference13−75CBFunctionContinue execution in background using the current value of the targetprogram counter.The command line syntax is:[ exp ] CB [ line ]DescriptionIf exp is specified and you are stopped at a breakpoint, then thebreakpoint count is set to this value. If line is specified, a temporarybreakpoint is set at that line number. Note that this temporary breakpointwill overwrite any existing breakpoint at that line.The CB command can be used in the command lists of breakpoints toresume execution automatically.This command is not allowed when the target runs in the background.Not available for all execution environments.ExampleTo continue execution from the current target program counter, type:CBTo set the breakpoint’s count to 4 and continue, type:4 CBTo set a temporary breakpoint at line 52 and continue, type:CB 52g, R, C, st, wt• • • • • • • •
13−76Chapter 13cdFunctionDisable, turn off, gathering of coverage information.From the Tools menu, select Coverage if this item was set.The command line syntax is:cdDescriptionIf coverage is supported by your version of <strong>CrossView</strong> <strong>Pro</strong>, this commanddisables the coverage system. Normally, you should disable coverage ifyou are not interested in the coverage results, as this will often improvethe performance of the execution environment.ExampleTo disable coverage, type:cdce, nC, nU, pC, pUREFERENCE
Command Reference13−77ceFunctionEnable, turn on, gathering of coverage information.From the Tools menu, select Coverage if this item was not set.The command line syntax is:ceDescriptionIf coverage is supported by your version of <strong>CrossView</strong> <strong>Pro</strong>, this commandenables the coverage system. Normally, you should disable coverage ifyou are not interested in the coverage results, as this will often improvethe performance of the execution environment.ExampleTo enable coverage, type:cecd, nC, nU, pC, pU• • • • • • • •
13−78Chapter 13clearFunctionClear the Command Output Window.The command line syntax is:clearDescriptionUse this command if you want to clear the output window part of theCommand Window.ExampleTo clear the Command Output Window, type:clearREFERENCE
Command Reference13−79covinfoFunctionList coverage information.From the Tools menu, select Code Coverage..., make your changes andselect the Update button.The command line syntax is:covinfo [[all | module_or_function_name][,filename]]DescriptionIf coverage is supported by your version of <strong>CrossView</strong> <strong>Pro</strong> and coverage isenabled, this command lists the coverage information. Without arguments(same as all) this command lists the coverage information of all modulesand functions.Instead of listing the results you can also save the results in a file withextension .cov.Normally, you should disable profiling if you are not interested in theprofiling results, as this will often improve the performance of theexecution environment.ExampleTo list the coverage information of all modules and functions to the outputwindow, type:cecovinfoTo list coverage information of function main to the output window, type:covinfo mainTo list coverage information of all modules and functions in filehello.cov, type:covinfo all,hello.covcd, ce, proinfo• • • • • • • •
13−80Chapter 13cproinfoFunctionList cumulative profiling results or add or remove functions from the list ofprofiled functions.From the Tools menu, select Cumulative <strong>Pro</strong>filing Setup..., make yourchanges and click the OK button. Select Cumulative <strong>Pro</strong>filing Report...to see the cumulative profiling report.The command line syntax is:cproinfo [all[,filename] | {add | remove } function]DescriptionIf profiling is supported by your version of <strong>CrossView</strong> <strong>Pro</strong> and profiling isenabled, this command lists the cumulative profiling results. Withoutarguments (same as all) this command lists the cumulative profilinginformation of all functions.Instead of listing the results you can also save the results in a file withextension .cpr.Normally, you should disable profiling if you are not interested in theprofiling results, as this will often improve the performance of theexecution environment.REFERENCEExampleTo list the cumulative profiling results of all functions to the outputwindow, type:pecproinfoTo dump cumulative profile information of all functions in filehello.cpr, type:cproinfo all,hello.cprTo add function main to the list of profiled functions, type:cproinfo add main
Command Reference13−81To remove function main from the list of profiled functions, type:cproinfo remove mainproinfo, pd, pe• • • • • • • •
13−82Chapter 13ctFunctionDisplay a C−execution trace.From the View menu, select Trace | Source Level. The Trace Windowdisplays the most recently executed lines of code every time programexecution is stopped. <strong>CrossView</strong> <strong>Pro</strong> automatically updates the TraceWindow each time execution is halted, as long as the window is open.The command line syntax is:number ctDescriptionDisplay a C−execution trace in the Command window, corresponding tothe last number of machine instructions executed. Since the ct commandrelies on the emulator’s trace buffer, the ct command will not beimplemented on some emulators.For each executed line of code, the Trace Window displays:• The name of the source file• The name of the function• The line number and corresponding source codeThe window shows all the code executed since the the last time theprogram halted.REFERENCEThis command is not allowed when the target runs in the background.Not available for all execution environments.ExampleTo display, in the Command window, the last C statements (correspondingto the last ten machine instructions) executed, type:10 ctct i, ct r
Command Reference13−83ct iFunctionDisplay a disassembled trace.From the View menu, select Trace | Instruction Level. The TraceWindow displays the most recently executed lines of code every timeprogram execution is stopped. <strong>CrossView</strong> <strong>Pro</strong> automatically updates theTrace Window each time execution is halted, as long as the window isopen.The command line syntax is:number ct iDescriptionDisplay a disassembled trace in the Command window, corresponding tothe last number of machine instructions executed.Since the ct i command relies on the emulator’s trace buffer, the ct icommand will not be implemented on some emulators (or implementeddifferently).This command is not allowed when the target runs in the background.Not available for all execution environments.ExampleTo display in the Command window the last 20 disassembled instructionsexecuted, type:20 ct ict, ct r• • • • • • • •
13−84Chapter 13ct rFunctionDisplay a raw trace.From the View menu, select Trace | Raw. The Trace Window displays themost recently executed lines of code every time program execution isstopped. <strong>CrossView</strong> <strong>Pro</strong> automatically updates the Trace Window eachtime execution is halted, as long as the window is open.The command line syntax is:number ct rDescriptionDisplay a raw trace in the Command window, corresponding to the lastnumber of trace frames. This command merely shows the contents of theemulator’s trace buffer.Since the ct r command relies on the emulator’s trace buffer, the ct rcommand will not be implemented on some emulators.This command is not allowed when the target runs in the background.Not available for all execution environments.ExampleTo display in the Command window the last 20 trace frames, type:REFERENCEct, ct i20 ct r
Command Reference13−85cxlFunctionExecute a CXL script.The command line syntax is:cxl "script"DescriptionExecute CXL script script. The filename of the CXL script must be enclosedin double quotes.For use with simulation scenarios, you can supply the cxl command to acycle count probe point.ExampleTo execute CXL script myscript.cxl, type:cxl "myscript.cxl"Refer to Appendix B, <strong>CrossView</strong> Extension Language (CXL), for details onthe CXL syntax.• • • • • • • •
13−86Chapter 13cxl_resetFunctionReset variable of one or all CXL scripts.The command line syntax is:cxl_reset ["script"]DescriptionReset all variables of the CXL script script that are executed The filenameof the CXL script must be enclosed in double quotes. If you omit the scriptargument, <strong>CrossView</strong> <strong>Pro</strong> resets all variables of all scripts.For use with simulation scenarios, you can supply the cxl_reset commandto a cycle count probe point.ExampleTo reset all variables that are executed by the CXL script myscript.cxl,type:cxl_reset "myscript.cxl"Refer to Appendix B, <strong>CrossView</strong> Extension Language (CXL), for details onthe CXL syntax.REFERENCE
Command Reference13−87DFunctionDelete all currently defined breakpoints.From the Breakpoints menu, select Breakpoints... to open theBreakpoints dialog box. Click on the Remove All button.The command line syntax is:D[y]DescriptionD deletes all currently defined breakpoints. Dy does not ask forconfirmation.break, B, d• • • • • • • •
13−88Chapter 13dFunctionDelete a specific breakpoint.To delete a code breakpoint directly from the C source, click on the redbreakpoint toggle next to the corresponding, source line in the SourceWindow.Otherwise, select Breakpoints... from the Breakpoints menu to open theBreakpoints dialog box. Select the breakpoint you want to remove andclick on the Remove button.The command line syntax is:[ number ] dDescriptionDelete the breakpoint associated with the given number. If no number isgiven, delete the breakpoint at the current line. If there is no breakpoint atthe current line, a B command will be executed to display all breakpoints.Whenever a breakpoint is deleted the remaining breakpoints arerenumbered starting at 0.ExampleTo delete a breakpoint at the current line, type:REFERENCEdTo delete breakpoint number 3, type:3 dbreak, b, bb, bB, bd, bD, bi, bI, bt, bti, btI, bu, bU, B, D
Command Reference13−89dcmpFunctionCompare a file with the downloaded application.From the File menu, select Compare Application... Specify anapplication file and click on the Compare button.The command line syntax is:dcmp [file[,[number_of_hits][,d]]DescriptionCompare an application file with the memory contents and displaydiffering memory addresses or addresses and values. If you have alreadyloaded an application you can invoke this command without specifying afile name. You can limit the number of differences by specifying anumber_of_hits. The value 0 means there is no limit on the number ofdifferences.This command is not allowed when the target runs in the background.ExampleTo compare the currently loaded application, there is no limit on thenumber of differences and the contents of differing memory addresses arenot displayed, type:dcmpTo compare the currently loaded application and stop when the number ofdifferences equals 10, type:dcmp ,10To compare the currently loaded application there is no limit on thenumber of differences and display the contents of differing memoryaddresses, type:dcmp ,,d• • • • • • • •
REFERENCE13−90Chapter 13To compare file test.abs, stop if the number of differences equals 5 anddisplay the contents of differing memory addresses, type:dcmp "test.abs",5,ddn
Command Reference13−91di_stateFunctionOpen, save/restore, close a debug instrument state.From the Target menu, select Save/Restore Target State...The command line syntax is:di_state open state_namedi_state save state_name, numberdi_state restore state_name, numberdi_state close state_name, deleteDescriptionBefore a state can be saved, restored or closed it must be opend first. Toopen a state use the di_state open state_name command. When openedsuccessfully the name is added to the available state names list.With the di_state save command you can now save the state of the debuginstrument with the specified state_name and number. With di_staterestore you can restore a previously saved state of the debug instrumentwith the specified state_name and number.Use di_state close to close a state. The delete flag can be 1 to delete thestate or use 0 to keep the state.This feature is only available when it is supported by the debuginstrument.ExampleTo open and save a state, type:di_state open S1di_state save S1, 0To restore a state, type:di_state restore S1, 0• • • • • • • •
13−92Chapter 13disFunctionDisassemble a range of memory.From the View menu, select Source | Disassembly or Source | Sourceand Disassembly to open the Disassembly or Source and Disassemblywindow respectively.The command line syntax is:dis address [, {address | #count} [,i]]DescriptionDisassemble a range of memory. The output is interleaved with sourcelines when i is specified. You can enter valid expressions as well foraddress and count.ExampleTo disassemble 4 instructions starting at 3 bytes behind the start address ofthe function main., type:dis main+3,#4To disassemble memory for (initval+1) instructions, starting at theaddress of the function main., type:dis main+3,#initval+1REFERENCETo disassemble from 0x2000 up to and including the instruction at 0x2100and also interleave C source lines of any function resident in that memoryrange, type:dis 0x2000,0x2100,idump, expression
Command Reference13−93dnFunctionDownload a file.From the File menu, select Download Application... to download theimage part of the file to the execution environment.The command line syntax is:dn [ file ]DescriptionDownload the image part of the specified file to the executionenvironment. If no file is specified, use the file specified when <strong>CrossView</strong><strong>Pro</strong> was invoked, and from which the symbolic information was readduring startup, or the file specified in either the N command or the LoadSymbolic Debug Info dialog.Downloading a file only copies an image part into target memory. It willnot cause <strong>CrossView</strong> <strong>Pro</strong> to re−read symbolic information.This command is not allowed when the target runs in the background.ExampleTo download the current file, type:dnTo download the IEEE file demo.abs, type:dn demo.absTo download the hex file test.hex, type:I, Ndn test.hex• • • • • • • •
13−94Chapter 13dumpFunctionDump a range of memory.From the View menu, select Memory | New to open a Memory Window.The command line syntax is:dump address [, [address | #count] [, [style [width ]] [, filename [,a]]]DescriptionThe dump command can dump memory as hexadecimal data or as Cvariables. You can enter valid C expressions as well for address and count.You can also dump Motorola S records or Intel hex records. Also, you canspecify a filename in which the dump is to be written or appended.style can be one of:a c D O U X d o u x E F G e f g n P p R r s t I MStyle I dumps Intel hex and style M specifies Motorola S records output.See Chapter 6, Accessing Code and Data, and section 3.5, FormattingExpressions, in Chapter 3, Command Language, for details on each of theother format styles. The R and r style are only available for targets thatsupport the fractional type.Mind the following:REFERENCE• the commas are required• the addresses can also be C expressions• default width is MAU (usually byte) sized words• additional style M: Motorola S records• additional style I: Intel hex• a semicolon is a command terminator• the dump is end address INclusiveExampleTo dump the first byte of the function main., type:dump main
Command Reference13−95To dump the first 10 bytes of the function main as Motorola S records inthe file main.sre, type:dump main,main+10,M,main.sreTo dump the first 5 bytes of the function main. as 1 string, type:dump main,main+10,M,main.sre,aTo append the first 5 bytes of the function main. as 1 string, type:dump main,,c5To dump the resulting value bytes of ’the address of main binary andedwith 3’, type:dump main+1,#main&3dis, expression• • • • • • • •
13−96Chapter 13eFunctionEstablish viewing positionFrom the File menu, select Open Source... to view a file. In the SourceWindow, click on the Find Symbol button to find a function, or selectFind Symbol... from the Edit menu.In the Stack Window click once on the function to be examined.The command line syntax is:e [ file | function ]stack eDescriptionThe e option invokes two distinct commands. The first version establishesthe viewing position to be the first line of file, the first executable line ofthe function function or the current viewing position if no argument isgiven.The second version establishes the viewing position to be the line at stacklevel stack in the stack trace. (See the t command.)The stack e command is not allowed when the target runs in thebackground.The L command is equivalent to 0 e.REFERENCEExampleTo view the function main, type:e mainTo view the test file test.c, type:e test.cTo view the call site of the current function, type:0 e
Command Reference13−97To view the line at stack level 3, type:3 e?, /, ei, L, p, P, t• • • • • • • •
13−98Chapter 13eCFunctionStart execution on current CPU and switch to another CPU.The command line syntax is:cpu_number eCDescriptionStart execution on the current CPU and switch to CPU cpu_number.This command can only be issued when the currently selected CPU is indebug mode.ExampleTo start execution on the current CPU and select the CPU indicated bynumber 1, type:ec1 eCREFERENCE
Command Reference13−99ecFunctionSelect a CPU or show current CPU number.The command line syntax is:[cpu_number] ecDescriptionThe ec command allows you to select a CPU in your current ExecutionEnvironment if your target has multi−CPU support.This command can only be issued when the currently selected CPU is indebug mode.ExampleTo view the current CPU selection, type:ecTo select the CPU indicated by number 1, type:eC1 ec• • • • • • • •
13−100Chapter 13echoFunctionDisplay the definition of a macro name without executing the macro.From the Tools menu, select Macro Definitions... to view the definitionof a macro.The command line syntax is:echo textDescriptionPerform macro expansion on text without executing. This allows you tosee how a macro is expanded. It is particularly informative when macroscall other macros.ExampleIf you type:echo macro(3)<strong>CrossView</strong> <strong>Pro</strong> will display the expansion of macro(3).set, unset, save, !REFERENCE
Command Reference13−101eiFunctionEstablish viewing position at a specified address.From the Edit menu, select Find Address...The command line syntax is:[addr] eiDescriptionThe ei command establishes the viewing position to be at the instructionspecified.This command is useful for viewing some code in the assembly window,without changing the program counter, since the execution position is notchanged.ExampleTo view the current viewing position, type:eiTo view the instruction at address 0x100, type:0x100 ei?, /, e, L, p, P, t• • • • • • • •
13−102Chapter 13etFunctionSelect the specified task’s context.In the Tasks Window click once on the task to be examined.The command line syntax is:et "TaskId"DescriptionSelect the specified task’s context. The TaskId is the identification of thetask as displayed in the Tasks Window or specified by the l k command.The current execution position, function, line number, and sourcestatement are displayed. All other windows, except for the KernelWindows, are updated accordingly.Subsequent <strong>CrossView</strong> <strong>Pro</strong> commands use the context of the selected task.For example, the t command shows a stack trace of the selected task.ExampleTo select task 4, type:let "4"REFERENCE
Command Reference13−103fFunctionSet default address printing formatThe command line syntax is:f [ " printf−style−format " ]DescriptionSet the default address printing format, using a printf formatspecification.If there is no argument, the format defaults to %x, which prints an addressin hexadecimal.This command is intended to allow users to see memory addresses indecimal, octal or a format of their choosing.ExampleTo display addresses in octal, type:f "%o"To display addresses in hex, type:fexpression• • • • • • • •
13−104Chapter 13faFunctionAdd a FLASH device.From the Target menu, select FLASH Setup...Click Add... to specify a FLASH device.The command line syntax is:fa device_name,base_address,chip_width[,nr_of_chips]DescriptionAdd a flash device to the list of configured flash devices. This commandalso checks whether the device address range overlaps with alreadyconfigured flash devices. device_name is a unique name for the flashdevice. base_address is the start address of the memory range that will becovered by the flash device. chip_width is the width of the flash device inbits. number_of_chips is the number of flash devices you want to use inparallel.ExampleTo add flash device AM29F040 with base address 0xFFE00000, chip width8 and number of chips 2, type:fa AM29F040,0xFFE00000,8,2As a result 16 bits can be accessed in one memory−read cycle.REFERENCETo add flash device AT29C010 with base address 0x2000000, chip width 8and default number of chips 1, type:fa AT29C010,0x2000000,8fc, fd, fl, fw
Command Reference13−105fcFunctionCheck a FLASH device.From the Target menu, select FLASH Setup...Click Check ID.The command line syntax is:fc device_numberDescriptionCheck the manufacturer and device identifiers of a flash device. Eachdevice has a unique manufacturer and device identification value. Withthis command you can check if the flash device on the target boardmatches the device you have selected.The manufacturer value is 0x01 for AMD devices and 0x1F for Atmeldevices. The device identifier value of the AMD flash device AM29F040 is0xA4. The fc command first checks the manufacturer identification. If thissucceeds, the device identification is checked. If the retrieved identifiersdo not match, this command issues an error. If the flash device on thetarget board can be identified it will report the name of this flash device.Use the fl command to see a numbered list of flash devices.ExampleTo check the manufacturer and device id of flash device number 1, type:fc 1fa, fd, fl, fp, fw• • • • • • • •
13−106Chapter 13fdFunctionDelete a FLASH device.From the Target menu, select FLASH Setup...Select a device and click Remove.The command line syntax is:fd device_numberDescriptionDelete a flash device from the list of configured flash devices.Use the fl command to see a numbered list of flash devices.ExampleTo delete flash device number 0, type:fd 0fa, fc, flREFERENCE
Command Reference13−107flFunctionList FLASH devices.From the Target menu, select FLASH Setup...The command line syntax is:flDescriptionList the configured flash devices. You can use the Number in other<strong>CrossView</strong> <strong>Pro</strong> flash commands.ExampleTo list the flash devices, type:flThis results for example in the following list:Number Device name Address Width Chips0 AM29F040 0xFFE00000 8 21 AT29C010 0x2000000 8 1fa, fc, fd, fp, fpe, fpd• • • • • • • •
13−108Chapter 13fpFunctionGet protection status of a FLASH device.From the Target menu, select FLASH Setup...Select a device and click <strong>Pro</strong>tection −> Get status.The command line syntax is:fp device_numberDescriptionGet the protection status of the specified flash device. A flash device thatsupports a protection mechanism can be protected or not. Use the fpe orfpd command to enable or disable the protection.Use the fl command to see a numbered list of flash devices.ExampleTo get the protection status of flash device number 0, type:fp 0fl, fpe, fpdREFERENCE
Command Reference13−109fpdFunctionUnprotect a FLASH device.From the Target menu, select FLASH Setup...Select a device and click <strong>Pro</strong>tect −> Disable.The command line syntax is:fpd device_numberDescriptionA flash device that supports a protection mechanism can be protected ornot. With this command you can disable (clear) the protection.Use the fl command to see a numbered list of flash devices.ExampleTo unprotect flash device number 0, type:fpd 0fl, fp, fpe• • • • • • • •
13−110Chapter 13fpeFunctionEnable protection of a FLASH device.From the Target menu, select FLASH Setup...Select a device and click <strong>Pro</strong>tection −> Enable.The command line syntax is:fpe device_numberDescriptionA flash device that supports a protection mechanism can be protected ornot. With this command you can enable (set) the protection.Use the fl command to see a numbered list of flash devices.ExampleTo protect flash device number 0, type:fpe 0fl, fp, fpdREFERENCE
Command Reference13−111FSSFunctionFile System Simulation redirection.The command line syntax is:FSS { < | > }{&stream | "file"}DescriptionRedirect a File System Simulation stream to a file or another stream.Redirection to a file can be needed when a stream is only mapped to awindow and you want it to be mapped to a file also.ExampleTo redirect the output of stream 2 to stream 1, type:FSS 2>&1To retrieve input for stream 1 from stream 4, type:FSS 1
13−112Chapter 13FSS_stdio_closeFunctionClose a stream previously opened by FSS_stdio_open.The command line syntax is:FSS_stdio_close streamnumberDescriptionClose the stream indicated by streamnumber.ExampleTo close stream 1, type:FSS_stdio_close 1FSS_stdio_open.Section 10.3, File System Simulation in Chapter I/O Simulation.REFERENCE
Command Reference13−113FSS_stdio_openFunctionRedirect the output of a stream to a file.The command line syntax is:FSS_stdio_open filename,rwdirection,streamnumberDescriptionRedirect the stream indicated by streamnumber to the file filename.rwdirection can be an r for read−only, w for writable, or rw forread/write.ExampleTo redirect stream 1 (output, so w for writable) to the file myfile.out,type:FSS_stdio_open myfile.out,w,1The following command is used to close the stream.FSS_stdio_close 1FSS_stdio_close.Section 10.3, File System Simulation in Chapter I/O Simulation.• • • • • • • •
13−114Chapter 13fwFunctionSpecify workspace address of FLASH programming monitor.From the Target menu, select FLASH Setup...Specify the Flash workspace address.The command line syntax is:fw [address]DescriptionYou can specify to <strong>CrossView</strong> <strong>Pro</strong> to download a FLASH programmingmonitor to the target to perform the actual flashing. With the fw commandyou specify the data workspace address used by the FLASH programmingmonitor. This address determines the data address only and the codeaddress has a fixed location.The flash workspace has a size of 0x1100 bytes and is used for interactionbetween <strong>CrossView</strong> <strong>Pro</strong> and the flash monitor.Without any address the fw command shows the current flash workspaceaddress value.Note that the address you specify must not be in the memory range of theFLASH devices.REFERENCEExampleTo specify the load address of the data used by the flash programmingmonitor on address 0x10000, type:fw 0x100000To show the current flash programming monitor address settings., type:fwfa, fc, fl
Command Reference13−115gFunctionChange the program counter to a new execution position.Click on a source line and select Jump to Cursor from the Run menu.The command line syntax is:g lineDescriptionThis command changes the program counter so that line becomes thecurrent execution position. Line must be a line in the current function.This command changes only the program counter. It does not cause thetarget to begin execution.Exercise caution when changing the execution position. Oftentimes, eachline of C source code is compiled into several machine languageinstructions. Moving the program counter to a new address in the middleof a series of related assembly instructions is sometimes risky. Moreover,even though you change the program counter, registers and variables maynot have the expected values if parts of the code are bypassed.This command is not allowed when the target runs in the background.ExampleTo change the program counter so that the next instruction to be executedcorresponds to line 127, type:g 127C, gi, R• • • • • • • •
13−116Chapter 13giFunctionChange the program counter to a new execution position.Click on a source line and select Jump to Cursor from the Run menu.The command line syntax is:address giDescriptionThis command changes the program counter so that address becomes thecurrent execution position.This command changes only the program counter. It does not cause thetarget to begin execution.Exercise caution when changing the execution position. The Jump toCursor menu item is not available in the source lines window mode toprevent problems by skipping pieces of C code which are required to beexecuted. Moving the program counter to a new address in the middle ofa series of related assembly instructions is sometimes risky. Moreover, eventhough you change the program counter, registers and variables may nothave the expected values if parts of the code are bypassed.This command is not allowed when the target runs in the background.REFERENCEExampleTo change the program counter so that the next instruction to be executedcorresponds to address 0x0800, type:0x0800 giC, g, R
Command Reference13−117graphFunctionCreate Data Analysis window and execute CXL script.The command line syntax is:graph "window","script"[,arg]...DescriptionCreate Data Analysis window window and execute CXL script script. Thedisplay list produced by the script is shown in the specified window.Arguments arg are passed as global variables to the script. Each argumentis treated as an expression. Arguments starting with a "$" refer to anacquisition buffer. In all other cases arg is evaluated as an expression andwill be casted to type double.If for example register $R1 should be passed as argument to the script youmust write "0+$R1" to avoid that $R1 is recognized as an acquisitionbuffer.ExampleTo transform the contents of buffer $buffer to displayable data inwindow demo using CXL script x_t.cxl, type:graph "demo","x_t.cxl",$buffer,0,1bufa, graphm, graphp, memget.Section 11.5, Data Analysis, in Chapter Special Features.• • • • • • • •
13−118Chapter 13graph_add_updateFunctionAdd a command to the sequence of update commands.For the supplied scripts only. From the Settings menu, select DataAnalysis Window Setup... Enter a new window name and click New.Click Configure... to open the Data Analysis Window Setup dialog.The command line syntax is:graph_add_update "window",commandDescriptionSet the sequence of update commands for Data Analysis window windowmanually. These update commands are executed when the Update buttonon the Data Analysis window is pressed or when the update command isissued.Prior to adding update commands, you have to remove all updatecommands with the graph_clear_updates command.ExampleTo retrieve data and show it in window demo, type:REFERENCEgraph_clear_updates "demo"graph_add_update "demo",memget data[$i],100,$buffergraph_add_update "demo",graphm "demo","show_x_t.cxl"graph_add_update "demo",graph "demo","x_t.cxl",$buffer,0,1update "demo"graph_clear_updates, update.Section 11.5, Data Analysis, in Chapter Special Features.
Command Reference13−119graph_clear_updatesFunctionClear the sequence of update commands.The command line syntax is:graph_clear_updates "window"DescriptionClear the sequence of update commands for Data Analysis windowwindow. This is needed prior to adding new update commands with thegraph_add_update command.ExampleTo retrieve data and show it in window demo, type:graph_clear_updates "demo"graph_add_update "demo",memget data[$i],100,$buffergraph_add_update "demo",graphm "demo","show_x_t.cxl"graph_add_update "demo",graph "demo","x_t.cxl",$buffer,0,1update "demo"graph_add_update, update.Section 11.5, Data Analysis, in Chapter Special Features.• • • • • • • •
13−120Chapter 13graph_closeFunctionClose a Data Analysis window.The command line syntax is:graph_close "window"DescriptionWith the graph_close command you can close the named window.ExampleTo close window demo, type:graph_close "demo"graph, graphm.Section 11.5, Data Analysis, in Chapter Special Features.REFERENCE
Command Reference13−121graph_debugFunctionDebug Data Analysis graph window.The command line syntax is:graph_debug expressionDescriptionIf expression evaluates to a non−zero value, this value is an ORed value oftwo flags:• 1 (bit 0) the "graphical data window debugging mode" will beenabled, showing all communication between the scripts and thewindows in the command window. This can be useful whendeveloping scripts.• 2 (bit 1) When errors occur during script processing, these errorsare logged to the command window. The total error count (perscript) is now shown in a popup window rather than logged in thecommand window. The errors themselves remain logged in thecommand window.Other bits (when value & 3 equals zero, for example 4) are ignored andtreated like zero. No parameters result in value 1. A value of zero turns offall debugging.graph, graphm, graphmn.Section 11.5, Data Analysis, in Chapter Special Features.• • • • • • • •
13−122Chapter 13graphmFunctionSet Data Analysis window display mode.The command line syntax is:graphm "window","script"[,arg]...DescriptionThe graphm command sets the representation script for the specifiedwindow. Depending on the script, the arguments may vary.Several scripts are supplied with the product that you can use with thegraphm command. See section Supplied Data Analysis Window Scripts inChapter Special Features for more information.ExampleTo set the display mode for window demo using CXL scriptshow_x_t.cxl and show "demo" in the title bar of the window, type:graphm "demo","show_x_t.cxl"bufa, graph, graphp, memget.Section 11.5, Data Analysis, in Chapter Special Features.REFERENCE
Command Reference13−123graphmnFunctionSet Data Analysis window display mode.The command line syntax is:graphmn "window","script"[,arg]...DescriptionThe graphmn command works similar to the graphm command, but itdoes not update the graph window. This can be useful where a graphand a graphm command are followed by each other, preventing theredrawing of the same graphics twice.ExampleTo set the display mode for window demo using CXL scriptshow_x_t.cxl and show "demo" in the title bar of the window, type:graphmn "demo","show_x_t.cxl"bufa, graph, graphp, memget.Section 11.5, Data Analysis, in Chapter Special Features.• • • • • • • •
13−124Chapter 13graphpFunctionPosition Data Analysis window on the screen.The command line syntax is:graphp "window",left_top_x,left_top_y,width,heightDescriptionWith the graphp command you can position the named window at thespecified screen coordinates.ExampleTo put window demo at position (0,0) on the screen with a size of100x100, type:graphp "demo",0,0,100,100graph, graphm.Section 11.5, Data Analysis, in Chapter Special Features.REFERENCE
Command Reference13−125gusFunctionSuppress or reactivate window updating.The command line syntax is:gus {on | off}DescriptionWith gus on the GUI updating suppress feature is enabled. This meansthat the graphical windows are no longer updated. To reactivate thewindow updating use the gus off command.ExampleTo suppress the updating of <strong>CrossView</strong> windows, type:gus on• • • • • • • •
13−126Chapter 13IFunctionPrint out information about the state of <strong>CrossView</strong> <strong>Pro</strong>.The command line syntax is:IDescriptionPrint out information about the state of <strong>CrossView</strong> <strong>Pro</strong>, including: the<strong>CrossView</strong> <strong>Pro</strong> version number, the execution environment versioninformation, the name of the program being debugged (and the number ofits files and functions), the state of the assertion mechanism, the state ofoutput recording, the state of command recording, the state of targetcommunication recording and the state of search case sensitivity.The state of the assertion mechanism tells how many assertions have beendefined and whether the overall assertion mechanism is active orsuspended; it does not tell whether any individual assertions are active orsuspended.l, a, A, >, >>, >&, ZREFERENCE
Command Reference13−127ifFunctionConditional command execution.The command line syntax is:if ( expression ) { cmds } [ { cmds } ]DescriptionIf expression evaluates to a non−zero value, execute the first group ofcommands. Otherwise, the second group of commands, if present, will beexecuted. This command is nestable.Leave a space between if and exp. if(a==b) parses as a function call.The if statement is used primarily within breakpoint command lists.ExampleIf you type:if (a=b) {5t} {C}<strong>CrossView</strong> <strong>Pro</strong> will trace back five levels on the stack if a is equal to b.Otherwise, <strong>CrossView</strong> <strong>Pro</strong> will continue.The command line:if (wait>1000) {wait;l r}will print the value of wait and list all registers if the value of waitexceeds 1000.• • • • • • • •
13−128Chapter 13ios_closeFunctionClose a File I/O stream.From the Settings menu, select I/O Simulation Setup... Select a stream inthe Connections tab and click on the Delete button.The command line syntax is:ios_close {stream | "file"}DescriptionYou can specify either a filename or a stream number.ExampleTo close stream number 1, type:ios_close 1To close file data.txt and close 1 stream that is mapped to this file, type:ios_close "data.txt"Only 1 stream is closed, even if multiple streams are attached to this file.The command displays which stream number has been closed.ios_open, ios_wopenREFERENCE
Command Reference13−129ios_openFunctionOpen a File I/O stream.From the Settings menu, select I/O Simulation Setup... Open the FileI/O tab and click on the Configure... button. Attach a stream (with a file)to a probe point.The command line syntax is:ios_open ["file"[,[mode][,[r][,$xvw_variable]]]]DescriptionThis command is useful to connect a file to a stream at the command lineof <strong>CrossView</strong>. <strong>CrossView</strong> returns a stream number which is opened withthis command in the $xvw_variable and displays it too.The filename is optional. When the filename is omitted and such a newlyopened stream receives data and is not shown in any opened terminalwindow a new window will be opened that interacts with this stream.Furthermore the mode can be specified when a I/O stream is opened:read, write or append:rOpen file for reading. The file pointer is positioned at thebeginning of the file.r+ Open file for reading and writing. The file pointer ispositioned at the beginning of the file.wTruncate file to zero length or create file for writing. The filepointer is positioned at the beginning of the file.w+ Open file for reading and writing. The file is created if it doesnot exist, otherwise it is truncated. The file pointer ispositioned at the beginning of the file.aOpen file for writing. The file is created if it does not exist.The file pointer is positioned at the end of the file.a+ Open file for reading and writing. The file is created if it doesnot exist. The file pointer is positioned at the end of the file.• • • • • • • •
13−130Chapter 13All modes can have a ’b’ appended, indicating binary access. The ’b’ canbe positioned before or after the ’+’. This mode affects the ios_read andios_write commands. The ios_read command writes host data to targetmemory. In binary mode MAUs (minimum addressable units) are filledwith a number of bytes that fits in 1 MAU. For example, a MAU with a sizeof 24 bits will be filled with 24/8= 3 bytes. Otherwise the least significant 8bits of a MAU will be filled with 1 byte and the highest 16 bits will befilled with zeros. The ios_write command writes target memory to thehost. In binary mode for each MAU the number of bytes to be writtenequals the number of bytes that fits in 1 MAU. For a MAU size of 24 bits<strong>CrossView</strong> <strong>Pro</strong> will write 3 bytes to the host. If the mode is not binary<strong>CrossView</strong> <strong>Pro</strong> will write the least significant 8 bits (1 byte) of each MAUto the host.<strong>CrossView</strong> <strong>Pro</strong> opens all files by default in w+ mode, overwriting theopened file if it already exists.The optional ’r’ specifies to rewind to the beginning of the file when theend of file is reached.$xvw_variable is a user special variable in <strong>CrossView</strong> <strong>Pro</strong> which holds thevalue of the newly opened stream number. This variable can also be usedin the read and write commands to read from or write to the file.ExampleTo open a new File I/O stream, type:ios_openTo open file data.txt and assign the new stream number to $ios_nr,type:REFERENCEios_open "data.txt",,,$ios_nrTo open file data.txt in read−only mode and wrap around when end offile is reached, type:ios_open "data.txt",r,r,$ios_nrios_wopen, ios_close, ios_read, ios_write
Command Reference13−131ios_readFunctionRead binary data from an I/O stream.The command line syntax is:ios_read {stream | "file"},address,number_of_maus[,x]DescriptionYou can specify a File I/O stream number or a filename. address is thememory location where the read data will be stored. number_of_maus isthe length of the data to be read in MAUs (minimum addressable units).The optional ’,x’ specifies that the read data should be interpreted ashexadecimal values. The hexadecimal format is a whitespace separated(no TAB) hexadecimal string without the 0x prefix.If the stream was opened in binary mode (see ios_open), MAUs are filledwith a number of bytes that fits in 1 MAU. For example, a MAU with a sizeof 24 bits will be filled with 24/8= 3 bytes. Otherwise the least significant 8bits of a MAU will be filled with 1 byte and the highest 16 bits will befilled with zeros.ExampleTo read 16 minimum addressable units from stream 4, type:ios_read 4,0x100,16To read from stream $istrm 1 MAU hex value, type:ios_read $istrm,0x100,1,xios_readf, ios_write, ios_open• • • • • • • •
13−132Chapter 13ios_readfFunctionFormatted read from an I/O stream (scanf). Store the data at the locationdefined by the expression.The command line syntax is:ios_readf {stream | "file"},"format",expressionDescriptionYou can specify a File I/O stream number or a filename. format is a formatspecifier as used in the scanf C library function. expression can be any<strong>CrossView</strong> <strong>Pro</strong> expression.Valid format specifiers are:%d Decimal.%x Hexadecimal (without 0x prefix).%c Char.%s String.%f Float.ExampleTo read a hex value from stream 4 and store it the value of programvariable ch1, type:ios_readf 4,"%x",&ch1REFERENCETo read a hex value from stream 4 and store it in register R2, type:ios_readf 4,"%x",$R2To read two hex values from stream $istrm and assign them to programvariable ch1 and target register R2, type:ios_readf $istrm,"%x %x",&ch1,$R2ios_read, ios_write, ios_open
Command Reference13−133ios_rewindFunctionMove File I/O file pointer to the beginning of the file.From the Settings menu, select I/O Simulation Setup... Open the FileI/O tab and click on the Configure... button. Attach a stream to a probepoint. In the New Stream dialog enable the Wrap around check box.The command line syntax is:ios_rewind {stream | "file"}DescriptionWith ios_rewind the file pointer is moved to the beginning of the file.ExampleTo move the file pointer of the file connected to stream 4 to the beginningof the file, type:ios_rewind 4To move the file pointer of the file connected to stream $istrm to thebeginning of the file, type:ios_rewind $istrmTo move the file pointer to the beginning of file my.txt, which isconnected to a stream, type:ios_rewind "my.txt"ios_read, ios_write, ios_open• • • • • • • •
13−134Chapter 13ios_wopenFunctionOpen a File I/O stream and map the stream to a terminal window.From the Settings menu, select I/O Simulation Setup... Open the FileI/O tab and click on the Configure... button. Attach a stream (which isonly connected to a terminal window) to a probe point.The command line syntax is:ios_wopen [["terminal_window"][,$xvw_variable]]DescriptionWhen the name matches the name of an existing terminal window thenewly opened stream is mapped to this terminal window.$xvw_variable is a user special variable in <strong>CrossView</strong> <strong>Pro</strong> which holds thevalue of the newly opened stream number. This variable can also be usedin the read and write commands to read from or write to theterminal_window.You can close the opened stream with ios_close.ExampleTo create a new terminal window and map the newly created stream to it.The name of the new terminal window will be like #x., type:REFERENCEios_wopen ,$ios_nrTo open a new stream and if there is a terminal window with the name"My terminal" map stream to it, otherwise create a new terminal and nameit "My terminal"., type:ios_wopen "My terminal",$ios_nrios_open, ios_close
Command Reference13−135ios_writeFunctionWrite binary data to an I/O stream.The command line syntax is:ios_write {stream | "file"},address,number_of_maus[,x]DescriptionYou can specify a File I/O stream number or a filename. address is thememory location where the data will be read from. number_of_maus isthe length of the data to be written in MAUs (minimum addressable units).The optional ’,x’ specifies that the data should be interpreted ashexadecimal values. The hexadecimal format is a whitespace separated(no TAB) hexadecimal string without the 0x prefix.If the stream was opened in binary mode (see ios_open), for each MAUthe number of bytes to be written equals the number of bytes that fits in 1MAU. For a MAU size of 24 bits <strong>CrossView</strong> <strong>Pro</strong> will write 3 bytes to thehost. If the mode is not binary <strong>CrossView</strong> <strong>Pro</strong> will write the leastsignificant 8 bits (1 byte) of each MAU to the host.ExampleTo write 16 minimum addressable units to stream 4, type:ios_write 4,0x100,16To write 1 MAU hex value to stream $ostrm, type:ios_write $ostrm,0x100,1,xios_read, ios_writef, ios_open• • • • • • • •
13−136Chapter 13ios_writefFunctionFormatted write to an I/O stream (printf).. The data is obtained from the Cexpression, for example a variable.The command line syntax is:ios_writef {stream | "file"},"format",expressionDescriptionYou can specify a File I/O stream number or a filename. format is a formatspecifier as used in the printf C library function. expression can be any<strong>CrossView</strong> <strong>Pro</strong> expression.Valid format specifiers are:%d Decimal.%x Hexadecimal (without 0x prefix).%c Char.%s String.%f Float.ExampleTo write the hex value of program variable ch1 to stream 4, type:ios_writef 4,"%x",ch1To write the hex value of register R2 to stream $ostrm, type:REFERENCEios_writef $ostrm,"%x",$R2To write the hex values of program variable ch1 and target register R2 tostream 4, type:ios_writef 4,"%x %x",&ch1,$R2ios_read, ios_write, ios_open
Command Reference13−137LFunctionSynchronize the viewing and execution positions.To synchronize the positions manually, click on the Find PC button in theSource Window or select Find PC from the Edit menu.The command line syntax is:LDescriptionThis command synchronizes the viewing and execution positions. It alsolists the current file, function and line number of the current programcounter. The viewing position is always moved to match the executionposition.The L command is synonymous with a 0 e command and does not affectthe execution position.This command is not allowed when the target runs in the background.ExampleTo synchronize the viewing and execution positions, then list current file,function, and line number, type:e, lL• • • • • • • •
13−138Chapter 13lFunctionList.In general, the dialog box in which you define a feature also contains alist.The command line syntax is:l { a| b| d| f| g| k| l| L| m| p| r| s| S} [string]l [func]l stackDescriptionIn the first case above, list one of the following: assertions, breakpoints,directories, files, globals, kernel state data, labels (on module scope), allLabels, memory map (of application code sections), procedures, registers,special variables, Symbol tables. If string is present, then list only thoseitems that start with string.In the second case, list the values of all parameters and locals of thefunction func. Without a function, this command lists all parameters andlocals of the current function in view.In the third case, list all parameters and locals of the function at depthstack.REFERENCEThe l f and l m commands also show the address of the modules’ firstprocedure. The l m command is identical to l f, list files, but the list offiles is sorted on ascending segment addresses. func must be a functionon the stack or the current function.
Command Reference13−139For configurations that support real−time kernels, the l k command canhave one of the following arguments (l k is the same as specifying l k t):t − Display tasks.m − Display mailboxes.q − Display queues.p − Display pipes.s − Display semaphores.e − Display events.h − Display HISRs (High−level Interrupt Service Routines)si − Display signals.ti − Display timers.pm − Display partition memory.dm − Display dynamic memory.r − Display resources.misc − Display miscellaneous information.ExampleTo list defined assertions and the state of the assertion mechanism, type:l aTo list all locals and parameters of the current function, type:l pData is displayed using the normal (/n) format. To list all the parametersand locals of the function fcn, type:l fcnTo list queue information for the current tasks (only if your configurationsupports it), type:L, etl k q• • • • • • • •
13−140Chapter 13loadFunctionLoad a program’s symbol file and download the image part.From the File menu, select Load Symbolic Debug Info... This dialogallows you to specify the file.The command syntax is:load [filename]DescriptionThis command performs the N and dn commands sucessively.Downloading a file only copies the image part into target memory (dn). Itwill not cause <strong>CrossView</strong> <strong>Pro</strong> to re−read symbolic information (N). Theload command does both.This command is not allowed when the target runs in the background.ExampleTo load the symbol table of file demo.abs in <strong>CrossView</strong> <strong>Pro</strong> anddownload the image part, type:dn, Nload demo.absREFERENCE
Command Reference13−141MFunctionList the data currently being monitored.Refer to the Data Window. Each time the program stops, the debuggerevaluates all monitored expressions and displays the results in the DataWindow.The command line syntax is:MDescriptionList all C expressions being monitored by <strong>CrossView</strong> <strong>Pro</strong>. The listingassociates a unique number with each expression. This number is used tospecify the deletion of monitored data.m• • • • • • • •
13−142Chapter 13mFunctionMonitor (watch) an expression. (Also delete a monitor.)From the Source Window, double−click on an expression. A new monitoris created in the Data Window or the Expression Evaluation dialog isopened if the Bypass Expression Evaluation Dialog check box in theData Display Setup dialog is not set. If the latter is the case, click on theAdd Watch button to create a new monitor in the Data Window. Toremove an existing monitor, select the monitor in the Data Window andclick on the Delete Selected Data Item button.The command syntax is:m expnumber m dDescriptionThe m command has two distinct functions. The first monitors the givenexpression. The second deletes the monitoring of the expression specifiedby number.Data monitoring takes place whenever the program stops execution, thatis, for a breakpoint, assertion, single step, or user interrupt (ctrl−C). Inwindow mode, the values of all currently monitored data are displayed inthe Data window. Each piece of monitored data has a unique identifyingnumber that is used when deleting it.REFERENCEExampleTo monitor the value of the variable myvar, type:m myvarTo monitor the address of variable myvar, type:m &myvarTo monitor the element alpha+1 of array, type:m array[alpha+1]
Command Reference13−143To delete expression number 2 of the monitored data, type:2 m dM, b, a, s, R, C• • • • • • • •
13−144Chapter 13mcpFunctionMemory copy.From the Memory Window, click on the Copy Memory button to openthe Copy Memory dialog. Enter the start address and the end address(inclusive) of the memory region you want to copy. Enter the destinationaddress and click on the OK button.The command syntax is:addr_start mcp addr_end, addr_destDescriptionThe mcp command copies a block of target memory starting at addressaddr_start to destination address addr_dest. The size of the memory blockis defined as: ’addr_end − addr_start + 1’. The data item located at addressaddr_end is included in the copy.If your target supports multiple memory spaces then it is legal to copy databetween different memory spaces. Of course addr_start and addr_endmust be located in the same memory space. This command does not haveany effect on code breakpoints.ExampleTo copy the contents of variable buf to address 0x200, type:REFERENCE&buf mcp &buf+sizeof(buf), 0x200mF, mf
Command Reference13−145memgetFunctionRetrieve data from the target into a buffer.The command line syntax is:memget expr,count,buffer_nameDescriptionThe memget command is used to retrieve data from the target system andto store the data in the acquisition buffer buffer_name. Data in theacquisition buffer is of type double. <strong>CrossView</strong> <strong>Pro</strong> will automaticallyhandle data conversion based upon the type of expression expr.Expression expr contains the iterator "$i" which initially starts at 0 andincrements to count−1.Notation convention:"expr" means "expr in which all instances of "$i" are substitutedby "n".To correctly retrieve the data from the target <strong>CrossView</strong> <strong>Pro</strong> needs to knowthe start address, the size of the data elements, and the number of items tofetch. The number of items to fetch from the target is specified by count.The following algorithm is used to fill the acquisition buffer:addr0 = (char *) &expraddr1 = (char *) &exprdelta = addr1 − addr0elem_size = sizeof(expr)type = C−type(expr)for (i = 0; i < count; i++){value = read elem_size MAUs from address addr0 + (i * delta)buffer[i] = convert_to_double(type, value);}• • • • • • • •
13−146Chapter 13Example1. C structure access.struct{double re,im;int f;} data[100];To store the data[x].re values into acquisition buffer $a:memget data[$i].re,100,$aTo store the data[x].im values into acquisition buffer $b:memget data[$i].im,100,$b2. Memory access.To retrieve 18 integer values from memory starting at address 0x100 andstore these in acquisition buffer $buffer:memget ((int[]) 0x100)[$i],3*6,$bufferbufa, bufd, graph, rawmemget.Section 11.5, Data Analysis, in chapter Special Features.REFERENCE
Command Reference13−147mFFunctionMemory single fill.From the Memory Window, click on the Fill Single Memory Addressbutton to open the Single Fill Memory dialog. Enter the start address thememory region you want to fill. Enter one or more expressions separatedby commas and click on the OK button.The command syntax is:addr mF expr [,expr]...DescriptionThe mF command fills target memory with data. The value defined by expis written to address addr in target memory. Multiple exps separated bycommas may be entered. Each exp is written to a subsequent MAU.If your target supports multiple memory spaces then addr may refer to anymemory space.If the sizeof a given exp occupies more than one MAU, only the leastsignificant MAU will be written to memory. This command does not haveany effect on code breakpoints.ExampleTo store value 0x12 at memory location 0x400 and value 0xAB at location0x401, type:0x400 mF 0x12, 0xABmcp, mf• • • • • • • •
13−148Chapter 13mfFunctionMemory fill, repeating the specified pattern until the specified region isfilled.From the Memory Window, click on the Fill Memory button to open theMemory Fill dialog. Enter the start address and end address (inclusive) ofthe memory region you want to fill. Enter one or more expressionsseparated by commas and click on the OK button.The command syntax is:addr_start mf addr_end, expr [,expr]...DescriptionThe mf command fills a block of target memory with a pattern. Thememory region starting at address addr_start and ending at addressaddr_end is filled with the pattern defined by exp [,exp]. Multiple expsseparated by commas may be entered. Each exp is written to a subsequentMAU.The specified pattern is repeated until the end address of memory regionis reached.If your target supports multiple memory spaces then addr may refer to anymemory space.REFERENCEIf the sizeof a given exp occupies more than one MAU, only the leastsignificant MAU will be written to memory. This command does not haveany effect on code breakpoints.ExampleTo store values 0x01 and 0x02 at succeeding memory locations in therange 0x400 to 0x404, type:0x400 mf 0x404, 0x01, 0x02
Command Reference13−149The result of this command is:address: 0x400 0x401 0x402 0x403 0x404value: 1 2 1 2 1mcp, mf• • • • • • • •
13−150Chapter 13msFunctionMemory search.From the Memory Window, click on the Find Memory button to open theSearch Memory dialog. Enter the start address and end address (inclusive)of the memory region you want to search. Enter one or more searchpatterns separated by commas and click on the OK button.The command syntax is:addr_start ms addr_end, expr [,expr]...DescriptionThe ms command searches for a pattern within a block of target memory.The memory region starting at address addr_start and ending at addressaddr_end (inclusive) is searched for the pattern defined by exp [,exp].Multiple exps separated by commas may be entered. Each exp correspondsto a subsequent MAU.If your target supports multiple memory spaces then addr may refer to anymemory space.This command does not have any effect on code breakpoints.REFERENCEExampleSuppose the memory range 0x400 to 0x4ff was filled using the followingcommands:0x400 mf 0x4ff, 00x400 mf 0x404, 1, 2To search for the values 0x01 and 0x02 at memory locations in the range0x400 to 0x4ff, type:0x400 ms 0x4ff, 0x01, 0x02The result of this command is:FOUND pattern at 0x400FOUND pattern at 0x402
Command Reference13−151mcp, mF, mf• • • • • • • •
13−152Chapter 13NFunctionLoad a program’s symbol file.From the File menu, select Load Symbolic Debug Info... This menuitem allows you to specify the file.The command syntax is:N [[path]filename[.abs]]DescriptionLoad the symbol table of the specified file in <strong>CrossView</strong> <strong>Pro</strong>. If no filenameis given, the file being debugged is reloaded. In this case only thebreakpoints set by the user are removed. Monitors, I/O simulation streams,assertions and <strong>CrossView</strong> <strong>Pro</strong> local variables remain active.If a new file (different filename) is loaded, all breakpoints, monitors, I/Osimulation streams, assertions and <strong>CrossView</strong> <strong>Pro</strong> local variables areremoved.If a path is supplied, <strong>CrossView</strong> <strong>Pro</strong> changes its current directory accordingto the specified path. In case a relative search path to source files wasprovided at startup time, <strong>CrossView</strong> <strong>Pro</strong> will search relative to the newworking directory.REFERENCEThis command is automatically executed during <strong>CrossView</strong> <strong>Pro</strong> startupwhen a filename was given on the command line. Use the dn command tosend the associated executable code to the target.ExampleTo load the symbol table of file demo.abs in <strong>CrossView</strong> <strong>Pro</strong>, type:dnN demo.abs
Command Reference13−153nFunctionSet address biasFrom the File menu, select Load Symbolic Debug Info... In the LoadSymbolic Debug Info dialog you can edit the Code address bias field.The command syntax is:n [ addr ]DescriptionSet address bias of overlay files to addr. If no address is given, thendisplay current bias.If a program is to be loaded at a different address than that indicated inthe linked and located (absolute object) file, then the address informationin the debugger’s symbol file will be incomplete, since it does not knowwhere the program is actually going to be loaded. This command willnormalize the addresses by adding the bias to every address.ExampleTo add a bias of 1000 to every address in the code, type:n 1000To display the current bias, type:n• • • • • • • •
13−154Chapter 13nCFunctionSet the viewing position to the next covered block of statements.Use the scroll bar and click on the desired line.The command line syntax is:nCDescriptionIf code coverage is supported by your version of <strong>CrossView</strong> <strong>Pro</strong>, thiscommand enables you to skip to the next block of statements that havebeen executed while the program was running on the target.ExampleTo move the cursor to the next executed block, type:nCnU, pC, pUREFERENCE
Command Reference13−155nUFunctionSet the viewing position to the next not covered block of statements.Use the scroll bar and click on the desired line.The command line syntax is:nUDescriptionIf code coverage is supported by your version of <strong>CrossView</strong> <strong>Pro</strong>, thiscommand enables you to skip to the next block of statements that havenot been executed while the program was running on the target.ExampleTo move the cursor to the next not executed block, type:nUnC, pC, pU• • • • • • • •
13−156Chapter 13oFunctionEnter emulator mode.From the View menu, select Command | Emulator. If you know theemulator−level command language, you can communicate directly with theemulator from this window.The command line syntax is:o stringDescriptionPass string to emulator and show the emulator response.The o command lets you communicate with the emulator directly viaemulator commands.Do not issue one−shot transparency emulator commands that result inlarge output (or otherwise require intervention other than a carriage returnto terminate output). Instead, enter transparency mode first, then issue thecommand.ExampleTo send the string map to the emulator, type:o mapREFERENCE
Command Reference13−157optFunctionSet or display specific options.Option values can be changed in various dialogs and menus.The command line syntax is:opt [ option_name [= option_value]]DescriptionIf no arguments are passed, all options with their current value are listed.By specifying an option’s name, the current value of that option isdisplayed. By specifying an option name followed by a valid value, theoption is set to that new value.The options are a sub−set of <strong>CrossView</strong>’s so−called "special variables". SeeChapter 3, Command Language, for a list of all special variables.ExampleTo display all options, type:optTo disable mixing of disassembly code and source lines in the assemblywindow, type:lopt mixedasm=off• • • • • • • •
13−158Chapter 13PFunctionPrint source lines, including machine addresses.In the Source Window, the machine address of the line at the currentviewing position is displayed in the address field in the upper left corner.The command line syntax is:[ line ] P [ exp ]DescriptionPrint exp lines of source starting at line line, including machine addresses.If exp is omitted, print one line. If line is omitted, start from the currentviewing position.ExampleTo print source lines 4, 5, 6, 7 and 8 (displaying machine addresses) of thecurrent source file, type:p4 P 5REFERENCE
Command Reference13−159pFunctionPrint source lines.C source is displayed in the Source Window.The command line syntax is:[ line ] p [ exp ]DescriptionPrint exp lines of source starting at line line. If exp is omitted, print oneline. If line is omitted, start from the current viewing position.ExampleTo print source lines 4, 5, 6, 7 and 8 of the current source file, type:P4 p 5• • • • • • • •
13−160Chapter 13pCFunctionSet the viewing position to the previous covered block of statements.Use the scroll bar and click on the desired line.The command line syntax is:pCDescriptionIf code coverage is supported by your version of <strong>CrossView</strong> <strong>Pro</strong>, thiscommand enables you to skip to the previous block of statements thathave been executed while the program was running on the target.ExampleTo move the cursor to the previous executed block, type:pCnC, nU, pUREFERENCE
Command Reference13−161pdFunctionDisable, turn off, profiling.From the Tools menu, select <strong>Pro</strong>filing if this item was set.The command line syntax is:pdDescriptionIf profiling is supported by your version of <strong>CrossView</strong> <strong>Pro</strong>, this commanddisables the profiling system. Normally, you should disable profiling if youare not interested in the profiling results, as this will often improve theperformance of the execution environment.ExampleTo disable profiling, type:pepd• • • • • • • •
13−162Chapter 13peFunctionEnable, turn on, profiling.From the Tools menu, select <strong>Pro</strong>filing if this item was not set.The command line syntax is:peDescriptionIf profiling is supported by your version of <strong>CrossView</strong> <strong>Pro</strong>, this commandenables the profiling system. Normally, you should disable profiling if youare not interested in the profiling results, as this will often improve theperformance of the execution environment.ExampleTo enable profiling, type:pdpeREFERENCE
Command Reference13−163proinfoFunctionList profiling results.From the Tools menu, select <strong>Pro</strong>filing Report...Make your changes and select the Update button.The command line syntax is:proinfo [[all | module_or_function_name][,filename]]DescriptionIf profiling is supported by your version of <strong>CrossView</strong> <strong>Pro</strong> and profiling isenabled, this command lists the profiling results. Without arguments (sameas all) this command lists the profiling information of all modules andfunction.Instead of listing the results you can also save the results in a file withextension .pro.Normally, you should disable profiling if you are not interested in theprofiling results, as this will often improve the performance of theexecution environment.ExampleTo list the profiling results of all modules and functions to the outputwindow, type:peproinfoTo list profile information of function main to the output window, type:proinfo mainTo list profile information of all modules and functions in file hello.pro,type:proinfo all,hello.procproinfo, pd, pe• • • • • • • •
13−164Chapter 13prstFunctionReset the application being debugged to initial conditions. That is, set theprogram counter to the start address of the application.From the Run menu, select Reset Application.The command line syntax is:prstDescriptionThe program counter is set to the start address of the application beingdebugged. This command does NOT perform a hardware reset of thetarget system. That is, no registers are modified except for the programcounter.This command is not allowed when the target runs in the background.R, rstREFERENCE
Command Reference13−165pUFunctionSet the viewing position to the previous not covered block of statements.Use the scroll bar and click on the desired line.The command line syntax is:pUDescriptionIf code coverage is supported by your version of <strong>CrossView</strong> <strong>Pro</strong>, thiscommand enables you to skip to the previous block of statements thathave not been executed while the program was running on the target.ExampleTo move the cursor to the previous not executed block, type:pUnC, nU, pC• • • • • • • •
13−166Chapter 13QFunctionQuiet breakpoint reporting.The command line syntax is:QDescriptionIf this appears as the first command in a breakpoint’s command list, thedebugger does not make the usual announcement of:function: line number: source filewhen the breakpoint is hit.The purpose of this command is to allow quiet breakpoint reporting. Forexample, to check the value of a variable without cluttering the screenwith text.ExampleIf you type the following:21 b {Q; var1}<strong>CrossView</strong> <strong>Pro</strong> will set a breakpoint at line 21. When that breakpoint is hit,<strong>CrossView</strong> <strong>Pro</strong> will print the value of var1, but will not print the currentfunction, line number, and source file.REFERENCEb
Command Reference13−167qFunctionQuit a debugging session.From the File menu, select Exit.The command line syntax is:q [ s | y ]Description<strong>CrossView</strong> <strong>Pro</strong> will prompt you if you really want to quit if you do notspecify anything. Note that the current desktop settings are NOT savedthen!Typing q s saves the current desktop settings and quits the debuggerwithout confirmation.Typing q y does not save the current desktop settings and quits thedebugger without confirmation.Inside a command line procedure call it will just quit from this.When the target runs in the background <strong>CrossView</strong> <strong>Pro</strong> will first stop thetarget.• • • • • • • •
13−168Chapter 13RFunctionReset program and begin execution from initial conditions.From the Run menu, select Reset Application and then Run.The command line syntax is:RDescriptionReset the application being debugged and begin execution from initialconditions. The program counter is set to the start address of theapplication being debugged. This command does NOT perform ahardware reset of the target system. That is, no registers are modifiedexcept for the program counter.This command is not allowed when the target runs in the background.C, g, prstREFERENCE
Command Reference13−169rawmemgetFunctionRetrieve data from the target into a buffer.The command line syntax is:rawmemget address,type,count,buffername [,interleave]DescriptionThe rawmemget command is used to retrieve data from the target systemand to store the data in the acquisition buffer buffername. Data in theacquisition buffer is of type double. <strong>CrossView</strong> <strong>Pro</strong> will automaticallyhandle data conversion based upon the type of the data. It reads countelements of type type from the target starting at address address into thebuffer.interleave indicates the distance between successive elements. The defaultvalue is sizeof(type).ExampleTo retrieve 18 integer values from memory starting at address 0x100 andstore these in acquisition buffer $buffer:rawmemget 0x100,int,3*6,$bufferbufa, bufd, graph, memget.Section 11.5, Data Analysis, in chapter Special Features.• • • • • • • •
13−170Chapter 13rstFunctionReset target system to initial conditions.From hte Run menu, select Reset Target System.The command line syntax is:rstDescriptionThe target is initialized according to the power−up sequence for theprocessor. Almost all registers, including the system stack pointer andprogram counter are initialized.A target system reset may have undesired side effects. To be sure that theapplication code is correct, a download must be performed after a targetsystem reset.This command is not allowed when the target runs in the background.R, prstREFERENCE
Command Reference13−171SFunctionSingle step C statements, stepping over function calls.To step over a function, click on the Step Over button in the SourceWindow. You can also select Step Over from the Run menu. Check theStep Mode menu item in the Run menu: Source line step must beselected.The command line syntax is:[ exp ] SDescriptionIf you try to step over a call to a function which contains a breakpoint (orwhich calls another function with a breakpoint) then the breakpoint willbe hit.Stepping over a function means that <strong>CrossView</strong> <strong>Pro</strong> treats function calls asa single statement and advances to the next line in the source. This is auseful operation if a function has already been debugged or if you do notwant to take the time to step through a function line by line.When multiple statements are present on one line, they are all executed bythis single step.This command is not allowed when the target runs in the background.ExampleTo step one C statement, type:STo step five C statements, type:5 SC, s, si, Si• • • • • • • •
13−172Chapter 13sFunctionSingle step C statements, stepping into function callsTo step into a function (single step), click on the Step Into button in theSource Window. You can also select Step Into from the Run menu. Checkthe Step Mode menu item in the Run menu: Source line step must beselected.The command line syntax is:[ exp ] sDescriptionSingle step exp (default is 1), C statements, stepping into function calls.Stepping into a function means that <strong>CrossView</strong> <strong>Pro</strong> enters the function andexecutes its prologue machine instructions halting at the first C statement.When the end of the function is reached, <strong>CrossView</strong> <strong>Pro</strong> brings you backto the line after the function call. The debugger changes the source codefile displayed in the Source Window, if necessary.This command is not allowed when the target runs in the background.ExampleTo step one source instruction, type:REFERENCEsTo step five source instructions, type:5 sC, S, si, Si
Command Reference13−173saveFunctionSave macros.From the Tools menu, select Macro Definitions... to open the MacroDefinitions dialog box. From this dialog box, you can save macros withthe Save button. To save macro definitions in a file other than the currentone, click on the Save as... button.The command line syntax is:save fileDescriptionSave all currently defined macros in the specified file. This file is in theformat of a sequence of set commands, and thus can be loaded byreading it as a playback file. See the < and
13−174Chapter 13setFunctionDefinition and display of macros.To create a macro, select Macro Definitions... from the Tools menu.Click on the New... button and add a new macro.The command line syntax is:set [ name [ "cmds" ] ]DescriptionThe set command allows for definition and display of macros. If name andcmds are supplied, a macro entry is made associating the name with thecommands. If only name is supplied, the body of the specified macro isdisplayed.If no arguments are supplied the names of all currently defined macros aredisplayed. Macro definitions must contain the body of the macro in doublequotation marks.Macros may take arguments. In the body of a macro formal arguments arereferred to as $n, where n is the argument number starting from 1.It is important to understand that macro expansion takes place for allnames. Therefore, if you wish to pass the name of an existing macro to acommand, such as set, you must escape it with ’!’, to keep <strong>CrossView</strong> <strong>Pro</strong>from expanding the name.REFERENCEExampleTo display the names of all currently defined macros, type:setTo display the body of the macro named macro, type:set macro!To define macro to be a macro which lists the registers then enters thefunction given by its first argument, type:set macro "l r; e $1"
Command Reference13−175To invoke this macro, you might type, for example:macro(main)unset, echo, save, !• • • • • • • •
13−176Chapter 13SiFunctionSingle step machine instructions, stepping over subroutine callsFrom the Run menu, select Step Mode | Instruction step. Then click onthe Step Over button in the Source Window, or select Step Over from theRun menu.The command line syntax is:[ exp ] SiDescriptionSingle step exp (default is 1) machine instructions, stepping oversubroutine calls.If you try to step over a call to a subroutine which contains a breakpoint(or which calls another subroutine with a breakpoint) then the breakpointwill be hit.The next instruction to be executed is shown as a disassembledinstruction, not as a C statement.This command is not allowed when the target runs in the background.ExampleTo step one machine instruction, type:REFERENCESiTo step five machine instructions, type:5 SiC, s, S, si, R
Command Reference13−177siFunctionSingle step machine instructions, stepping into subroutine callsFrom the Run menu, select Step Mode | Instruction step. Then click onthe Step Into button in the Source Window, or select Step Into from theRun menu.The command line syntax is:[ exp ] siDescriptionSingle step exp (default is 1), machine instructions, stepping intosubroutine calls.The next instruction is shown as a disassembled instruction, not as a Cstatement.This command is not allowed when the target runs in the background.ExampleTo step one machine instruction, type:siTo step five machine instructions, type:5 siC, s, S, Si, R• • • • • • • •
13−178Chapter 13stFunctionStop the execution of the target immediately.The command line syntax is:stDescriptionThis command stops the running process immediately.Not available for all execution environments.CB, wtREFERENCE
Command Reference13−179TFunctionStack trace with local variablesThe command line syntax is:[ exp ] TDescription<strong>Pro</strong>duce a trace of functions on the stack and show local variables. Onlythe first exp levels of the stack trace will be displayed. If exp is omitted, allof the levels of the stack trace (up to 20) will be printed.This command works independently of the Stack Window.This command is not allowed when the target runs in the background.ExampleTo print out a stack trace of 20 levels with corresponding local variables,type:TTo print out the top five levels of the stack trace with corresponding localvariables, type:5 Te, l, t• • • • • • • •
13−180Chapter 13tFunctionStack trace.From the View menu, select Stack. The Stack Window shows the currentsituation in the stack after the program has been stopped. It displays thefollowing information for each stack frame:• The name of the function that was called• The value of all input parameters to the function• The line number in the source code from which the function wascalledThe command line syntax is:[ exp ] tDescription<strong>Pro</strong>duce a trace of functions on the stack.exp specifies the number of levels of the stack trace to be displayed. Ifomitted, up to 20 levels of the stack trace will be printed.Each stack level shown in the Stack Window is displayed with its levelnumber first. The levels are numbered sequentially from zero. That is, thelowest/last level in the function call chain is always assigned zero.This command is not allowed when the target runs in the background.REFERENCEExampleTo print out a stack trace of 20 levels, type:tTo print out the top five levels of the stack trace, type:5 te, l, T
Command Reference13−181tdFunctionDisable, turn off, trace.From the Tools menu, select Trace if this item was set.The command line syntax is:tdDescriptionIf trace is supported by your version of <strong>CrossView</strong> <strong>Pro</strong>, this commanddisables tracing (both instruction level, high level and raw). Trace isautomatically disabled when you close the Trace Window.ExampleTo disable tracing, type:tetd• • • • • • • •
13−182Chapter 13teFunctionEnable, turn on, trace.From the Tools menu, select Trace if this item was not set.The command line syntax is:teDescriptionIf trace is supported by your version of <strong>CrossView</strong> <strong>Pro</strong>, this commandenables tracing (both instruction level, high level and raw). Trace isautomatically enabled when you open a Trace Window.ExampleTo enable tracing, type:tdteREFERENCE
Command Reference13−183uFunctionToggle the updating of the appropriate window when the target runs inthe background.The command line syntax is:[interval] u [d|k|r|s|a|mem|t]DescriptionThe following windows can be updated:d (Data), k (Stack), r (Register),s (Source), a (Assembly), mem (Memory), t (Trace)With interval you can specify the update interval (in seconds). If intervalis zero, no window is automatically updated.The updating of the Data Window is ON at startup, the others are OFFIf all windows are being updated and/or many monitor commands areactive it will increase the load on the communication between <strong>CrossView</strong><strong>Pro</strong> and the target.This command is not available if the background mode is not supported(check the addendum).ExampleTo toggle the updating of the Register Window, type:u rTo toggle the updating of the Source Window, type:u sTo disable period updating, type:0 uCB, ubgw• • • • • • • •
13−184Chapter 13ubgwFunctionUpdate the appropriate window when the target runs in the background.From the View menu, select Background Mode and select one of therefresh options.The command line syntax is:ubgw [ s | a | k | r | d | mem | t | all ]DescriptionThe following windows can be updated:s (Source), a (Assembly), k (Stack), r (Register), d (Data), mem(Memory), t (Trace), all (all open windows)Without an argument, the ubgw command refreshes all windows selectedby the background mode (u command).The ubgwall command refreshes all open windows.This command is not available if the background mode is not supported(check the addendum).ExampleTo update the Source Window, type:REFERENCEubgw sTo update the Memory Window, type:ubgw memu
Command Reference13−185unsetFunctionDelete a macro definition.From the Tools menu, select Macro Definitions... to open the MacroDefinitions dialog box. Highlight the name of the macro and click on theDelete button.The command line syntax is:unset [ name !]DescriptionThe unset command deletes a macro. If name is supplied, the specifiedmacro is deleted. If no arguments are supplied, all currently definedmacros are deleted after <strong>CrossView</strong> <strong>Pro</strong> confirms your intent.It is important to understand that macro expansion takes place for allnames. Therefore if you wish to pass the name of a macro to a command,for example unset, you must escape it with ‘!’, to keep from expandingthe name.ExampleTo delete all macros, type:unset<strong>CrossView</strong> <strong>Pro</strong> will first ask for confirmation. To delete all the macrodefinitions at the same time, click on the Delete all button in the MacroDefinitions dialog box.To delete the macro named macro, type:unset macro!set, echo, save, !• • • • • • • •
13−186Chapter 13updateFunctionUpdate a Data Analysis window.Click on the Update Data Analysis Window button in a Data Analysiswindow.The command line syntax is:update "window"DescriptionUpdate Data Analysis window window by issuing a sequence of updatecommands. These update commands were added with thegraph_add_update command.When you use the update command in a complex breakpoint, you shouldappend a ’!’ character to prevent early macro expansion.ExampleTo retrieve data and show it in window demo, type:graph_clear_updates "demo"graph_add_update "demo",memget data[$i],100,$buffergraph_add_update "demo",graphm "demo","show_x_t.cxl"graph_add_update "demo",graph "demo","x_t.cxl",$buffer,0,1update "demo"REFERENCETo update window demo as part of a complex breakpoint, type:0x100 bi {update! "demo"}graph_add_update, graph_clear_updates.Section 11.5, Data Analysis, in chapter Special Features.
Command Reference13−187useFunctionChange source directories run−time.From the Target menu, select Settings... to open the Target Settingsdialog box. Click on the Configure... button and specify the names of thedirectories containing your source files. Relative paths are allowed.The command line syntax is:use [ path ]...DescriptionThe use command changes the source directories. Without a path thiscommand empties the search path, except for the path . (currentdirectory). If one or more paths are supplied, this command adds the,semicolon separated, paths to the list of searched directories. Relativepaths are allowed.ExampleTo clear the source directory path, type:useTo search for source files in the directory /project/src and in the srcdirectory relative to your current directory, type:l duse /project/src;../src• • • • • • • •
13−188Chapter 13wtFunctionWait for the completion of the target.The command line syntax is:wtDescriptionThis command can only be used if the target runs in the backgroundmode.This command waits for the running process to stop.Waiting can be interrupted by typing ctrl−C. The target continues to runwithout interruption. It could be that some informational messages fromthe target are displayed in the command window. They can be ignored.Not available for all execution environments.CB, stREFERENCE
Command Reference13−189xFunctionForce an exit from assertion mode.The command line syntax is:[ exp ] xDescriptionNormally this command stops execution immediately, but if exp is presentand its value is non−zero, then <strong>CrossView</strong> <strong>Pro</strong> finishes executing the entirecommand list of the current assertion.ExampleTo define an assertion to stop the program when the value of globalvariable myvar exceeds 10, type:a if (myvar > 10) {x}To define an assertion to suspend the assertion mechanism and continueprogram execution when global variable myvar exceeds 10, type:a, A, la if (myvar > 10) { A s; 1 x; C}• • • • • • • •
13−190Chapter 13ZFunctionToggle case sensitivity in searchesFrom the Edit menu, select Search String... to open the Search Stringdialog box. This dialog contains the Case Sensitive check box.The command line syntax is:ZDescriptionToggle case sensitivity in searches. The initial state of this toggle dependson information in the currently loaded absolute file. Use the I command tofind out the state of the case sensitivity.This command affects everything: file names, function names, variablesand string searches./, ?REFERENCE
CHAPTERERROR MESSAGES14
ERRORS14−2Chapter 14CHAPTER14
Error Messages14−314.1 WHAT THIS CHAPTER COVERSThe following is a list of common user error messages, and somesuggested ways to solve the problem.<strong>CrossView</strong> <strong>Pro</strong> is a complex program running on several hosts. From timeto time, slight differences between the documentation and the program’soperations do occur. The list of errors presented below and the suggestedremedies may not be, therefore, entirely comprehensive.If you get a message that begins with "XVW Error" or "XVW Fatal Error"please contact TASKING technical support for help.14.2 ERROR MESSAGES(in alphabetical order):"member−name" is not defined for "enum enum"You cannot assign or compare an enum type with a name that is not in theenumeration’s members. Try casting the enum to a different type.’save’ must have a filename; type ’help save’ for more informationThe save command requires a file to be supplied. Note: if the supplied filename already exists, it will be overwritten.*** Fatal XVW error<strong>CrossView</strong> <strong>Pro</strong> has detected a error which it can not handle. If informationis displayed, you may be able to detect the source of the error and correctit. Otherwise, if the message persists, please contact TASKING TechnicalSupport.0xvalue is an invalid value. The register register is unchanged.The value supplied is incorrect for the specified register. Verify that boththe value and the register are correct and retry.Adding 2 pointers not allowedYou cannot add two pointers together in an expression. If you intended toadd to a pointer, make sure that the argument is a value, not anotherpointer.• • • • • • • •
14−4Chapter 14Address not allowed for ’! or ~ or % operator’The "Not", "One’s complement", and "Modulus" operators cannot be usedwith an address. If you intended to perform the operation on the contentsof the address, please be sure to dereference the pointer.Addresses not allowed in ’* or / operator’The multiply and divide operators cannot be used with address data. Ifyou intended to perform the operation on the contents of the address,please be sure to dereference the pointer.Addresses not allowed in ’bitwise logical or logical or shift operators’Bitwise logical (&, ^, or |), logical (&& or ||), and shift (>) operatorsonly work on data, not addresses. If you intended to perform theoperation on the contents of the address, please be sure to dereference thepointer.Attempt to set breakpoint at invalid addressThe memory location is not available. If the memory location is not out ofthe target chip’s range, you may need to map the target system’s memoryto allow access to this location.Bad argument to the command commandThe argument you have given to the sio or f command is not allowed.Refer to the Command Reference chapter, for allowable arguments andtheir meanings.Bad assertion number: numberThe number number is not a valid assertion number. List assertions withthe l a (list assertions) command to determine which assertion numbersare valid.ERRORSboth expressions must be addresses for ’relational operator’If one of the expressions is an address type, both expressions for relationaloperators (=, ==, and !=) must be address types. Retry with bothexpressions as either addresses or arithmetic types.Breakpoint is (or at the address of) an <strong>CrossView</strong> internal breakpoint. Itcan not be deleted.You may not install a breakpoint over an <strong>CrossView</strong> <strong>Pro</strong> internalbreakpoint. See Breakpoints and Assertions chapter for more information.
Error Messages14−5com return code=codeThe MS−DOS version of <strong>CrossView</strong> <strong>Pro</strong> received a status condition fromthe monitor communication channel which it can not handle. If thecondition persists, please contact your system administrator, or call theTASKING Technical Support staff for assistance.command takes no arguments.The command command needs no arguments. Refer to the CommandReference chapter, for the command syntax.Can not open file (file)<strong>CrossView</strong> <strong>Pro</strong> could not open the file file. Check the spelling of file andcheck that the file is in the correct directory. You should also check thepermission of file. With MS−DOS, check the CONFIG.SYS file for themaximum number of open files allowed. Increase the number and rebootif necessary.Can not output to input streamAn attempt was made to output to an input stream. The most commoncase is incorrectly setting up your simulated i/o streams. Correct and retry.Can not scroll that windowThe window you have tried to scroll is not scrollable. Examine yourchoice of window and/or your choice of windowing commands.Can’t define macro: out of spaceThere is not enough host memory to add your macro. Eliminate one ormore unused macros before adding a new one.Can’t expand macro: out of spaceThere is not enough host memory to expand your macro. Eliminate one ormore unused macros before adding a new one.Can’t monitor data: out of space<strong>CrossView</strong> <strong>Pro</strong> cannot add any more variables or expressions to monitor.You must delete one or more variables or expressions before adding anymore.• • • • • • • •
14−6Chapter 14Can’t open logfile−name as log file<strong>CrossView</strong> <strong>Pro</strong> could not open the specified host−to−target systemcommunications logfile. Check the spelling of logfile−name and thatlogfile−name is in the correct directory. Check permissions oflogfile−name. With MS−DOS, check the CONFIG.SYS file for the maximumnumber of open files allowed. Increase the number and reboot ifnecessary. Make sure the filename is valid for the host Operating System.Can’t open output−file−name as output file<strong>CrossView</strong> <strong>Pro</strong> could not open the specified output file. Check the spellingof output−file−name and that output−file−name is in the correct directory.Check permissions of output−file−name. With MS−DOS, check theCONFIG.SYS file for the maximum number of open files allowed. Increasethe number and reboot if necessary. Make sure the filename is valid forthe host operating system.Can’t open playback−file−name as playback file<strong>CrossView</strong> <strong>Pro</strong> could not open the specified playback file. Check thespelling of playback−file−name and that playback−file−name is in thecorrect directory. Check permissions of playback−file−name. WithMS−DOS, check the CONFIG.SYS file for the maximum number of openfiles allowed. Increase the number and reboot if necessary. Make sure thefilename is valid for the host operating system.Can’t open record−file−name as record file<strong>CrossView</strong> <strong>Pro</strong> could not open the specified recording file. Check thespelling of record−file−name and that record−file−name is in the correctdirectory. Check permissions of record−file−name. With MS−DOS, checkthe CONFIG.SYS file for the maximum number of open files allowed.Increase the number and reboot if necessary. Make sure the filename isvalid for the host operating system.ERRORSCan’t open file ’file’<strong>CrossView</strong> <strong>Pro</strong> could not open the specified file. Check the spelling of fileand that file is in the correct directory. Check permissions of file. WithMS−DOS, check the CONFIG.SYS file for the maximum number of openfiles allowed. Increase the number and reboot if necessary. Make sure thefilename is valid for the host operating system.
Error Messages14−7Can’t perform trace, out of memoryThere is not enough host memory to support tracing. Reduce memorydemands and retry again. If the problem persists, please contact theTASKING Technical Support staff for assistance.Can’t set breakpoint; either the current file has no symbols, or lineline# is not inside any procedure in the current file.<strong>CrossView</strong> <strong>Pro</strong> was unable to set the breakpoint that you specified. Firstcheck the location of line line# and verify that it is in the currentprocedure being debugged. If it is within the current procedure, then youmay need to compile/assemble/link/locate for debugging. Refer to chapterOverview for details.Can’t start a new process. Feature not implemented.Your host system does not support shell commands. Any attempt to issueshell commands will cause this message to be displayed.Can’t write to a read−only SFR.The SFR register is a read−only register. It can not be set or altered.Cannot allocate memory for symbol tableAllocating memory for storing the symbol table failed. Remove some tasksfrom memory or add more memory to your computer system.Cannot allocate symbol table memory buffersThe symbol table is too large for <strong>CrossView</strong> <strong>Pro</strong>. You may need toselectively compile with the −g switch only those files and procedures thatmost interest you.Cannot allow that combination of operand(s) and operatorThe operand(s) is/are incompatible for this type of operation. Forexample, you may not add two structures. Please verify the operation anddata types you are using.Character constant is missing ending ’Character constants must be delimited with single quotes. Example: ’a’.• • • • • • • •
14−8Chapter 14Command ’command’ not allowed while emulator running inbackgroundThe target is running, this command is not allowed unless the target isstopped. See the st command.couldn’t error−messageVMS is reporting a condition that <strong>CrossView</strong> <strong>Pro</strong> can not handle. If thecondition persists, please contact your system administrator, or call theTASKING Technical Support staff for assistance.Data already being monitored "task−id":‘symbol ’The variable or expression symbol is already being monitored by<strong>CrossView</strong> <strong>Pro</strong>. You do not need to enter it again.Display format requiredThe display command expected an output format option that was notsupplied. See chapter Command Language for valid format options andtheir meanings.Double not allow in ’% or ~ operator’You may not use the one’s complement or modulus operators on doublefloating point types.Double not allow in ’bitwise operator’You may not use bitwise operators (&, ^ and |) on double floating pointtypes.ERROR: you must enter ?,i,r,d<strong>CrossView</strong> <strong>Pro</strong>’s line editor only supports the following commands: ?−help,i−insert, r−replace, d−delete, and to execute command.ERRORSEstablish a file context first.The command executed requires an active file. Verify the file you specifiedto <strong>CrossView</strong> <strong>Pro</strong> on start up.Establish a procedure context firstThe command executed requires an active procedure. Either execute thecommand from within a procedure, or give a procedure name as anargument to the command.
Error Messages14−9Exiting procedure call stateAn unknown system signal caused the end of a command line functioncall.Expecting stream numberThe following forms of the sio command expect a stream number:stream sio {i|o} {file|screen}stream sio dstream sio p promptExpression garbagedThe symbol table contains a type that is unknown to <strong>CrossView</strong> <strong>Pro</strong>.Please verify that you are using the compiler and utilities supplied to you.If the condition persists, please contact the TASKING Technical Supportstaff for assistance.file has already been edited, going to NEW fileThe command executed requires that the file be edited only once. A newfile has been created.failed to allocate the SIO tablesEntries for recording simulated input/output information could not beallocated due to lack of host memory. Please contact your systemadministrator, or call the TASKING Technical Support staff for assistance.Float not allowed in ’% or ~ operator’You may not use the modulus or one’s complement operators on floatingpoint types. Change the data type to an appropriate type, for example,integer.Float not allowed in ’bitwise or shift operator’You may not use the bitwise (&, ^, or |) or shift (>>, or
14−10Chapter 14I can’t put something that big in the child processThe size of the expression exceeds the buffer size needed to spawn achild process. Be sure you have linked end.c in your application. Thismodule implies space for <strong>CrossView</strong> <strong>Pro</strong> in your execution environment.Refer to section Building Your Executable in chapter Overview. If thiscondition persists, please contact the TASKING Technical Support staff forassistance.I don’t have symbols for this procedureYou will need to re−compile, assemble, link and locate with the properdebugging options before using this command. See section Building YourExecutable in chapter Overview for details.I have no source file for this addressThe program counter holds an address which is outside all the addressranges that <strong>CrossView</strong> <strong>Pro</strong> knows about. This may happen if programexecution has reached a file that was not compiled with the −g generatedebug symbols switch.I need a linenumberThe go g command requires a line number. Enter a line number and thecommand will be executed.Illegal address for Emulator Hardware BreakpointThe address specified is out of emulator hardware breakpoint memoryrange. Verify the address and retry.Illegal argument ("0") to ’p’ commandYou must specify a number greater than 0 for the p command, whichprints the specified number of lines.ERRORSIllegal argument to ’command’ command: ’argument’You have passed an illegal argument to the specified command. Refer tochapter Command Reference for legal arguments.Illegal argument to ct: ’argument’You have passed an illegal argument to the C−trace command. Refer tochapter Command Reference for legal arguments.
Error Messages14−11Illegal data monitor commandYou have passed an illegal argument to the m data monitor command.Legal commands are:m exp to set up monitoringid m d to delete monitoring of a specific expressionsm d to delete monitoring of all expressionsIllegal third arg to set: ’argument’The set command may have only two arguments: the name by which themacro is known and the command string to be executed when the macrois invoked. Enclose the command string in quotes, separating theindividual commands with semicolons. Refer to chapter CommandReference for more information.Improper floating point format lengthYou have specified a format length that is inconsistent with floatingnumbers. Legal lengths are 4 and 8 bytes.Improper integer format lengthYou have specified a format length that is inconsistent with integernumbers. Legal length are 1, 2, and 4 bytes. You may also choose b, s, or lfor 1, 2, and 4 byte integers.Improper string format lengthYou have specified a format length that is inconsistent with characterstrings. Choose a positive number.Input buffer overflow<strong>CrossView</strong> <strong>Pro</strong> is over−running the input buffer. Contact your systemadministrator to either increase the input buffer or lower thecommunication line baudrate.Input communications buffer overflow on COM port<strong>CrossView</strong> <strong>Pro</strong> is over−running the input buffer. Contact your systemadministrator to either increase the input buffer or lower thecommunication line baudrate.• • • • • • • •
14−12Chapter 14Input from stdin longer than max−input−size characters: input−stringCommand truncatedThe input data is longer that the input buffer, therefore the data wastruncated at max−input−size. Try to reduce the input data and/orcommands.Internal error while setting an instruction level breakpointIf this error condition persists, please contact the TASKING TechnicalSupport staff for assistance.Invalid assertion maintenance commandYou have entered an illegal assertion command. Valid commands are:a a to activate assertionsa d to delete assertionsa s to suspend assertionsInvalid value for uplevel break.You have entered an illegal value for an uplevel break. The form of thecommand is exp bU or exp bU, where exp determines how many returnsfrom functions should occur before the break. Execute the t command tofind out how many levels down in the stack you are, then choose anappropriate value for the uplevel break. See chapter Command Referencefor more information.Invoking procedure calls not allowed while emulator is running in thebackgroundThe target is running, this command is not allowed unless the target isstopped. See the st command.ERRORSMacro Expansion error: expansion looping<strong>CrossView</strong> <strong>Pro</strong> looped 50 times while trying to expand this macro withoutcompleting the expansion. Check the logic of the macro arguments. It mayneed to be corrected or simplified.Macro Expansion error: expansion too largeThe macro expansion exceeds 200 commands. The macro must besimplified.
Error Messages14−13Macro Expansion error: missing ’(’See the command reference page or use the help command to reviewmacro command syntax.Macro Expansion error: missing ’)’See the command reference page or use the help command to reviewmacro command syntax.Macro Expansion error: missing ’,’See the command reference page or use the help command to reviewmacro command syntax.Macro Expansion error: not enough argsSee the command reference page or use the help command to reviewmacro command syntax.Macro Expansion error: out of spaceThere is not enough memory to expand the macro. Eliminate one or moreunused macros before adding a new one.Maximum trace size is: max−trace−size<strong>CrossView</strong> <strong>Pro</strong> can perform C tracing only up to max−trace−size sourcelines. Choose a number less than max−trace−size with the ct command.Missing { after if commandThe required format for the if command is: if exp {commands}Missing file name or ’screen’The sio command was missing a required parameter for setting up asimulated i/o stream. See chapter Command Reference for commanddefinition and format.Missing format characterYou did not specify a display format type with your command. Eitherremove ’/’ from the command, or add a format character.Missing prompt stringYou did not specify a prompt string with the sio command. Either removep from the sio command, or add a prompt string.• • • • • • • •
14−14Chapter 14Must supply ’b’ or ’f’The color command requires a value of f for foreground or b forbackground to modify the screen color.Must supply ’r’,’w’ or ’b’Both the data range (bD) and data (bd) breakpoint commands require thetype of data modification to generate a break condition. Use r for read, wfor write, and b for both read/write. Please see chapter CommandReference for more information.Must supply data to be monitoredYou did not specify a variable or expression to the m monitor command.Please provide a variable or expression to be monitored, for example, mmyvar.Must supply second address with bD command.The bD command requires two addresses. Either specify an upper limit ifyou want to break anywhere in memory range, or use the bd command ifyou want to break on an individual address.Negative /baudrate value ignored. (VAX)orNegative baud rate (−S) value ignored.The baudrate specified was a negative value. Please specify a legal valueor use the default.Negative /TIMEOUT value ignored. (VAX)orNegative timeout interval (−I) value ignored.The time out value specified was negative. Please specify a legal timeoutvalue or use the default.ERRORSNo child processThe <strong>CrossView</strong> <strong>Pro</strong> internal data structure containing user informationabout child processes is not as expected. Please contact the TASKINGTechnical Support staff for assistance.No current fileUndefined special variable, $file; probably due to debugging where nosymbols are present.
Error Messages14−15No current line numberUndefined special variable, $line; probably due to debugging where nosymbols are present.No current procedureUndefined special variable, $proc; probably due to debugging where nosymbols are present.No host memoryThere is not enough space in memory to execute this command. Checkwhether you have unnecessary processes running in the background orresident in memory.No host memory for commandThere is not enough space in memory to execute this command. Checkwhether you have unnecessary processes running in the background orresident in memory.No macros to save; file not created<strong>CrossView</strong> <strong>Pro</strong> found no macros to save, therefore the save command didnot create a file.No Match − pattern<strong>CrossView</strong> <strong>Pro</strong> did not find the specified pattern in its search of this file.Check your spelling or case−sensitivity. Use the Z command to togglecase−sensitivity if necessary.No memory spaceThere is not enough host memory to execute this command. Checkwhether you have unnecessary processes running in the background orresident in memory.No more hardware breakpoints availableThe target system uses hardware breakpoints to support the databreakpoint function. To continue, you must explicitly delete a databreakpoint before placing a new one.No more room for directories (> max−dir−size)You can reference no more that max−dir−size directories for source files.• • • • • • • •
14−16Chapter 14No more SIO windows, I/O to command window.Only four SIO streams can be displayed simultaneously in the SIOwindow. Subsequent SIO streams’ output will be displayed in thecommand window.No name of symbol file specified<strong>CrossView</strong> <strong>Pro</strong> cannot deduce the name of a symbol file. No filename wasgiven to the N command and no symbol file was currently loaded.No playback name specifiedGive the name of the playback file to be used for this session.No process<strong>CrossView</strong> <strong>Pro</strong> only allows one process to be debugged at the same time.No such breakpointThe breakpoint number was incorrect. List breakpoints with the l bcommand to find the correct breakpoint.No such field name "name" for " name"The field name is not recognized for the specified structure or union.Check the spelling of field name. The /t format will show you the namesand types of a particular structure’s or union’s fields.No Such Line<strong>CrossView</strong> <strong>Pro</strong> can not find the specified line number in any of its knownfiles. Please check the source window or a source listing for legal linenumbers.ERRORSNo such procedure, "name".<strong>CrossView</strong> <strong>Pro</strong> does not recognize name as a procedure name. Check thespelling and whether the file was compiled/assembled/linked/located fordebugging. Check that the file is in the appropriate directory.No such procedure or file name: procedure<strong>CrossView</strong> <strong>Pro</strong> does not recognize procedure as a procedure or file name.Check the spelling and whether the file wascompiled/assembled/linked/located for debugging. Check that the file is inthe appropriate directory.
Error Messages14−17No such PSW register stateCheck register name and selected target.No such registerThe target processor does not have a register with that name.No such sr reg stateCheck register name and selected target.No such streamThe stream you tried to delete does not exist. Check the stream number,correct, and retry.No symbols − unable to determine end−of−procedure<strong>CrossView</strong> <strong>Pro</strong> has no symbol information for this procedure. To facilitatedebugging this procedure, you must compile, assemble, link and locatewith the appropriate switches. Refer to the Overview chapter for details.No symbols available in active procedures.To get symbol information you must compile, assemble, link, and locatewith the appropriate switches. Refer to the Overview chapter for details.No symbols for that procedureTo get symbol information you must compile, assemble, link, and locatewith the appropriate switches. Refer to the Overview chapter for details.No User or System special variable matches prefix nameThe string argument of the l s command did not match any user or systemspecial defined variables. Check spelling and case−sensitivity and retry.You may also enter l s to print out all the user and system special definedvariables.Not enough memory available to start up windows. Either use the −nw(no window) option or remove resident programs from memory.<strong>CrossView</strong> <strong>Pro</strong> has detected that there is not enough host memory toexecute the windowing software. You may need to use the −nw option tostart up <strong>CrossView</strong> <strong>Pro</strong> in line mode. Check whether you haveunnecessary processes running in the background or resident in memory.• • • • • • • •
14−18Chapter 14Not enough memory to execute shell command.The attempt to create a child process for the shell command failed due tothe lack of host memory. Check whether you have unnecessary processesrunning in the background or resident in memory.Not enough memory to start window mode<strong>CrossView</strong> <strong>Pro</strong> has detected that there is not enough host memory toexecute the windowing software. You may need to use the −nw option tostart up <strong>CrossView</strong> <strong>Pro</strong> in line mode. Check whether you haveunnecessary processesNot enough space<strong>CrossView</strong> <strong>Pro</strong> has detected a general error due to lack of host memory.Check whether you have unnecessary processes running in thebackground or resident in memory.Not in known territory. Could not set breakpoint.<strong>CrossView</strong> <strong>Pro</strong>’s current location is not in a file or procedure that it knowsabout. The breakpoint request can not be performed.Not in window modeThe command issued requires <strong>CrossView</strong> <strong>Pro</strong> windows to be active. Usethe WW command and repeat the previous command.Not that many levels active on the stack.A stack level was specified that does not exist. Execute the t command todetermine levels on the stack. See chapter Command Reference for moreinformation.ERRORSOops called with sig = signal−number<strong>CrossView</strong> <strong>Pro</strong> has received a signal that it can not handle. Continuingfrom this point may result in a fatal process condition. If this conditionpersists, please contact your system administrator, or call the TASKINGTechnical Support staff for assistance.Placement of the breakpoint handler must be in one ofthe restart vectors. Choose a value from 0 to 7.Try again. (Hit to exit)?The specified placement for the breakpoint handler was not valid for thistarget. <strong>CrossView</strong> <strong>Pro</strong> is requesting a valid location.
Error Messages14−19<strong>Pro</strong>cedure "name" is not active on the stack.The procedure name was not found on the current stack. Execute the tcommand to list functions which are active on the stack.<strong>Pro</strong>cedure ’name’ is not at that stack depthThe procedure name was not found on the specified stack. Execute the tcommand to list functions which are active on the stack.<strong>Pro</strong>cedure "procedure" is not activeThe procedure procedure was not found on the current stack. Execute thet command to list functions which are active on the stack or l p for list ofprocedures known to <strong>CrossView</strong> <strong>Pro</strong>.<strong>Pro</strong>gram not completely loadedAn error occurred during loading a symbol file. Check what cause theproblem (illegal filename or file format). You may retry to load a symbolfile.<strong>Pro</strong>mpt too long (> max−number)Choose a prompt of no more than max−number characters.Ran out of memory reading symbol file into memoryReduce the size of the symbol file by re−compiling only the "interesting"files with the −g debug switch.Read I/O request could not be queuedVMS detected an error for a read I/O queue which <strong>CrossView</strong> <strong>Pro</strong> can nothandle. If the condition persists, please contact your system administrator,or call the TASKING Technical Support staff for assistance.Readprompt I/O request could not be queuedVMS detected an error for a read I/O queue which <strong>CrossView</strong> <strong>Pro</strong> can nothandle. If the condition persists, please contact your system administrator,or call the TASKING Technical Support staff for assistance.Redo: line too largeLimit line length to fewer than 256 characters.• • • • • • • •
14−20Chapter 14Result type too large for command line call.A command line function call must pass the result back in a register. Thespecified function does not. You cannot call functions whose return valueis greater than an integer, for instance floating point types and structures.Result type undefinedType casting from the expression or variable to the result type was notpossible.Second address smaller then firstWhen specifying a range of addresses for a data breakpoint, the secondaddress must be higher than the first.Sim I/O request too long (>max−number bytes)The I/O request exceeds the maximum length.Simulated I/O stream out of rangeChoose a stream value between 0 and 7.Sorry, the "v" command is not supported on this hostNo visual editor is available on this host.Stream already activeEither choose another stream, or deactivate this one before re−assigning it.String constant is missing ending "String constants must be delimited with double quotes: "ERRORSSubtracting 2 pointers not allowedYou cannot subtract two pointers in an expression. If you intended tosubtract from a pointer, make sure that the argument is a value, notanother pointer.Symbol file is either unreadable or too shortThe symbol file is not an absolute IEEE−695 file, or the file format is notcorrect, or the file is not an IEEE−695 file at all.
Error Messages14−21Symbol file is not formatted correctlyThe symbol file is not intended for the type of microprocessor you areusing.Symbol not in current procedureThere is no symbol by this name in the current procedure. Check thespelling of the symbol name.The ’command’ command accepts no argsThe command command does not accept any arguments. See chapterCommand Reference for more information on command.The window would be too large; Total lines must not be greater thatmax−sizeThe window size options specified would create a window that wouldhave exceeded the screen size. Retry with corrected window size options.There is insufficient information to do a structure dump<strong>CrossView</strong> <strong>Pro</strong> cannot uniquely identify the structure or part of thestructure to be dumped.There is no associated source.The program counter holds an address which is outside all the addressranges that <strong>CrossView</strong> <strong>Pro</strong> knows about. This may happen if programexecution has reached a file that was not compiled with the −g debugswitch.There is no available source line for the current address.$pc= address<strong>CrossView</strong> <strong>Pro</strong> is reporting that the current position has no associatedsource line. This may happen if you are trying to debug a routine that wasnot compiled with −g debug switch or are trying to debug a runtimelibrary routine.This does not appear to be a struct or a unionThe data entered is not recognizable as a structure or union. Check thespecified variable.• • • • • • • •
14−22Chapter 14Timed read I/O request could not be queuedVMS reported a condition on a timed read i/o request that <strong>CrossView</strong> <strong>Pro</strong>could not handle. If the condition persists, please contact your systemadministrator, or call the TASKING Technical Support staff for assistance.Too many args to unset: ’argument’You may specify only one macro at a time, for example, unset name, oryou may remove all macros at once with unset.Too many assertions (>max−number)The maximum number of assertions allowed is max−number as shown inthe error message. Remove a previous assertion before trying to add one,or reinvoke <strong>CrossView</strong> <strong>Pro</strong> with the −a option to increase the maximumnumber of assertions.Too many breakpoints (> max_number)The maximum number of breakpoints allowed is max−number as shownin the error message. You must explicitly delete a breakpoint beforeadding any new ones. Alternatively, you could re−invoke <strong>CrossView</strong> <strong>Pro</strong>with the −b option to increase the maximum number of breakpoints.Too many locals (> max−number)Eliminate some existing locals or reinvoke <strong>CrossView</strong> <strong>Pro</strong> with the −sswitch to increase the number of locals allowed.Too many modulesThe symbol file describes an application that was constructed from morethan 1818 modules.Too many processes (> max−number)<strong>CrossView</strong> <strong>Pro</strong> allows only one process to be debugged.ERRORSToo many streams (> max−number)The maximum number of I/O streams, max−number, has been reached.You must eliminate an I/O stream before adding a new one.Trace size is requiredThe required format of the command is exp ct, where exp is the numberof statements to trace. Re−enter the command with a value for exp.
Error Messages14−23Type ’r ’, to run program from power−on conditions or ’c ’ to continuewith current program pointerThis is to inform you that command r is not implemented and that youshould used r or c.Type of command−line−expression is too complexThe command line function returns a data type that <strong>CrossView</strong> <strong>Pro</strong> cannothandle. An example would be a function returning a structure.Unexpected breakpoint type ’type’<strong>CrossView</strong> <strong>Pro</strong> has encountered a breakpoint with an unknown typeattribute. Verify the previous break commands and re−try. If the conditionpersists, please contact the TASKING Technical Support staff for assistance.Unknown command ‘command’ ()<strong>CrossView</strong> <strong>Pro</strong> does not recognize command, and has echoed thecommand number for Technical Support purposes. Please check thespelling and retry. If the condition persists, please contact the TASKINGTechnical Support staff for assistance.Unknown data monitor id ’number’The monitor number number that you tried to delete does not exist. Usethe M command to list currently monitored variables.Unknown data sizeValid data sizes are 1, 2, 4, or 8 bytes.Unknown display modeSee chapter Accessing Code and Data, for a list of display mode options.Unknown name ’name’Variable name is not in scope or is undefined.Unknown procedure "name".The function name does not exist in any file that <strong>CrossView</strong> <strong>Pro</strong> knowsabout. The file containing name may not have been compiled with the −gdebug switch.• • • • • • • •
14−24Chapter 14Unknown macro ’name’<strong>CrossView</strong> <strong>Pro</strong> does not recognize the macro name as given. Please checkthe spelling. You may list all current macros by using the set commandwith no arguments, or display the Macro window for currently definedmacros.Unknown window<strong>CrossView</strong> <strong>Pro</strong> does not recognize the window name as given. See chapterCommand Reference for valid window arguments.Unsupported format type (parameter)Supported types are c (character), x (hex), and o (octal).Value number is not defined for this enum.The member specified was not part of the enumerated set. Please checkthe spelling and verify that the correct enum was used.Value exceeds depth of stack.A stack level was specified that does not currently exist. Please check thevalue and retry. Check the stack window for valid stack levels, or executea t command (trace stack) to determine the depth of the stack.VMS error : cannot establish handler for signals<strong>CrossView</strong> <strong>Pro</strong> on VMS could not establish proper error handlers. If thecondition persists, please contact the TASKING Technical Support staff forassistance.VMS error : cannot establish pasteboard<strong>CrossView</strong> <strong>Pro</strong> on VMS can not establish the running environment. If thecondition persists, please contact your system administrator, or call theTASKING Technical Support staff for assistance.ERRORSVMS error : cannot establish virtual keyboard<strong>CrossView</strong> <strong>Pro</strong> on VMS can not establish the running environment. If thecondition persists, please contact your system administrator, or call theTASKING Technical Support staff for assistance.
Error Messages14−25VMS error code = number \ Attempt to get message text fail.<strong>CrossView</strong> <strong>Pro</strong> on VMS received an error while attempting to provide anerror diagnostic message from the host error message library. If thecondition persists, please contact your system administrator, or call theTASKING Technical Support staff for assistance.Warning: NULL pointer dereferenceThe expression contained a null pointer dereference. Check the expressionfor possible errors, or verify that the pointer should in fact be null.Warning: pointer dereference with invalid segment selector.The pointer is addressing invalid memory and the dereference may reportunexpected data results. Check the initialization of the pointer or verifythat it has been set correctly.Warning: too few parameters.The command given was not invoked with the proper number ofarguments. <strong>CrossView</strong> <strong>Pro</strong> will supply the command with defaults whichmay or may not produce the result you expected.Warning: Using file−b instead of file−a<strong>CrossView</strong> <strong>Pro</strong> could not find file−a, or file−a’s status was such that<strong>CrossView</strong> <strong>Pro</strong> could not use it. If file−b is not correct, check file−a spellingand its directory.Warning: X=Y: X is x−size bytes and Y is y−size bytesThe assignment of two different size variables may cause unexpectedresults. Please correct the condition if possible. This condition is commonwhen assigning string variables where string y is shorter than string x.Warning: X=Y: X is x−size words and Y is y−size wordsThe assignment of two different size variables may cause unexpectedresults. Please correct the condition if possible. This condition is commonwhen assigning string variables where string y is shorter than string x.• • • • • • • •
14−26Chapter 14Warning: <strong>CrossView</strong> comment terminated by end of command linesource−command−lineThe playback file has a comment that was not terminated. It is by defaultterminated, but if the next line was the continuation of the comment, thenunexpected results may occur. Please terminate comment strings on eachline to avoid this warning.Windows not enabled; use WW to enableThe command issued can only be used when windows are enabled.Write I/O request could not be queued<strong>CrossView</strong> <strong>Pro</strong> received a condition that it could not handle. If thecondition persists, please contact your system administrator, or call theTASKING Technical Support staff for assistance.Write−only register. Value may not be valid.<strong>CrossView</strong> <strong>Pro</strong> set a write−only register but has no way of verifying thecorrectness of the register contents.Wrong storage class for data breakpointYou may not set a data breakpoint at the address of a register variable orspecial variables.<strong>CrossView</strong> could not disassemble the emulator’s trace buffer becausethe address information in the buffer is incorrect.The trace buffer may be corrupted. Re−check the commands leading tothis condition, and retry. If the condition persists, please contact theTASKING Technical Support staff for assistance.ERRORSXVW error − messageorXVW Fatal error − messageThese messages are generated by internal conditions that should notnormally occur. The message is usually encrypted and should be broughtto the attention of the TASKING staff. Please contact the TASKINGTechnical Support staff for assistance.
Error Messages14−27XVW:main − Cannot continue, incomplete initialization.<strong>CrossView</strong> <strong>Pro</strong>’s initialization was interrupted and could not be completed.Please re−start <strong>CrossView</strong> <strong>Pro</strong>, and if the condition persists, contact theTASKING Technical Support staff for assistance.You can’t goto a line outside of the current procedureThe specified line number is outside the current procedure. Change theline number to one within the procedure or enter the correct procedurebefore executing this command.You may not assign from a host system string/arrayThe expression given performs an assignment that <strong>CrossView</strong> <strong>Pro</strong> can notperform at this time.You may not assign from a void functionThe expression attempts to assign a variable from a void function. Pleasecheck the return value of the function and verify that you are referencingthe correct function.You may not assign more than max−size bytes to a special variableAn attempt was made to assign greater than the maximum number ofbytes to a special variable. Check the expression for errors, and check thevariable’s spelling.You may not assign to a constantThe value of a constant cannot be changed. Check the name that you havespecified.You may not mix assignment of a scalar and an aggregateAn attempt was made to assign incompatible types of data. Please checkthe data types and retry.You need to supply a program name.<strong>CrossView</strong> <strong>Pro</strong> requires a program name to debug on the invocation line.• • • • • • • •
ERRORS14−28Chapter 14
CHAPTERGLOSSARY15
GLOSSARY15−2Chapter 15CHAPTER15
Glossary15−315.1 WHAT THIS CHAPTER COVERSThis chapter defines terms common to <strong>CrossView</strong> <strong>Pro</strong> and source−levelembedded systems debugging. Italicized items in definitions are alsoglossary entries.15.2 GLOSSARY TERMSAabsolute file. The IEEE−695 file (.abs) that contains symbolic debuginformation and the final executable code of the target system.active window. The window last selected by the user in <strong>CrossView</strong> <strong>Pro</strong>that commands operate on as a default. An active window’s title appears ina different color (on color monitors) or inverse video (on monochrome).assertion. A command or set of commands to be executed before everyline of source code, assessing the application state on validity. Assertionsare especially useful in tracking down hard to find bugs when othermethods fail. Individual assertions may either be active or suspended. Seealso assertion mode.assertion mode. A mode of <strong>CrossView</strong> <strong>Pro</strong> operation under whichassertions will be executed. Before <strong>CrossView</strong> <strong>Pro</strong> executes a source lineof code, it assesses all assertions active. Since <strong>CrossView</strong> <strong>Pro</strong> is singlestepping, breakpoints will not be effective. As long as there is at least oneassertion active, <strong>CrossView</strong> <strong>Pro</strong> operates in assertion mode. A programrunning in assertion mode will be stopped when an asserted commandexecutes the x (exit assertion mode) command.Bbackground mode. A target dependent feature in <strong>CrossView</strong> <strong>Pro</strong> that letsthe execution environment run and at the same time allows you to enter areduced set of <strong>CrossView</strong> <strong>Pro</strong> commands, for example to monitor memorycontents.• • • • • • • •
15−4Chapter 15bias. A value added to program code addresses to tell <strong>CrossView</strong> <strong>Pro</strong>where the application has actually been loaded into memory. The bias canbe set in the Load Application dialog or with the −n startup option.breakpoint. A mechanism for stopping target program execution, forexample at a particular line of code (see code breakpoint), when amemory address is accessed (see data breakpoint), or at a return from afunction (see up−level breakpoint). There are two general kinds ofbreakpoints. Hardware, which the emulator or on−chip debug supportsets in its circuitry, and software, which are special instructions placed inuser code. Since the number of simultaneous hardware breakpoints islimited in number, <strong>CrossView</strong> <strong>Pro</strong> uses both kinds by default. Other typesof breakpoints are for example instruction count breakpoint, cyclecount breakpoint, timer breakpoint and sequence breakpoint. Seealso probe point.breakpoint window. A <strong>CrossView</strong> <strong>Pro</strong> dialog displaying all breakpoints,and any attached commands.CC−trace window. A <strong>CrossView</strong> <strong>Pro</strong> window keeping a record of the mostrecently executed C or machine statements.cache. Some microprocessors keep a copy of the most recently executedinstructions in on−chip memory to speed−up execution.code breakpoint. A breakpoint that halts program execution when aparticular line of code is reached. A code breakpoint can have a commandlist. A breakpoint can be set on a line of source code or at the address of amachine instruction. See also count.GLOSSARYcode coverage. See coverage.command window. A <strong>CrossView</strong> <strong>Pro</strong> window that gives access to<strong>CrossView</strong> <strong>Pro</strong> via a command line interface with history.command list. A series of <strong>CrossView</strong> <strong>Pro</strong> commands and/or C(assignment) statements attached to a code or data breakpoint, executedwhen the breakpoint is hit.count. The number of times a breakpoint must be hit to finally stopexecution. Breakpoints are created with a count of 1. The C commandmay be used to change the count of a breakpoint.
Glossary15−5coverage. With code coverage the source line is marked for each sourcecode line that is executed. Through code coverage you can find executedand non−executed areas of the application program. Data coverageallows you to verify which memory locations, i.e. which variables, areaccessed during program execution. Additionally, you can see stack andheap usage. The availability of this feature depends on the executionenvironment.cycle count breakpoint. A breakpoint that halts program execution aftera specified number of CPU cycles. A cycle count breakpoint can have acommand list.current function. The function that is currently being executed. Thecurrent function is always at level 0 on the stack. Also stored in the<strong>CrossView</strong> <strong>Pro</strong> special variable $PROCEDURE.Ddata breakpoint. A breakpoint that halts program execution when aparticular memory address (or an address within a particular range) iswritten to, read from, or both. A data breakpoint may have a command listand a count.data coverage. See coverage.data monitoring. <strong>CrossView</strong> <strong>Pro</strong> allows you to monitor expressions andvariables in the Data window. <strong>CrossView</strong> <strong>Pro</strong> updates their valueswhenever execution stops.data window. A <strong>CrossView</strong> <strong>Pro</strong> window displaying the values ofmonitored expressions.diagnostic output. <strong>Pro</strong>gram output designed for debugging purposes.With <strong>CrossView</strong> <strong>Pro</strong>, probe points and data monitoring can be used fordiagnostic output, eliminating the need for intrusive and annoying printfcalls compiled into code.disassembly window. A <strong>CrossView</strong> <strong>Pro</strong> window showing a part of thedisassembled program space. It also displays other information such as thecurrent execution position, viewing position and installed breakpoints.dot operand. The period character "." used in an expression to representthe last value <strong>CrossView</strong> <strong>Pro</strong> calculated. The dot operand is useful asshorthand.• • • • • • • •
15−6Chapter 15Eembedded system. Computer(s) executing an application program builtto run in (semi) real−time. An embedded system usually is part of a larger,non−computer system, hence the term "embedded." The TASKING productline is designed for embedded systems programming.emulator. A device used to monitor and control various aspects of amicroprocessor’s operation. An emulator usually is built around two chips,the target microprocessor and a controlling chip. The controller chip canstart and stop the target chip’s program execution, and can examine andchange registers and memory. An emulator can be connected via a probeto a hardware prototype to fully emulate the behavior of the target chip.See ROM monitor.execution position. The source line to be executed next. See viewingposition.FFile System Simulation (FSS). A facility to redirect all C library file I/Ooperations on the target, to the host system via <strong>CrossView</strong> <strong>Pro</strong>. File systemsimulation is often used to provide input to an application for which nohardware I/O is available yet and to log test results.format. The manner in which <strong>CrossView</strong> <strong>Pro</strong> displays addresses and data;for instance, hexadecimal, character and octal are different formats. Youmay include special format codes when specifying variables.HGLOSSARYhardware breakpoint. See breakpoint.help window. A window explaining the use of <strong>CrossView</strong> <strong>Pro</strong> windowsand dialogs and summarizing the syntax and function of <strong>CrossView</strong> <strong>Pro</strong>commands.history mechanism. A facility for modifying and executing previous<strong>CrossView</strong> <strong>Pro</strong> commands.
Glossary15−7host system. The computer system on which <strong>CrossView</strong> <strong>Pro</strong> is run. Thehost system is connected to the target system, usually with an RS−232cable.Iimage part. This is the downloadable part of the absolute file thatcontains the executable code of the target program. See also absolute file.instruction count breakpoint. A breakpoint that halts programexecution when a number of instructions have been executed. Aninstruction count breakpoint can have a command list.interrupt key. The key that interrupts ongoing processes. On manysystems this is ctrl−C.I/O Simulation. A technique to intercept input and output for debuggingpurposes. I/O Simulation is often used for testing a program before theactual input and output hardware devices are present. See also stream.Llocal variable. A variable that can only be referenced from within itsdefining function.low−level breakpoint. A code breakpoint placed on an individualmachine instruction. Low−level breakpoints can be set with the breakcode address command.Mmacro. A user−created shorthand for a <strong>CrossView</strong> <strong>Pro</strong> commandsequence. Macros can accept parameters and can be saved to a file.main(). The function where a C program’s execution begins. See alsosystem startup code.MAU. See minimum addressable unit.• • • • • • • •
15−8Chapter 15memory map. The configuration of an emulator’s memory that specifieswhich addresses are read−only, and which addresses are read/write. Withmany emulators, you must first set up a memory map before using<strong>CrossView</strong> <strong>Pro</strong>, for example via transparency commands.minimum addressable unit. For a given processor, the amount ofmemory located between an address and the next address. It is notnecessarily equivalent to a word or a byte. Abbreviated MAU.monitoring. See data monitoring.Oobject language. A representation for target machine instructions, withthe ability to represent either relocatable or absolute address locations.on−line help. A complete summary of all <strong>CrossView</strong> <strong>Pro</strong> commands andindividual descriptions available while <strong>CrossView</strong> <strong>Pro</strong> is running.on−line tutorial. A playback file supplied with <strong>CrossView</strong> <strong>Pro</strong> thatdemonstrates <strong>CrossView</strong> <strong>Pro</strong>’s capabilities.output buffer. The location in memory where <strong>CrossView</strong> <strong>Pro</strong> directs I/Osimulation output. See also I/O Simulation.PGLOSSARYpatch. A technique to alter program flow (without recompiling the sourcecode) with <strong>CrossView</strong> <strong>Pro</strong> commands and/or C expressions. With<strong>CrossView</strong> <strong>Pro</strong>, it is possible to use breakpoints to alter program flow bypatching in new code or moving the execution position around existingcode.pop−up window. A window that appears in certain situations thatoverlaps the current display. Pop−up windows usually contain information(like a command definition) that need not be continuously displayed.probe. A part of an emulator that can be inserted in place of the targetchip in the actual embedded systems hardware.probe point. A special kind of breakpoint. When a probe pointbreakpoint is hit, the associated commands are executed and programexecution is continued.
Glossary15−9profiling. For each source code line that is executed, the timinginformation is given.Qquiet command. A Q instruction at the start of the command list of abreakpoint suppressing the default display of function: line number:source file.Rrecord & playback. The ability to save <strong>CrossView</strong> <strong>Pro</strong> commands (and, ifdesired, Command window output) to a file. <strong>CrossView</strong> <strong>Pro</strong> can play backsimple text files consisting solely of <strong>CrossView</strong> <strong>Pro</strong> commands.register window. A <strong>CrossView</strong> <strong>Pro</strong> window showing the contents of thetarget microprocessor’s registers.reserved special variables. Special variables ($LINE, $PROCEDURE,$FILE) whose values <strong>CrossView</strong> <strong>Pro</strong> maintains to reflect the current statusof the debugging session. See also special variables.ROM monitor. A program which supervises or controls, at an elementarylevel, the overall operation of an embedded system. Because of the limitedhardware features of most boards containing ROM monitors, some<strong>CrossView</strong> <strong>Pro</strong> features may not be supported. See also emulator.RS−232 cable. A cable that exchanges asynchronous data between thehost and target systems.Sscope. The extent to which a variable can be referred to. Global variablesare always in scope; local variables are only in scope when their definingfunction is the current function.select. To make a window active.sequence breakpoint. A breakpoint that halts program execution whenbreakpoints are hit in a specified sequence. A sequence breakpoint canhave a command list.• • • • • • • •
15−10Chapter 15single stepping. Executing a source statement or a machine instructionthen halting. Single stepping lets you observe a program executing instop−motion, to observe registers, variables and program flow.skidding. When a microprocessor executes a few instructions after a databreakpoint halts execution. On some microprocessors, execution may notstop until all instructions in its pipeline have been executed. It is importantto realize therefore that a target program may not halt at the preciseinstruction where the data breakpoint occurred.software breakpoint. See breakpoint.source level debugger. A debugger capable of correlating source codeand variable names with object code. <strong>CrossView</strong> <strong>Pro</strong> is a source leveldebugger.source window. A <strong>CrossView</strong> <strong>Pro</strong> window displaying the high−levellanguage program code. It also displays such information as the currentexecution position, viewing position and installed breakpoints.special variable. A variable independent of the target program that<strong>CrossView</strong> <strong>Pro</strong> maintains for the user’s benefit. Special variables start witha $ and are defined when first mentioned. <strong>CrossView</strong> <strong>Pro</strong> also maintainsreserved special variables that contain information about the state of thedebugging session.stack depth. The level that a particular return address from a functionresides on the stack. The current function is always at stack depth zero.stack traceback. An operation in which <strong>CrossView</strong> <strong>Pro</strong> reads the returnaddresses and passed parameters off the stack to reconstruct programflow.GLOSSARYstack window. A <strong>CrossView</strong> <strong>Pro</strong> window showing the function calls onthe stack, with the values of the parameters passed to them.startup options. Special command line switches passed to <strong>CrossView</strong><strong>Pro</strong> when the debugger is first loaded. These options control items such asthe number of assertions allowed, or can perform various actions such asto start recording screen output to a file.stream. A particular input or output data path for I/O simulation. Permethod, File System Simulation, File I/O or Debug Instrument I/O, aunique stream numbering scheme is used.switches. See startup options.
Glossary15−11symbolic debugger. A type of debugger generally limited to dealing withglobal, non−dynamic variables. Symbolic debuggers know nothing of thedata types; they translate global names and global subroutines intoaddresses. See also source level debugger.symbol information. The necessary information for <strong>CrossView</strong> <strong>Pro</strong> tocorrelate object code with source code. The symbol information is part ofthe absolute file. See also absolute file.system startup code. A run−time library routine written in assemblylanguage source that initializes the target environment before callingmain(). See also main().Ttarget communication. The low−level communication between the hostand the target system. For the most part, <strong>CrossView</strong> <strong>Pro</strong> handles targetcommunications, allowing the programmer to concentrate on thehigh−level information.target microprocessor. The chip on which the target program runs.target system. The targeted microprocessor where the embeddedapplication runs.terminal window. A <strong>CrossView</strong> <strong>Pro</strong> window containing all the input andoutput streams directed to the screen. <strong>CrossView</strong> <strong>Pro</strong> can display severalwindows at a time.timer breakpoint. A breakpoint that halts program execution after aspecified number of seconds or timer ticks. A timer breakpoint can have acommand list.trace buffer. A target−resident buffer that contains the most recentinstructions executed by the target microprocessor. <strong>CrossView</strong> <strong>Pro</strong> uses thisbuffer to deduce a C−trace.transparency mode. The mode in which <strong>CrossView</strong> <strong>Pro</strong> passes userinput directly to the emulator. Transparency mode is often used whensetting up memory maps.• • • • • • • •
GLOSSARY15−12Chapter 15Uup−level breakpoint. A code breakpoint set at the return from afunction at a specified stack depth.Vviewing position. The line of source code currently being viewed. Thisline contains the dashed line cursor. Some commands operate by defaulton the viewing position. The viewing position and the execution positionare initially the same, but you may adjust each individually.
APPENDIXINTERPROCESSCOMMUNICATIONA
A−2INTERPROCESS COMMUNICATIONAPPENDIXAAppendix A
Interprocess CommunicationA−31 COM INTERFACE1.1 INTRODUCTION<strong>CrossView</strong> <strong>Pro</strong> provides a COM object interface on MS−Windowsplatforms. The purpose of the COM object interface is to make thecommand−line interface of the command window available to the outsideworld. Simultaneously, a callback mechanism is provided which allows theoutside world to tap into events that occur within <strong>CrossView</strong> <strong>Pro</strong> (forexample a breakpoint hit message). This is achieved by a COM connectionpoint interface to which multiple programming languages can connect.The <strong>CrossView</strong> <strong>Pro</strong> COM object can be used in programming languageslike Python, Visual C++ or Visual Basic. Applications that are COM clientscan also make full use of the <strong>CrossView</strong> <strong>Pro</strong> COM object interface. COM isa binary reusable object technology, linked tightly to MS−Windows. COMis closely related to ActiveX and Automation. ActiveX consists of a set ofpredefined interfaces to be implemented in a COM object and used tocreate plugable GUI components. Automation is a similar set of predefinedCOM interfaces, but with a wider range of applications than ActiveX.1.2 USING THE COM OBJECT INTERFACE1.2.1 RUN−TIME ENVIRONMENTThe <strong>CrossView</strong> <strong>Pro</strong> COM object executes as an out−of−process server.Only one client per instantiated <strong>CrossView</strong> <strong>Pro</strong> COM object can connect.Each <strong>CrossView</strong> <strong>Pro</strong> executable has a unique identification (so−calledUUID or GUID), independent of the version number. This is especiallyimportant for Visual Basic which stores the TypeLib UUID. This requiresrecompilation if the UUID changes across different versions of the same<strong>CrossView</strong> <strong>Pro</strong> executable.1.2.2 COMMAND LINE OPTIONSTo prevent initialization dialogs at <strong>CrossView</strong> <strong>Pro</strong> startup (for example adialog to specify which CPU type you use), you can use severalcommand−line options which you can specify via the Init() method.• • • • • • • •
A−4Appendix AUse the following options instead of startup dialogs:−tcfg file−C cpuSpecifies a target configuration file which contains, amongother things, the GDI module to be loaded among otherthings. This overrules the filename specified in xvw.ini.Specifies the CPU type.INTERPROCESS COMMUNICATION−D device_type,opt1[,opt2]Specifies communications parameters such as communicationport and baud rate.−G path−iniSpecifies the startup directory for <strong>CrossView</strong> <strong>Pro</strong>Specifies the xvw.ini file.Section 4.4, Startup Options in Chapter Using <strong>CrossView</strong> <strong>Pro</strong>1.2.3 STARTUP DIRECTORYThe startup directory of <strong>CrossView</strong> <strong>Pro</strong> determines where the xvw.ini fileis written. When <strong>CrossView</strong> <strong>Pro</strong> is invoked via its COM interface onMS−Windows, the startup directory is usually C:\WINNT\system32. Youcan change the location of the xvw.ini file with the −G command lineoption. This feature is useful when you are using two different <strong>CrossView</strong><strong>Pro</strong> instances simultaneously.
Interprocess CommunicationA−51.3 COM INTERFACESThe following interfaces are provided with <strong>CrossView</strong> <strong>Pro</strong>:ICommandLineDefault interface; provides <strong>CrossView</strong> <strong>Pro</strong> command interpreter access.ICommandLineEventsConnection point; provides the events output stream of <strong>CrossView</strong> <strong>Pro</strong>.Works as a callback.1.3.1 ACTIVATING THE COM OBJECTCommand line options are passed to <strong>CrossView</strong> <strong>Pro</strong> via the Init()method. It is necessary to call the Init() method before you can use the<strong>CrossView</strong> <strong>Pro</strong> COM object. <strong>CrossView</strong> <strong>Pro</strong> does not start as COM object,until after you have actually called the Init() method. If you do notneed to pass any options, invoke Init() with an empty string.Registering the serverBefore you can use the COM object, you must register it in theMS−Windows Registry. Run <strong>CrossView</strong> <strong>Pro</strong> from the command line asfollows:xfw166 −RegServerSimilarly, you can remove the COM object from the Registry:xfw166 −UnregServerTo avoid the popup message when registering, two more command lineoptions are available that are useful when you use batch files:−RegServerS−UnregServerSSame as −RegServer, but without messageSame as −UnregServer, but without message box• • • • • • • •
A−6Appendix A1.3.2 METHODSThis section lists the methods that are supported by the <strong>CrossView</strong> <strong>Pro</strong>COM object’s default interface ’ICommandLine’. The data types and returnvalues are expressed as COM base types. For example, BSTR is awide−character UNICODE string type, which is the same type as VisualBasic strings.INTERPROCESS COMMUNICATIONInit()void Init(BSTR CommandlineOptions)Passes command line options to the <strong>CrossView</strong> <strong>Pro</strong> COM. It is necesarry tocall the Init() method before you can use the <strong>CrossView</strong> <strong>Pro</strong> COMobject. If you do not need to pass any options, invoke Init() with anempty string.CommandlineOptionsThe string with the command line options. The options arewritten as on a regular command line.The list of supported command−line options can be found in the<strong>CrossView</strong> <strong>Pro</strong> User <strong>Manual</strong>.See Section 4.4, Startup Options in Chapter Using <strong>CrossView</strong> <strong>Pro</strong> for acomplete overview of all available command line options.ExecuteBOOLEAN Execute(BSTR Command, long SequenceNumber,BSTR *Result)Passes a command to <strong>CrossView</strong> <strong>Pro</strong>, executes it and returns TRUE orFALSE after the command has been executed.CommandThe command to be executed by <strong>CrossView</strong> <strong>Pro</strong>.SequenceNumberA number that is unique for each command. You can use thisnumber to distinguish the output in the events stream. If youdo not use this, specify a value of 0.
Interprocess CommunicationA−7ResultReturns:The textual output of the command window, encapsulated inan annotated format. See CmdAnnotatedOutput in section1.4 Events for the format description. Specify NULL if you donot want any output.TRUE on success, FALSE on error.ExecuteNoWaitBOOLEAN ExecuteNoWait(BSTR Command,long SequenceNumber)Queues a command for execution and returns TRUE of FALSE after thecommand has been passed but before it is executed.CommandThe command to be executed by <strong>CrossView</strong> <strong>Pro</strong>.SequenceNumberA number that is unique for each command. You can use thisnumber to distinguish the output in the events stream. If youdo not use this, specify a value of 0.Returns:TRUE if the command is successfully passed, FALSE on error.Haltvoid Halt(void)Halts the execution of the current command.1.3.3 IMPLEMENTATION DETAILSA multi−threading (MTA) type of appartment is used with a free−threadingmodel, for example, ThreadModel=Free. However, each CLSID can haveits own distinct ThreadingModel. Only one client can connect to a COMobject instance of <strong>CrossView</strong> <strong>Pro</strong>. Each next CoCreateInstance() willresult in a new <strong>CrossView</strong> <strong>Pro</strong> COM object instance being created.Be aware that DLLs are not supposed to call CoInitialize themselves.Once the concurrency model for a thread is set, it cannot be changed. Acall to CoInitialize on an apartment that was previously initialized asmultithreaded will fail and return RPC E CHANGED MODE.• • • • • • • •
A−8Appendix AINTERPROCESS COMMUNICATIONTypically, the COM library is initialized on a thread only once. Subsequentcalls to CoInitialize or CoInitializeEx on the same thread willsucceed, as long as they do not attempt to change the concurrency model,but will return S FALSE. To close the COM library gracefully, eachsuccessful call to CoInitialize or CoInitializeEx, including those thatreturn S FALSE, must be balanced by a corresponding call toCoUninitialize. However, the first thread in the application that callsCoInitialize(0) or CoInitializeEx(COINIT APARTMENTTHREADED)must be the last thread to call CoUninitialize(). If the call sequence isnot in this order, then subsequent calls to CoInitialize on the STA willfail and the application will not work.Because there is no way to control the order in which in−process serversare loaded or unloaded, it is not safe to call CoInitialize,CoInitializeEx, or CoUninitialize from the DllMain function.So, take care when establishing more CLSIDs in a GDI module.1.4 EVENTS<strong>CrossView</strong> <strong>Pro</strong> provides an events source, into which a client can tap via aCOM connection point. Examples of events are "reporting whichbreakpoint has been hit" and "symbols have been loaded". Currently thefollowing events are defined. Each event is terminated by a newlinecharacter. Prepare your client for new events, basically by ignoringunrecognized ones.CommandInterpreterBusyThe debugger’s command interpreter is executing a command line, or aGUI operation is in progress. A command line can comprise multipletarget execution commands, so arbitrary Running and Stopped events mayoccur before the command line has been finished. An example for usingthis event is the disabling of menu entries in your tool.You can send multiple CommandInterpreterBusy events without theCommandInterpreterReady counterpart. New commands can be send tothe debugger after this event has been issued, but they will be queueduntil the debugger is ready for new command input.
Interprocess CommunicationA−9• • • • • • • •CommandInterpreterReadyThe entire command line or GUI operation has either been executedcompletely or aborted. You can send multiple CommandInterpreterReadyevents without the CommandInterpreterBusy counterpart.CommandCanceledByUserThe entire command line or GUI operation has can been canceled by theuser, usually via the Halt button.In case of DDE, the <strong>CrossView</strong> <strong>Pro</strong> command queue will be emptied. Thecommand queue of all other IPCs, for example COM, will be preserved.This has been designed for the multi−core debugger which relies oncommands −submitted by the multi−core debug system− always beingexecuted, even if the user hits the Halt button.Note that every command can be canceled this way, even when asking avariable’s value. Often no value will be returned at all, because Haltaborted the evaluation.HaltButtonPressedTells that the user has pressed the Halt button. This is necessary becausein <strong>CrossView</strong> <strong>Pro</strong> Halt means stop executing the current command line. Ifan external client needs to know this too, the Halt button must bereported explicitly. If not, only when the Halt button actually is hit duringa command line execution, cancellation is the case, and reported via anevent. If the command line just finished, nothing is being done, so needsto be canceled, hence no cancellation is reported either.An example would be a client interpreting breakpoint hits and issuingcontinue commands to resume execution. If the halt button should alsostop the client from doing this, the HaltButtonPressed event must be used.RunningStarted executing the target.RunningInBackgroundStarted target execution in background mode. This is usually a mode inwhich a restricted set of operations can be performed, for example readfrom a memory location.Stopped causeStopped target execution. The cause is reported. Possible causes:
A−10Appendix ASTEPA single step of any kind was finished. Be aware that whenusing single−step, the debugger does not report anybreakpoints the program counter arrives at.INTERPROCESS COMMUNICATIONBREAKPOINT "name"Breakpoint name was hit. This includes cycle breakpoints,time elapsed or number of instructions types. Breakpointsthat the user has set are reported as well.Nameless breakpoints are reported using as name #number#,where number is the <strong>CrossView</strong> <strong>Pro</strong> administration number.If no name or number is known, NAMELESS BREAKPOINTwill be used.ASSERTION numberAssertion number was hit.UNKNOWN The process has stopped. The cause is unknown or cannotbe described with one of the previous reasons.One of the causes may be that the user presssed the Haltbutton.More causes may be added in the future.ResetHardware reset command has been executed by the debugger.Reset<strong>Pro</strong>gramSoftware reset of the program command has been executed by thedebugger.ViewedLineNrChanged numberThe line being displayed changed to the specified one. If the sourcewindow is closed, or the cursor is not in a file but somewhere inassembly, this event will not be sent.SourceFileChanged "filename"The debugger displays an other source file. An empty file name "" will besent if no source is being displayed at all.DidLoadSymbols "filename"The symbols of an application have been loaded.
Interprocess CommunicationA−11DidAddSymbols "filename"An application’s symbols have been added to the ones alreadypresent.DidDownloadImage "filename"The code and data image of an application has been downloaded intotarget memory.DestroyedAllSymbols "filename"The symbol table of the application filename has been destroyed.BreakpointsChangedThe list of breakpoints changed (for example when a breakpoint wasadded).AssertionsChangedEither the list of assertions or assertion mode changed (for example whenan assertion was added). Note that the assertion numbering can be entirelyaltered when an assertion is removed.MenuEntrySelected "id−string"The menu entry id−string was selected by the user. Only menu entriescreated with the AddDDEMenuEntry or AddCOMMenuEntry command arereported.CmdAnnotatedOutputannotated−output<strong>Pro</strong>vides the command window output in an annotated form.The first line indicates the error status and says OK, ERROR or NOTEXECUTED. The second line has the form SEQ:sequence_number, wherethe sequence number is either 0 or the number specified with thecommand. Although the sequence number is optional (it may be omittedin some commands) this line is always present. The next lines are eitheroutput or error messages. A label indicates the type (OUTPUT or ERROR)and the number of lines that follow.• • • • • • • •
A−12Appendix AExampleERRORSEQ: 9284OUTPUT:1Hello WorldERROR:1No such name: xyINTERPROCESS COMMUNICATIONThe reason behind this event is the inevitable merging of all data streamsinto one when TCP/IP server is provided next to for example the DDEserver.QuitThe debugger is about to terminate. This is not necessarily the last event.nor is it guaranteed that a CommandInterpeterReady event was sendbefore. The quit event may not be send at all, due to technical restrictions.1.5 COM EXAMPLES1.5.1 PYTHON EXAMPLESTo use COM objects for Python, you must first install the Pythoninterpreter and the Win32COM extensions. You can use the Pythoninterpreter distributed with the TASKING EDE. Or you can download thePython interpreter from http://www.python.org (May 2001) or usewin32all.exe from http://aspn.activestate.com/ASPN/Downloads/ActivePython/Extensions/Win32all (May 2001).Synchronous CallsReplace all occurences of Xfw in the example below by the nameof your <strong>CrossView</strong> <strong>Pro</strong> executable to make the text applicable.## Example without events callback#import win32com.client# Python 1.4 requires "import ni" first.
Interprocess CommunicationA−13class Xfw:"Xfw via COM wrapper class"def __init__(self, cmdline_options = ""):try:self.COMobject = win32com.client.Dispatch("Xfw.CommandLine")self.COMobject.Init(cmdline_options)except Exception,e:print ’(Is the Xfw COM object installed,using "xfw.exe −RegServer"?)’raise edef Execute(self, text, sequence_number = 0):result = self.COMobject.Execute(text, sequence_number)# convert Unicode to Python stringretval = (result[0], str(result[1]))return retvaldef test_xfw_com_object():xvw = Xfw(r"−sd c:\\testdir")(success, result) = xvw.Execute("echo Hello from Python")print "received", result(success, result) = xvw.Execute("l d")print "success=",successprint result(success, result) = xvw.Execute("++$hoi")print result(success, result) = xvw.Execute("++$hoi")print result(success, result) = xvw.Execute("++$hoi")print resultdel xvwif __name__ == "__main__":test_xfw_com_object()• • • • • • • •
A−14Appendix AEvents Callback## Example with Events callback#INTERPROCESS COMMUNICATIONimport win32com.client# Python 1.4 requires "import ni" first.import win32uiimport reseen_ready_event = 0class xvw_events:def On<strong>CrossView</strong>Event(self, strUnicode):global seen_ready_eventprint "<strong>CrossView</strong>Event: " + str(strUnicode)if (re.match("CommandInterpreterReady.*", str(strUnicode))):seen_ready_event = 1class Xfw:def __init__(self, cmdline_options = ""):self.COMobject = win32com.client.DispatchWithEvents("Xfw.CommandLine", xvw_events)self.COMobject.Init(cmdline_options)def Execute(self, text, sequence_number = 0):result = self.COMobject.Execute(text, sequence_number)# convert Unicode to Python stringretval = (result[0], str(result[1]))return retvalif __name__ == "__main__":xvw = Xfw("−sd testdir1")print xvw.Execute(’"hello Python";$hoi++’)while seen_ready_event == 0:win32ui.PumpWaitingMessages(0, −1)print "terminating"del xvw
Interprocess CommunicationA−15Python Makepy UtilityIn the examples above Python will load the type info dynamically from theCOM object. This is called ’dynamic’ binding or ’late’ binding inPythonCOM jargon. However, PythonCOM also provides a mechanism togenerate a Python module which contains this type info and thus speedsup the loading process. This is called early binding in the PythonCOMpackage.Python uses the makepy utility to support early−bound automation.Makepy is a Python script that translates the COM type library to a Pythonmodule which wraps the COM object’s interfaces. Once you use themakepy utility, early binding for the objects is automatically supported.There’s no need to do anything special to take advantage of the earlybinding.Advantages:• Method invocation is faster.• Constants defined in the type library are available via the COMinterface module.• It allows much better support for advanced parameter types. Especiallyparameters declared by COM as BYREF can only be used with makepywrapped objects.Disadvantages:• The makepy wrapper script depends on the COM object to be wrappedby makepy. Generation can be automated.• The module that is generated by makepy, can be large. The filegenerated for Microsoft Excel for example, is about 800 Kb.To speed up starting a Python script that loads the <strong>CrossView</strong> <strong>Pro</strong> COMobject, you can generate a Python module with makepy.py:cd ...\python20\win32com\clientpython makepy.py ...\xfw.exeThis script will place a module in the win32com\gen_py subdirectory.For more information on COM programming with Python refer to Python<strong>Pro</strong>gramming on Win32 − Help for Windows <strong>Pro</strong>grammers (MarkHammond & Andy Robinson; 1st Edition January 2000; 1−56592−621−8).• • • • • • • •
A−16Appendix A1.5.2 VISUAL BASIC EXAMPLESReplace all occurences of Xfw in the example below by the nameof your <strong>CrossView</strong> <strong>Pro</strong> executable to make the text applicable.INTERPROCESS COMMUNICATIONSynchronous CallsThis example demonstrates plain commands being executed in <strong>CrossView</strong><strong>Pro</strong>, without receiving any events from <strong>CrossView</strong> <strong>Pro</strong>.Dim Xvw As ObjectDim Result As String’ here we invoke the PowerPC \xvw{}’ replace xfw by your executable nameSet Xvw = CreateObject("Xfw.CommandLine")Call Xvw.init("")Call Xvw.Execute("I", Result, 0)MsgBox ResultEndEvents CallbackVisual Basic provides a special feature, WithEvents, to connect to theconnection point of a COM interface. It is also available in VBA 5.0. Youmust use WithEvents in a variable declaration. There is a catch, however:you can only use it in a class module (including form modules) and itmust appear in the declaration section. You cannot declare a variableusing WithEvents in the body of a procedure. For this example, firstselect Xfw type library in the <strong>Pro</strong>ject References dialog:1. In Microsoft Word or Microsoft Excel, start the Visual Basic editor and goto Tools|References or:In Visual Basic, go to <strong>Pro</strong>ject|References.Note that VBA differs from VB. See the Word example for VBA.2. Search and check the <strong>CrossView</strong> COM Interface Type Library entry.
Interprocess CommunicationA−17Option ExplicitPublic WithEvents Xvw As XfwPrivate Sub Form_Load()Dim Result As StringSet Xvw = CreateObject("Xfw.CommandLine")Call Xvw.Init("")Call Xvw.Execute("echo Hello", Result, 0)EndEnd SubPrivate Sub Xvw_<strong>CrossView</strong>Event(ByVal EventText As String)MsgBox "Called back with: " & EventTextEnd Sub1.5.3 WORD EXAMPLESHere is an example of connecting to <strong>CrossView</strong> <strong>Pro</strong> PowerPC. It startsxfw and shows all messages that <strong>CrossView</strong> <strong>Pro</strong> sends to Word.Visual Basic for Applications provides a special feature, WithEvents, toconnect to the connection point of a COM interface. You must useWithEvents in a variable declaration. There is a catch, however: You canonly use it in a class module (including form modules) and it must appearin the declaration section. You cannot declare a variable usingWithEvents in the body of a procedure.Replace all occurences of Xfw in the example below by the nameof your <strong>CrossView</strong> <strong>Pro</strong> executable to make the text applicable. To add theexample to Word:1. Start the Visual Basic editor and go to Tools|References2. Search and check the <strong>CrossView</strong> COM Interface Type Library entry3. Insert a class module, via the menu bar: Insert|Class Module4. Change its name to clsXfw in the properties pane5. Paste the following text:• • • • • • • •
A−18Appendix A’’ Class module clsXfw’’Option Explicit’ membersPublic WithEvents oXfw As XfwINTERPROCESS COMMUNICATIONPrivate Sub Class_Initialize()End SubPrivate Sub oXfw_<strong>CrossView</strong>Event(ByVal strEventAs String)MsgBox strEventEnd Sub6. Insert a module, via the menu bar: Insert|Module7. Paste the following text:’’ Module testXfw’Option ExplicitDim oXfw1 As New clsXfw’ run automatically when your Addin loads’ and your Addin will automatically load when Wordloads.Public Sub AutoExec()Set oXfw1.oXfw = New Xfwppccall oXfw1.oXfw.Init("")End Sub
Interprocess CommunicationA−191.5.4 EXCERPT OF THE MIDL DEFINITIONThe ’ICommandLine’ interface is dual, the ’ICommandLineEvents’connection point interface is not. Replace all occurences of Xfw inthe example below by the name of your <strong>CrossView</strong> <strong>Pro</strong> executable tomake the text applicable.interface ICommandLine{HRESULT Init([in] BSTR CommandLine);HRESULT Execute([in] BSTR Command,[in] long SequenceNumber,[out] BSTR *Result,[out, retval] VARIANT_BOOL *Ok);};HRESULT Halt(void);HRESULT ExecuteNoWait([in] BSTR Command,[in] long SequenceNumber,[out, retval] VARIANT_BOOL *Ok);library <strong>CrossView</strong>LibXfw{dispinterface _ICommandLineEvents{methods:void <strong>CrossView</strong>Event([in] BSTR);};};coclass Xfw{[default] interface ICommandLine;[default, source] dispinterface _ICommandLineEvents;};• • • • • • • •
A−20Appendix A2 DDE SERVER INTERFACE2.1 INTRODUCTIONINTERPROCESS COMMUNICATION<strong>CrossView</strong> <strong>Pro</strong> offers an Interprocess Communications (IPC) option usingthe Microsoft Windows Dynamic Data Exchange (DDE) interface forexternal control of <strong>CrossView</strong> <strong>Pro</strong>. The DDE interface offers direct accessto the <strong>CrossView</strong> <strong>Pro</strong> command interpreter. Via the DDE interface you canexecute every <strong>CrossView</strong> <strong>Pro</strong> command that you can access via the regular<strong>CrossView</strong> <strong>Pro</strong> command window, and retrieve the output produced bythe executed command.2.2 DDE ITEMS AND TOPICSDDE function calls always return, whether they succeed or fail. They donot report application command errors. Retrieve and interpret thecmdoutput item or cmdannotatedoutput item to check for errors.HelpTopicSystemItemHelpOperationsRequest, AdviseDescriptionReturns a brief overview of the topics and items in ASCII text format.
Interprocess CommunicationA−21cmdoutputTopicCommandItemcmdoutputOperationsRequest, AdviseDescriptionRetrieves all command window output of the last executed command viathe Command topic. This item empties itself after it has been requested.• • • • • • • •
A−22Appendix AcmdannotatedoutputTopicCommandINTERPROCESS COMMUNICATIONItemcmdannotatedoutputOperationsRequest, AdviseDescriptionThe first line indicates the error status and says OK, ERROR orNOT_EXECUTED. The second line has the form SEQ:sequence_number,where the sequence number is either 0 or the number specified with theexecext command. Although the sequence number is optional (it may beomitted in some commands) this line is always present. The next lines areeither output or error messages. A label indicates the type (OUTPUT orERROR) and the number of lines that follow.ExampleERRORSEQ: 9284OUTPUT:1Hello WorldERROR:1No such name: xy
Interprocess CommunicationA−23execextTopicCommandItemexecext:options:stringOperationsExecuteDescriptionPasses the specified string without interpreting it to <strong>CrossView</strong> <strong>Pro</strong>’scommand interpreter (see also Command\cmdannotatedoutput). Theexecext: prefix is part of the entire command string: it makes a distinctionbetween the various commands. For example exec, execext or halt,received via the Command topic.Optionswait=yesnoyesno is 1 or 0. If you specify wait=1 is, the execextcommand blocks the DDE transaction until <strong>CrossView</strong> <strong>Pro</strong>has finished executing the command. Issue the Haltcommand in this case via a second conversation.Be aware of the time limitation imposed by the DDEinterface. It can wait for a period of 25 days. Use execcombined with either waiting for an Advise on thecmdoutput item, or with interpreting the event item tohandle very long lasting commands.When you do not specify a value, 1 is assumd by default.seq=number A unique number to identify a command’s specific result inthe stream of events output via the event item. See the eventitem and cmdannotatedoutput item for more details.silent=yesno yesno is 1 or 0. If 1, the command window output will besuppressed. See section 2.5.5 Using <strong>CrossView</strong> <strong>Pro</strong> as PureServer for the gus command.When you do not specify a value, 1 is assumd by default.Exampleexecext:seq=424564,wait:echo test• • • • • • • •
A−24Appendix AexecTopicCommandINTERPROCESS COMMUNICATIONItemexecOperationsExecuteDescriptionPasses the specified string without interpreting it to <strong>CrossView</strong> <strong>Pro</strong>’scommand interpreter (see also Command\cmdoutput).A major difference with regular MS−Windows applications is the immediateacknowledge of a command, before it has been completed. This isbecause the sender does not have to wait for the answer and can peformother tasks meanwhile. For example, you are able to issue a haltcommand to stop the debugger.To simulate wait−till−completion command execution, wait until thecmdoutput item is assigned to the command’s output via an Advisory linkevent, or interpret the event item.The exec: prefix is part of the entire command string: it makes adistinction between the various commands. For example, exec, execextor halt, received via the Command topic.
Interprocess CommunicationA−25haltTopicCommandItemhaltOperationsExecuteDescriptionForces <strong>CrossView</strong> <strong>Pro</strong> to stop target execution. You can issue thecommand via a second conversation.• • • • • • • •
A−26Appendix AeventTopicCommandINTERPROCESS COMMUNICATIONItemeventOperationsAdviseDescriptionReports event occurrences to the client, asynchronously. An event isreported by a string. To ensure capturing all events, use an Advise link.<strong>CrossView</strong> <strong>Pro</strong> only keeps the last event.Request is not meant to be used; it can only be used after establishing anAdvise link.
Interprocess CommunicationA−27resultTopicCommandItemresult:nameOperationsExecuteDescriptionThe name that you specify provides a serve as DDE requestable item toobtain a message which describes the reason why a DDE command failedto execute. It does not return the <strong>CrossView</strong> <strong>Pro</strong> error message. It isalways deleted after it has been requested.The result: prefix is part of the entire command string: it makes adistinction between the various commands. For example, exec, execextor halt, received via the Command topic.2.3 DDE EVENTS2.3.1 PACKET FORMATEach event is wrapped in a record and one DDE message contains one ormore of these records. This means that multiple events can be receivedsimultaneously in one DDE transaction. This is done because DDE canlose ("combines") events when XTYPF ACKREQ mode is selected, andbecause this channel will be redirected to TCP/IP in the future for portableIPC support in <strong>CrossView</strong> <strong>Pro</strong>.To handle events with more than one line, a header (not a newline) isused to distinguish between the individual events. The header format is:EVENT: number−of−charactersSo you must always split events that arrive in one DDE message. Anexample of such a multi−event DDE message is:• • • • • • • •
A−28Appendix AINTERPROCESS COMMUNICATIONEVENT: 27SourceFileChanged "demo.c"EVENT: 23ViewedLineNrChanged 93EVENT: 27Stopped BREAKPOINT "input"EVENT: 24CommandInterpreterReadyEVENT: 79CmdAnnotatedOutputOK\rOUTPUT:1\rError breakpoint name ’input’ is not unique!\rFor an overview of all available events, see section 1.4 Events2.4 CROSSVIEW PRO DDE SPECIFIC OPTIONS ANDCOMMANDS2.4.1 COMMAND LINE OPTIONS−−ddeservername=nameThis command line option specifies a unique DDE server name. This wayit is easier to distinguish between multiple instances of the same debugger.If you do not use this option, the server name is the name of the<strong>CrossView</strong> executable. To distinguish between multiple DDE servers withthe same name, you must connect to all DDE servers usingDdeConnectLists() and obtain distinguishing information.2.4.2 COMMANDSWith regard to DDE support, the following commands are availableenhance integration support.AddDDEMenuEntrySyntax:AddDDEMenuEntry "label","id−string" [,AlwaysEnabled]
Interprocess CommunicationA−29Creates a menu entry with given label and id−string. The label alsospecifies the path from the main menu bar, for example:AddDDEMenuEntry "Options|CaseTool|Configure...","config−menu−entry"An entry cannot be removed or replaced once it has been created. Neitheris there support for enabling or disabling entries via this interface, this issomewhat problematic, since we are communicating across anasynchronous interface, so the disable may not be executed immediately.AlwaysEnabled is either 1 (true) or 0 (false, default). <strong>CrossView</strong> <strong>Pro</strong> bydefault disables the menu entry when the command window disallowsentering a command, for example when running an application.To define the shortcut character of a menu entry, place a ’&’ before thecharacter. The shortcut character will be underlined. To add a seperatorline in the menu, start the next menu entry with a ’+’. The seperator linewill precede this menu entry. For example:"&Options|&CaseTool|+&Reset"2.5 EXAMPLES2.5.1 EVALUATING AN EXPRESSIONTo get the value of an expression, pass it to the command interpreter. Thesyntax of the returned value is:identifier = valueThe value can even be a complete structure or union. For example,execute via the Command topic:execext:mainThe returned string could look like:main = 0x0• • • • • • • •
A−30Appendix A2.5.2 READING TARGET MEMORYYou can retrive target memory either via requesting a variable’s value, orwith the dump command. The dump command can dump both byte(MAU) sized hex values or C type values, for example long or double. Theresulting output must be interpreted to get the values.The basic syntax of the returned values for plain MAU size hex dumps is:INTERPROCESS COMMUNICATIONaddress: value value ASCII−dumpThe basic syntax of the returned values for formatted dumps is:address = value valueFor example, execute via the Command topic a hex dump command:execext:dump main,#16The returned text could be:0x2000: 00 00 00 00 00 00 00 00 00 00 00 00 00 00 00 00 .......For example, execute via the Command topic a formatted dumpcommand, requesting 16bit integers:execext:dump data1,#16,d2The returned text could be:0x2000 = 0 0 0 0 0 0 0 00x2010 = 0 0 0 0 0 0 0 0The number of values per line differs. This depends on both the size andtype of the values, as well as the architecture of the processor that isconnected to the debugger.
Interprocess CommunicationA−312.5.3 WRITING INTO TARGET MEMORYTo write to target memory, use one of the following three methods.1. Assign a value to a variable.2. Use one of the the mF or mf commands.For example, the following stores the byte (MAU) sized values 1 2 3 4 5 inmemory starting at memory location 0x2000.0x2000 mF 1, 2, 3, 4, 53. Write into memory using a type cast.For example:*(long*)0x2000 = 0x12345• • • • • • • •
A−32Appendix A2.5.4 REQUESTING CURRENT FILE AND LINE NUMBERTo determine the location of the source window cursor position, requestthe following special variables:$FILEThe file in which the source window cursor position is. If theposition is outside any file, the error message ’No current file’is returned.INTERPROCESS COMMUNICATION$PROCEDUREThe name of the function in which the source window cursorposition is. If the position is outside any function, the errormessage ’No current function’ is returned.$LINEThe line number of the cursor in the source window. If theposition is outside any file, the error message ’No currentline’ is returned.You can also use the command l s" to get all special variables, includingthe ones above. If a variable is not set, it is not included in the list, or setwith the error message as described above.To make sure the cursor is at the current execution position, precede the Lcommand before requesting the variable. For example, issue:L; $FILE; $PROCEDURE; $LINEError messages appear when a variable fails.To obtain the current execution positions, you can also interpret the resultof the L command directly.2.5.5 USING CROSSVIEW PRO AS PURE SERVERTo have <strong>CrossView</strong> <strong>Pro</strong> act as server only, updating windows can beturned off with the command gus on. This inhibits all windows frombeing updated, except for the command window. Note that also the GUIdoes not refresh anymore.Also the execext:silent=1:... command via DDE inhibits the commandwindow output.
APPENDIXCROSSVIEWEXTENSIONLANGUAGE (CXL)B
CXL SYNTAXB−2APPENDIXAppendix BB
<strong>CrossView</strong> Extension Language (CXL)B−31 INTRODUCTIONThe CXL language is used for scripting, specifically for the data analysiswindow and simulation scripts. From CXL only limited access is possible tothe <strong>CrossView</strong> <strong>Pro</strong> data. Usually CXL scripts are bound to a <strong>CrossView</strong> <strong>Pro</strong>command, such as a graph command or a cycle breakpoint with a cxlcommand.The CXL syntax is derived from the C syntax, the basic differences from Care:• No preprocessor, so no defines.• Only "//" comments.• No structs or unions, so the operators "." and "−>" are notsupported.• No type definition• No enums• No switch statement.• No casts allowed. Casts are performed automatically (like in C).• No ? : operator allowed.• Blocks must not be empty ("1;" is the minimal expression).• No ’main’, all the script code is to be enclosed within a ’{’ and ’}’pair.• Function prototypes and function definitions can be nested, butmust be preceded by the keyword "sub". They can be usedanywhere in the source. Following the scope rules, a functiondeclaration hides a previous definition when it is defined.• Single statements after a flow control statement (if, else, for, while)should always be between braces.• Initializers in declarations are not allowed.• Modifiers such as signed, unsigned, register and static arenot supported.• Floating point numbers below 1 should always be preceded by azero. For example, the number .15 is treated as invalid, this shouldbe 0.15.Furthermore, the syntax is like the C syntax.• • • • • • • •
B−4Appendix BExample:{sub void p(function f){outd(f());outc(’\n’);}sub int h() { return 1; }}{ //This is the "main" entry pointp(h);sub int h() { return 2; }p(h);}This example would print the following output in the command window:122 THE SYNTAX OF CXLA CXL script always starts with an open brace ’{’ and ends with a closingbrace ’}’:{}// script hereCXL SYNTAXThere is no "main" function in a CXL script, the script just starts after thefirst open brace.Comments start with a // and end at the end of the line. Comments areallowed anywhere in the script, including before the first brace and afterthe last brace. The C style comments /* */ are not allowed.
<strong>CrossView</strong> Extension Language (CXL)B−5Within scripts, blocks can be defined and nested, just like in C:{}...{}...{}{}......Each block starts a new scope level for variables. Blocks must not beempty ("1;" is the minimal expression).There is no preprocessor like in C, so you cannot use C preprocessordirectives such as defines.The control flow statements ’if’, ’else’, ’while’ and ’for’ are supported, justlike in C. The statements after the control flow statement must always beincluded between braces. For example, the following expression is notallowed:if (x < 0 )x = 0;it should be written asif (x < 0 ){x = 0;}The switch statement, the goto statement and labels are not supported.• • • • • • • •
B−6Appendix B2.1 VARIABLESVariable declarations must be done at the beginning of a block, beforestarting the actions. All variables are initialized to zero. Variables cannot beinitialized at declaration, which means that the following is not allowed:int cyclebreak = 100;Instead you should use:int cyclebreak;... possible other declarations ...cyclebreak = 100;Variables declared at the highest level are global and keep their valuebetween the script invocations. The cxl_reset command and the programreset of <strong>CrossView</strong> <strong>Pro</strong> will reset these variables to zero. Variables at otherlevels and in functions are initialized to zero every time the block orfunction is executed.Modifiers such as signed, unsigned, register and static are notsupported. Type definitions like in C with the typedef keyword are notsupported. The enumerated type (enum) is not supported.2.2 BASE TYPESCXL supports the following base types:CXL SYNTAX• char• int• long• float• double• string (only allowed for parameters)• function (only allowed for parameters)Internally, char, int and long are treated the same, as are float anddouble. Since they are the same, types belonging to one group can beinterchanged freely.A function return value can be of any base type. Additionally, void can beused as return type for functions without a return value.
<strong>CrossView</strong> Extension Language (CXL)B−72.3 COMPOUND TYPESCXL supports the following compound types:• array of char• array of int• array of long• array of float• array of doubleExample:{}char str[100];strcpy( str, "Hello\n" );Structures, unions and type definitions are not part of the CXL syntax.2.4 POINTERSPointer to base type is only supported for parameters and not for othervariables. Pointers to variables are the result of the "address−of" (&)operator and are treated as arrays of the mentioned base type withupper−bound 1.Example:{}int myval;sub void threetimes( int *value ){*value *= 3;}myval = 10;threetimes( &myval );printf( "%d\n", myval );When running this script in <strong>CrossView</strong> <strong>Pro</strong> with the cxl command, theoutput in the command window will be:30• • • • • • • •
CXL SYNTAXB−8Appendix B2.5 CONSTANTS AND EXPRESSIONSThe syntax for expressions is the same as for C. The operators andoperator precedence are equal. The ? : operator is not supported.Explicit casts are not allowed. Implicit casts are performed automatically(like in C). When explicit rounding/casts are needed, you can use thefloor() function.Example:floor(x)floor(x+0.5)// chopping// rounding off to nearest integerFloating point constants below 1 should always be preceded by a zero.For example, the number .15 is treated as invalid, this should be 0.15.Strings are defined between double quotes, just like in C, and are storedwith a null character at the end. Character constants are defined betweensingle quotes, just like in C.2.6 OPERATORSThe operators in CXL are equal to the operators and their precedence in C.Only the ? : operator is not allowed.
<strong>CrossView</strong> Extension Language (CXL)B−92.7 FUNCTIONSFunction definitions start with the keyword "sub". Besides that, the syntaxis equal to functions in C.Example:sub int putbit( int val, int bit, int bitval ){if( bitval ){val = val | (1
B−10Appendix BThe included files can only contain functions definitions. It is not possiblejust include a script fragment.The include files are searched in the following order:1. Directory of the CXL file that contains the include statement.2. Current working directory.3. The etc\CXL directory in the installation tree of the product.3 PREDEFINED FUNCTIONSThe following sections list the predefined functions in CXL. Severalfunctions are only useful when using CXL for scripting the data analysiswindow.3.1 MATHEMATICAL FUNCTIONSCXL knows the following mathematical functions. The implementation isequal to those functions in the standard C library.CXL SYNTAXdouble sin(double x);double cos(double x);double tan(double x);double acos(double x);double asin(double x);double atan(double x);double sinh(double x);double cosh(double x);double tanh(double x);double log(double x);double log10(double x);double exp(double x);double sqrt(double x);double ceil(double x);double floor(double x);double fabs(double x);double pow(double x, double y);
<strong>CrossView</strong> Extension Language (CXL)B−113.2 ARRAY AND STRING FUNCTIONSUpperbound of an array:long upperbound(array a);The following string and array functions have the same implementation asin the standard C library. Replace array with one of the compound types"array of ...".char * strcpy( char *s, string ct );int strcmp( string cs, string ct );char * strcat( char *s, string ct );int strlen( string cs );array memcpy( array s, array ct, int n );array memset( array s, int c, int n );int memcmp( array cs, array ct, int n );void sprintf( string s, string format, ... );3.3 I/O FUNCTIONSOutput to Command WindowThe following functions send output to the command window:void printf(string format, ...);double outc(double x); −> { printf("%c", (int) x); return x; }double outd(double x); −> { printf("%ld", (long) x); return x;}double outf(double x); −> { printf("%f", x); return x; }File I/OThe following functions are available for file I/O:int open( string filename, string mode );The open function opens the file filename and returns a file handle ifsuccessful, otherwise −1 is returned. The mode string determines themode in which the file is opened. The mode string must begin withone of the following sequences:"r""r+"Open file for reading.Open file for reading and writing.• • • • • • • •
B−12Appendix B"w""w+""a""a+"Truncate file to zero length or create text file for writing.Open file for reading and writing.Open file for appending (writing at end of file).Open file for reading and appending (writing at end of file).The mode string can also include the letter ’b’ either as a last characteror as a character between the characters in any of the two−characterstrings described above. With the ’b’ in the mode the file is treated asbinary.void fclose( int handle );Closes the file associated with handle.void fprintf(int handle, string format, ...);Is the same as the fprintf function in C, with the difference that thefirst argument is a file handle and not a pointer to a stream.void fputs( int handle, string data );Writes the data string to the file belonging to the handle. Thehandle is achieved by calling the open function.Set or get variable nameThe following functions are available for interaction with the applicationbeing debugged:void set( string name, double value );CXL SYNTAXSets the value of the variable name in <strong>CrossView</strong> <strong>Pro</strong>. The name mustbe a name known at the execution point of <strong>CrossView</strong> <strong>Pro</strong>. If the namestarts with a $ it is either a register name or a <strong>CrossView</strong> <strong>Pro</strong> specialvariable. If the name starting with a $ is not known, a new specialvariable is created and assigned to the value. If the name does not startwith a $ and is not known by <strong>CrossView</strong> <strong>Pro</strong>, an error will be issuedon the CXL line: "Evaluation of expression failed".Example:set( "$PSW", 0 );set( "x", 0x1000 );// set register PSW to zero// set variable x of the// program to 0x1000
<strong>CrossView</strong> Extension Language (CXL)B−13double get( string name );Returns the value of a name known by <strong>CrossView</strong> <strong>Pro</strong>. This includesvariable names and register names. If the name starts with a $ it iseither a register name or a <strong>CrossView</strong> <strong>Pro</strong> special variable. If the namestarting with a $ is not known, a new special variable is created and setto zero. If the name does not start with a $ and is not known by<strong>CrossView</strong> <strong>Pro</strong>, an error will be issued on the CXL line: "Evaluation ofexpression failed".Example:printf( "PSW = %04x\n" , get( "$PSW" ) );printf( "x = %04x\n" , get( "x" ) );3.4 GRAPH FUNCTIONSCXL supports specific graph functions when passing a CXL script to agraph or graphm command.graph command functionsGUI interaction functions available when a script is passed to the graphcommand::void add_point(double x, double y);This function adds graph points to the acquisition buffer.void printf(string format, ...);The output of printf is written to the command window.graphm command functionsGUI interaction functions available when a script is passed to the graphmcommand::void printf(string format, ...);The output of printf is sent to the "window contents script".• • • • • • • •
B−14Appendix Bprintf is chosen to facilitate development and debugging graphmscripts using a host system C development environment. The C code canbe very easily ported to CXL afterwards. The output is in fact a commandof the drawing engine and is therefore not the same as a usual printfand not the same as printf in the graph and cxl command. Logging tothe command window from a graphm script is not possible via printf.The following drawing commands are supported:clearClear drawing area. This is usually the first command issued in adrawing sequence.graph_area x−offset, y−offset, x−size, y−sizeprintf("graph_area %d,%d,%d,%d/n", xo, yo, xs, ys)Set graph area size. The offset determines the lower left corner ofthe graph area. Size is the exact number of pixels.axis xlow, ylow, xhigh, yhighDefine the axes ranges, for determining the cross−hair cursorcoordinates (to be displayed in the cursor field and to be passed tothe representation generator). The axes range up−to the top−rightcoordinate, which is excluded (reduces axis drawing maths, butmind axis lengths of 0). The axes are linear.pen_color colorCXL SYNTAXSet pen color. Black is the default color. The color can be specifiedby name or by RGB number in the form red,green,blue as decimalnumber for each base color for 0 to 255. E.g. 255,128,0 is orange.Valid names are:black, red, yellow, green, blue, cyan, magenta,dkgray, gray, ltgray, whitebrush_color colorColor used for filling areas. Black is the default color. Seepen_color for possible colors. The value background sets thebrush to the current background color which isWINDOW_BACKGROUND under Windows.
<strong>CrossView</strong> Extension Language (CXL)B−15filled_rectangle x1, y1, x2, y2Puts a rectangle, filled with the latest set brush_color, bounded by(x1, y1) and (x2, y2) (both points inclusive). Coordinates areexpressed in pixels. The origin is the lower left corner.dot x1, y1Draw pixel. Coordinates are expressed in pixels. The origin is thelower left corner.line x1, y1, x2, y2Draw line from (x1, y1) up−to and including (x2, y2).Coordinates are expressed in pixels. The origin is the lower leftcorner.polygon x1, y1, x2, y2, ... xn, ynpolyline x1, y1, x2, y2, ... xn, ynPuts a polyline, using the latest set pen_color, from line sectionsfrom the points (x1, y1) to (xn, yn), where n >= 3 (whichmeans at least 2 lines). Coordinates are in pixels.filled_polygon x1, y1, x2, y2, ... xn, ynPuts a polygon, filled with the latest set brush_color, bounded by apolygon formed by the line sections between the points (x1, y1)to (xn, yn) and back to (x1, y1), where n >= 3. Coordinatesare in pixels. As with filled_rectangle, the pen is only temporarilyset to the same color as the current brush and restored when thecall is finished.filled_polygon_brush x1, y1, x2, y2, ... xn, ynAs with filled_polygon, but using a separate brush and pen, thatis, using the latest brush and pen color also when they are different.text x, y, anchor, "text"Draw text with its anchor at location (x, y). The anchor is thepoint in the text string, which will get placed at the specifiedlocation. For example, anchor 7 specifies that the text must beplaced such that the bottom−left side of the text is at the specifiedposition. Coordinates are expressed in pixels. The origin is thelower left corner.• • • • • • • •
B−16Appendix BAnchors:1−−−−−2−−−−−3| |4 5 6| |7−−−−−8−−−−−9Text may include any characters, except a nil character. Doublequote and backslash characters must be escaped by a backslashcharacter. Text will be formatted using the current font settings. Seebelow for the font info exchange between the window and therepresentation generator.long get_attr(string attribute);Supported attributes are:"draw−area−x−size""draw−area−y−size""x−scrollbar−present""x−scrollbar−size""x−scrollbar−low""x−scrollbar−high""y−scrollbar−present""y−scrollbar−size""y−scrollbar−low""y−scrollbar−high""selection−available""selection−start""selection−end"CXL SYNTAXlong get_text_attr(string attribute, string text_format, ...);Supported attributes are:"leading""ascent""descent""width"
<strong>CrossView</strong> Extension Language (CXL)B−17Argument passing.The graph and graphm commands can be given a number of arguments.These arguments are accessible as follows.long n_args;The number of arguments.arg1..argNwith N = n_args are added to the global scope and have typedouble * for buffers, type string for strings and type double forevaluated expressions.Parsing the script will fail if a certain argument has not been provided.Evaluation of the script will fail if the type of the argument does not matchits use.For argument testing and argument retrieval the following functions areprovided:long is_string_arg(long n);long is_double_arg(long n);long is_buffer_arg(long n);double get_double_arg(long n);string get_string_arg(long n);double *get_buffer_arg(long n);Numerical arguments can be retrieved by using get_double_arg(). Inthe graphm command, the (x, y) pairs produced by a sequence of calls toadd_printf() in the graph script are accessible via global variables xand y of data type "array of double".3.5 MISCELLANEOUS FUNCTIONSFor generating a random number the rand() function is available in CXL:int rand( void );• • • • • • • •
CXL SYNTAXB−18Appendix B
APPENDIXSOUND SUPPORT(MS−Windows)C
SOUNDC−2APPENDIXAppendix CC
Sound Support (MS−Windows)C−3You can have sound effects being played when a predefined event in<strong>CrossView</strong> <strong>Pro</strong> occurs. You can configure the sound in the Sound settingsof the Control Panel of MS−Windows. Similar to assigning a sound to asystem event, you can assign a sound to a <strong>CrossView</strong> <strong>Pro</strong> event.Currently the following events are supported:Breakpoint hitFile has been downloaded<strong>CrossView</strong> <strong>Pro</strong> has started execution<strong>CrossView</strong> <strong>Pro</strong> is exitingRun command/buttonStep command/buttonStepOver command/buttonHalt command/buttonSymbols LoadedFatal (system) error occurredNon−fatal errorHow to add sound support1. Firstly all events must be specified to MS−Windows. You can do this byadding the following lines to the Registry under:My Computer\HKEY_CURRENT_USER\AppEvents\EventLabels\Use regedit to start the registry editor.snd_xvw_bphitsnd_xvw_downloadsnd_xvw_startsnd_xvw_exitsnd_xvw_runsnd_xvw_stepsnd_xvw_stepoversnd_xvw_stopsnd_xvw_syms_loadsnd_xvw_syserrorsnd_xvw_uerror"XVW Breakpoint Hit""XVW <strong>Pro</strong>gram Download""XVW Start""XVW Exit""XVW Run""XVW Step Into""XVW Step Over""XVW Stop""XVW Load Symbols""XVW syserror""XVW uerror"2. You must also add the same list of keys (without values) toMy Computer\HKEY_CURRENT_USER\AppEvents\Schemes\Apps\.Default\3. Now go and start the Sound settings in your Control Panel. Here you canassign a sound to each event. You can also assign None to an event, whichprevents <strong>CrossView</strong> <strong>Pro</strong> from playing a sound if that specific event occurs.• • • • • • • •
SOUNDC−4Appendix C4. For the sound effects to become operational, you also have to edit thexvw.ini file. You can do this using any editor, e.g. the Windowsnotepad command. Add the following line at an arbitrary line to yourxvw.ini file:sound_effects: TRUEIt is also possible to disable the sound effects by changing this line into:sound_effects: FALSENow all sound effects are disabled.
ADDENDUMROM/RAM MONITOR
Mon−2Execution EnvironmentROM/RAM MONITORADDENDUM
ROM/RAM MonitorMon−31 INTRODUCTIONThis addendum contains information specific for the <strong>C166</strong>/<strong>ST10</strong> familytarget boards with a ROM or RAM debug monitor. A target board can beeither an evaluation board or your own target board.If you are using an evaluation board, the evaluation board’s user manual isalways the first source of information; this addendum covers theevaluation board’s interaction with <strong>CrossView</strong> <strong>Pro</strong>.2 EXECUTABLE NAMEThe following <strong>CrossView</strong> <strong>Pro</strong> executable is delivered with the package (forPC with .exe extension):xfw166<strong>CrossView</strong> <strong>Pro</strong> <strong>Debugger</strong> for the <strong>C166</strong>/<strong>ST10</strong>The target board connection using a serial or CAN interface is delivered asa separate DLL within the package:dieva166.dll<strong>CrossView</strong> <strong>Pro</strong> <strong>Debugger</strong> target board connection(for UNIX with .so extension)3 GENERAL OPERATIONTo debug your application with <strong>CrossView</strong> <strong>Pro</strong> it has to be executed in anC16x, <strong>ST10</strong>, XC16x or Super10 family hardware environment. This<strong>CrossView</strong> <strong>Pro</strong> version was designed to have full control over thefollowing target boards:• any board running the TASKING <strong>C166</strong>/<strong>ST10</strong> ROM debug monitor• any board running the TASKING <strong>C166</strong>/<strong>ST10</strong> RAM debug monitorThe TASKING <strong>C166</strong>/<strong>ST10</strong> ROM and RAM debug monitors are included inthe package, as source code in the mon subdirectory and configured forseveral boards in the etc directory. The ROM debug monitor should beburned into an EPROM on the target board. The RAM debug monitor isdownloaded into on−board RAM by means of the on−chip bootstraploader.• • • • • • • •
Mon−4Execution Environment<strong>CrossView</strong> <strong>Pro</strong> knows which resources to use for a target board by readinga target configuration file. You can select one of the target configurationfiles by using the −tcfg option or by selecting the target configuration filefrom the Target Settings dialog (Target | Settings...).4 RESTRICTIONSFacilities for hardware breakpoints, real−time kernel support and trace areabsent on these evaluation boards. As a consequence, the <strong>CrossView</strong> <strong>Pro</strong>commands bd and bD for data breakpoints, the commands bt, bti, btI, etand l t for kernel support, and the command ct for C−level tracing, are notavailable. Due to the binary command interface between debugger andevaluation board, the >& command to record target communication andthe o command for transparency mode are not available.<strong>Pro</strong>filing is only available for ICEs that support it. Contact your ICE vendorto ask if they support profiling.Menu and dialog items related to the mentioned commands are disabled(grayed out).ROM/RAM MONITORWhen a breakpoint is set in an ATOMIC or EXTEND sequence, <strong>CrossView</strong><strong>Pro</strong> will set a breakpoint at the first instruction after the sequence. Withinan ATOMIC or EXTEND sequence ’class A’ hardware traps are nothandled. Therefore, it is not possible to set a breakpoint within asequence, because breakpoints are set by a TRAP #2 (NMI) instructionwhich is a ‘class A’ hardware trap.
ROM/RAM MonitorMon−55 THE RAM AND ROM DEBUG MONITORFor running and debugging an application on your target board with<strong>CrossView</strong> <strong>Pro</strong>, a debug monitor must be running on that board. Themonitor used for the C16x/<strong>ST10</strong> or XC16x/Super10 and derivativescommunicates with <strong>CrossView</strong> <strong>Pro</strong> using a binary protocol via anasynchronous serial port or CAN port of the processor. This monitor canbe present on the target board in an EPROM (ROM debug monitor) or canbe downloaded into RAM by <strong>CrossView</strong> <strong>Pro</strong>, using the on−chip bootstraploader (RAM debug monitor).The <strong>CrossView</strong> <strong>Pro</strong> package contains several configurations of theROM/RAM debug monitor and also the source and makefiles are includedto build the monitor in a configuration which suites your target board.5.1 MONITOR CONFIGURATIONSThe monitor exists in the following basic configurations for all derivatives.• RAM debug monitor loaded using on−chip bootstrap loader (BSL)• ROM debug monitor using dual vector table method• ROM debug monitor using memory switchThe following sections describe these configurations.5.1.1 RAM DEBUG MONITORFor loading the monitor in RAM, the on−chip bootstrap loader (BSL) isused. The processor is started in BSL mode by activation of one or more ofits pins during the hardware reset. See the BSL description in the CPUuser’s manual for more information about activation of the on−chip BSL.<strong>CrossView</strong> <strong>Pro</strong> detects if the CPU is in the BSL−mode by sending anull−byte to the serial channel. If the CPU is in BSL−mode it detects thebaud rate from this null−byte and sends an acknowledge byte back to<strong>CrossView</strong> <strong>Pro</strong>. When this acknowledge byte matches the byte specifiedfor the selected target board <strong>CrossView</strong> <strong>Pro</strong> knows that the CPU is inBSL−mode. If the monitor has already been loaded before and running, itanswers with an acknowledge byte (0xAA) which is different from allpossible BSL acknowledge bytes. Once <strong>CrossView</strong> <strong>Pro</strong> detects that theCPU is in BSL−mode it continues with the boot sequence. This bootsequence is as follows:• • • • • • • •
Mon−6Execution Environment1. Sending boot program.<strong>CrossView</strong> <strong>Pro</strong> sends a boot−program to the serial port (up to 960 bytes).The on−chip bootstrap code reads the first 32 bytes from serial port 0 andstarts running this code. This part of the boot−program contains a smallserial input loop. The small serial input loop reads the remaining part ofthe boot−program and continues execution. This boot−program, whichnow runs, is in fact a restricted monitor.2. Initializing registers.<strong>CrossView</strong> <strong>Pro</strong> now first sends a byte−number to identify how manyregisters will be sent to the boot−program to configure the registers (with amaximum of six) before the EINIT instruction in the boot−program isexecuted. The EINIT is required, because it causes the #RSTOUT pin togo high which may be required to indicate the hardware on the targetboard that initialization is done. <strong>CrossView</strong> <strong>Pro</strong> now sends a null byte so atarget could now synchronize its communication port. the monitorresponds with an acknowledge byte. Then <strong>CrossView</strong> <strong>Pro</strong> also sendscommands for initializing registers to values as specified in the targetconfiguration file. This way it is possible to setup a configuration for theexternal memory before downloading the monitor.ROM/RAM MONITOR3. Sending monitor program.<strong>CrossView</strong> <strong>Pro</strong> now sends the full monitor program to the target board byusing the restricted command set of the boot−program.4. Booting the monitor.After the monitor is loaded <strong>CrossView</strong> <strong>Pro</strong> sends a GO command to theboot program and the monitor is started. This is done by means of asoftware reset instruction (SRST) which causes the CPU to exit theBSL−mode. The memory previously occupied by the boot−program is nowfree to be used by your application. After the SRST instruction it dependson the target board how the monitor is entered. When the BSL is activatedusing the NMI pin of the CPU, and this activation is not removed after the#RSTOUT pin went high (EINIT), an NMI interrupt will occur before thereset vector is executed. After the NMI interrupt is handled the reset vectorwill be executed. If the NMI pin was not used to initiate the BSL or whenactivation was removed on change of the #RSTOUT pin, the NMI interruptwill not occur and the reset vector is the first to be executed.
ROM/RAM MonitorMon−75. Initializing registers.The values of the registers specified in the configuration file with theeinit field are passed by the boot−program to the monitor by storing it ata location in internal RAM. This is possible because a SRST instructiondoes not erase the internal RAM. This way the register from theconfiguration file in the einit field could be initialized before the EINITinstruction in the monitor. The initialization of the other registers specifiedin the target configuration file is now done by using monitor commands.For each execution of the user application (step and run commands) themonitor installs the NMI and serial receive interrupt vectors to jump intothe monitor before the execution of the monitor is ended and the userapplication is started. The NMI vector is used for breakpoints and the serialreceive interrupt is used to jump into the monitor on the halt command of<strong>CrossView</strong> <strong>Pro</strong>. Because these vectors are each time reinstalled, loadingthe interrupt vector table of the user application over these vectors ispossible.The etc directory contains several boot programs and RAM debugmonitors. The target configuration files *.cfg (also in the etc directory)tell <strong>CrossView</strong> <strong>Pro</strong> which boot program and monitor can be used for aboard. The boot programs and monitors are in S−Record format (S1). Thefilename suffix is .sre.The following boot programs are available:Boot <strong>Pro</strong>grambtarget.srebtargetnrb.sreDescriptionfor all C16x/<strong>ST10</strong>, XC16x, Super10 derivatives. targetcan be one of 167, xc16x or ext2 respectively.for target (and derivative) boards which have no RAMselected by CS0. Therefore, the monitor is not startedwith a software reset but with a trap #0. This implies thatthe target remains in the bootstrap mode.• • • • • • • •
Mon−8Execution EnvironmentROM/RAM MONITORBoot <strong>Pro</strong>grambtargetnrbe.sreb164nrb.sreb167a.sreb167snrb.srebi_me167.srebext2f.srebext2i.srebext2fi.srebext2nrbi.srebxc16xi.srebxc16xnrbi.sreDescriptionTable Mon−1: Boot programsfor target (and derivative) boards which have no RAMselected by CS0. Therefore, the monitor is not startedwith a software reset but with a trap #0. This implies thatthe target remains in the bootstrap mode.All registers within the einit field are not stored anymorewithin the internal RAM and <strong>CrossView</strong> <strong>Pro</strong> initializes allspecified registers (necessary when more than sixregisters should be initialized without modifying themonitor sources). After initialization the EINIT instructionis executed with the monitor command EINIT.This is the most flexible boot program to initialize a targetboard. Use this boot program together with monitorprogram mtargetre.sre.same as b167nrb.sre but with the difference that nowtimer T3 is used for the BSL. Timer T3 is used when thetarget has only one GPT1, for example C164CI.for C167 AA step with 960 byte BSL instead of 32 byte.no RAM boot version and Phytec memory switch.for I+ME C167C board.same as bext2.sre but with the exception that the I/Ois initializazed with the Fractional Divider S0FDV to gethigher baud rates.same as bext2.sre but with an extra I/O initializationafter the EINIT instruction. This is necessary when theSYSCON1 clock divider does not have the default value.combination of the boot programs bext2f.sre andbext2i.sre.same as bext2nrb.sre but with an extra I/Oinitialization after the EINIT instruction. This is necessarywhen the SYSCON1 clock divider does not have thedefault value.same as bext2i.sre but built for the XC16xarchitecture.same as bext2nrbi.sre but built for the XC16xarchitecture.
ROM/RAM MonitorMon−9The following monitor programs are available:Monitor <strong>Pro</strong>grammtargetn.sremtargetr.sremtargetre.srem167cr.srem167crd.srem167mcp.srem167cmcp.srem167rvh.srem164r.sremext2b.sremext2fb.sreDescriptionfor C16x/<strong>ST10</strong>, XC16x, Super10 boards where the NMIinterrupt occurs before the reset vector is executed. AnNMI handler is installed to do the first initialization. targetcan be one of 167, xc16x or ext2 respectively.for target boards where no NMI occurs before the resetvector is executed.for target boards where no NMI occurs before the resetvector is executed.All registers within the einit field were not stored with theboot program and these registers will be sent to themonitor again to initialize the target. After initialization theEINIT instruction is executed with the monitor commandEINIT.This is the most flexible monitor program to initialize atarget board. Use this monitor program together with bootprogram btargetnrbe.sre.for C16x/<strong>ST10</strong> boards using CAN as communicationchannel.for C16x/<strong>ST10</strong> boards using CAN as communicationchannel, but has delay for writing new data. This delay isnecessary for the CAN−dongle that does not have aqueue.for C16x/<strong>ST10</strong> boards. Copies the RAM monitor fromROM to RAM and boots with the reset vector.for C16x/<strong>ST10</strong> boards using CAN as communicationchannel. Copies the RAM monitor from ROM to RAM andboots with the reset vector.for C16x/<strong>ST10</strong> boards. RAM monitor booting with thereset vector and Virtual output support and hardware flowcontrol.for C164 boards with RAM boot with reset vector. Use T4instead of T6 for baud rate.same as mext2r.sre with the difference that now thenew DEBUG interrupt is used for setting breakpoints sothe NMI vector is now available for the user application.same as mext2b.sre but with the exception that the I/Ois initializazed with the Fractional Divider S0FDV to gethigher baud rates.• • • • • • • •
Mon−10Execution EnvironmentMonitor <strong>Pro</strong>grammext2ib.sremxc16xb.sremexc16xib.sreDescriptionsame as mext2b.sre with the difference that in themonitor the EINIT instruction is not executed. The targetwill be configured according to the settings of the userapplication. The monitor could become inaccessiblewhen the configuration for the monitor (found in the .cfgfile) will differ from the configuration of the userapplication. Look also at the ’Note for the XC16x/Super10architectures’ found at the usage description of the einitfield.same as mext2b.sre but built for the XC16xarchitecture.same as mext2ib.sre but built for the XC16xarchitecture.Table Mon−2: RAM debug monitor programsThe monitors are configured as follows:ROM/RAM MONITORResource Start Endmonitor register bank 000FCC0h 000FCDFhC16x/<strong>ST10</strong> monitor code 0000200h 0000DFFhC16x/<strong>ST10</strong> monitor data 0000E00h 0000FFFhC16x/<strong>ST10</strong> monitor data 000FD00h 000FD4BhSuper10 monitor data 000DF00h 000DFFFhSuper10 monitor code 0C01000h 0C01FFFhXC16x monitor data 000CF00h 000CFFFhXC16x monitor code 0001000h 0001FFFhTable Mon−3: RAM debug monitor configurationThese memory ranges should be reserved using the RESERVE MEMORYcontrol while locating your application with l166.Example:RESERVE MEMORY( 0FCC0h TO 0FCDFh, 0200h TO 0FFFh,0FD00h TO 0FD4Bh )
ROM/RAM MonitorMon−115.1.2 ROM DEBUG MONITOR USING DUAL VECTORTABLEWhen the monitor is burned into EPROM, the interrupt vector table shouldalready be initialized with the RESET, NMI and serial receive interruptvectors to be able to boot the monitor. In the dual vector tableconfiguration all other interrupt vectors point to the user vector table inRAM. You can locate the user vector table at an address in RAM with theVECTAB( address ) control while locating the application. When theabsolute output file of the locator is formatted using the ieee166 program,you should use the command line option −saddress of ieee166 to set thestart address of the user program. When in <strong>CrossView</strong> <strong>Pro</strong> you shouldalways reset first with the rst command or from the Run menu, selectReset Application.The following S−record (S1) files for burning into EPROMS are installed inthe etc directory:m167d.sremext2d.sremxc16xd.sreROM debug monitor with dual vector table for theC16x/<strong>ST10</strong> derivativesROM debug monitor with dual vector table for theSuper10 architectureROM debug monitor with dual vector table for theXC16x architecture• • • • • • • •
Mon−12Execution EnvironmentThe ROM debug monitors with dual vector table are by default configuredas follows:Resource Start Endmonitor register bank 0FCC0h 0FCDFhC16x/<strong>ST10</strong> monitor code 00000h 00FFFhC16x/<strong>ST10</strong> monitor data 0FD00h 0FD8FhC16x/<strong>ST10</strong> application user interrupt 08000h 081FFhvector tableXC16x/Super10 monitor code 0C00000h 0C01FFFhSuper10 monitor data 0DF00h 0DF8FhXC16x monitor data 0CF00h 0CF8FhXC16x/Super10 application user interruptvector table00000h00FFFhTable Mon−4: ROM debug monitor (dual vector table) configurationROM/RAM MONITORThe memory ranges for monitor code data and register bank should bereserved using the RESERVE MEMORY control while locating yourapplication with l166. The vector table of your application should belocated using the VECTAB(address) control.Example:RESERVE MEMORY( 0FCC0h TO 0FCDFh, 0000h TO 0FFFh,0FD00h TO 0FD8Fh )VECTAB( 8000h )
ROM/RAM MonitorMon−135.1.3 ROM DEBUG MONITOR USING MEMORY SWITCHIn this configuration the monitor and vector table are in EPROM starting ataddress 0000h. When the monitor is booted, the EINIT instruction causesthe RSTOUT pin of the controller be toggled. The hardware will then swapthe EPROM with a RAM area and the monitor will continue execution atthe new EPROM address.For each execution of the user application (step and run commands) themonitor installs the NMI and serial receive interrupt to jump into themonitor before the execution of the monitor is ended and the userapplication is started. The NMI vector is used for breakpoints and the serialreceive interrupt is used to jump into the monitor on the halt command of<strong>CrossView</strong> <strong>Pro</strong>. Because these vectors are each time reinstalled, locatingthe interrupt vector table of the user application over these vectors ispossible.The following S−record (S1) file for burning into EPROMS is installed inthe etc directory:m167s.sreROM debug monitor for C16x/<strong>ST10</strong> derivativesThis monitor is configured as follows:Resource Start Endmonitor register bank 0FCC0h 0FCDFhmonitor code after swap 08000h 08FFFhmonitor data after swap 00200h 0027FhTable Mon−5: ROM debug monitor (memory switch) configurationThe memory ranges for monitor code, data and register bank should bereserved using the RESERVE MEMORY control while locating yourapplication with l166.Example:RESERVE MEMORY( 0FCC0h TO 0FCDFh, 08000h TO 08FFFh,0200h TO 027Fh )• • • • • • • •
Mon−14Execution Environment5.2 RESOURCES USED BY THE DEBUG MONITORSThe system stack size is set at startup of the monitor according to thevalues defined in the startup code cstart.asm or else the size is set to256 words. The monitor uses the same system stack area and system stackpointer as your application. When program execution returns from yourapplication into the monitor, the monitor continues using the system stackspecified by SP where your program left of. So, remember that it ispossible that the system stack overflows when debugging, despite of thefact that the size of the system stack is large enough when you run yourprogram standalone.Initially, the system stack pointer SP is set to 0FA40H for the monitor,which makes it possible to debug the startup code in your program. Theapplication startup code sets the definite values for the system stackpointers SP, STKOV and STKUN.The monitors use the following resources:ROM/RAM MONITORResourceC16x/<strong>ST10</strong> XC16x/Super10 monitormonitorserial port S0 S0interrupts used NMI, S0RINT S0RINT, NMI or DEBUGsystem stack 32 words 48 wordsinternal RAM (regbank) 16 words 16 wordsRAM for data 136 bytes 136 bytesRAM/ROM for code < 3K < 3KRAM/ROM for code < 3K < 3KCAN interfaceTable Mon−6: Monitor resourcesmessage 1 and 2 using ID30 and ID31The monitor uses a maximum of 16 bytes of system stack space startingfrom the current system stack pointer (SP) of your program (i.e. themonitor uses the system stack of your program). Initially the SP is set to0FA40h by the monitor, which makes it possible to debug your startupcode before the SP is set.The monitor does not use any user stack space of the user application. Ithas its own user stack in the "RAM for data" area.
ROM/RAM MonitorMon−15• • • • • • • •The NMI and the S0RINT interrupt cannot be used by your program. Bothvectors should be located in RAM because the monitor refreshes them onexit. This is needed to be able to restart the monitor after downloading anapplication which overwrites the vector table.All SFRs used by the monitor are saved on entry of the monitor and theyare restored before the program is continued.The <strong>CrossView</strong> <strong>Pro</strong> debugger sets a breakpoint by exchanging the code onthe breakpoint with a TRAP #NMI instruction. When the breakpoint is hit<strong>CrossView</strong> <strong>Pro</strong> writes the original code at the breakpoint address.Therefore, the user program must be in RAM. As a consequence, themonitor may also be entered when an NMI is caused externally by ahigh−to−low transition at the NMI#−pin.On entry of the monitor (e.g. after a breakpoint) all timer registersT01CON, T2CON, T3CON, T4CON, T5CON, T6CON (and T78CON for the167) are saved and set to zero. This way the timers are stopped while themonitor is running. The timers are reloaded with the saved value beforecontinuing with the user program.At startup the monitor executes the DISWDT and the EINIT instruction.The DISWDT instruction disables the watchdog timer, and it cannot beenabled by the user program. The EINIT instruction causes the RSTOUT#pin to go high. This pin cannot be used by the user program.The serial receive interrupt vector S0RINT (or S1RINT when configuredfor port S1) is used by the monitor to abort execution of the user program.This interrupt vector points to the start address of the monitor. If programexecution needs to be aborted, the debugger sends an escape sequence tothe serial port to cause an interrupt. When the interrupt is serviced by theCPU the monitor is trapped and debugging continues. The receiveinterrupt level for the serial port is set to the lowest priority (ILVL=1 andGLVL=0). These interrupt levels can be changed in the monitor source. Seesection 5.3 Rebuilding the Debug Monitors for more information. Theinterrupt enable bit in the program status word (PSW) is enabled in themonitor and need to stay enabled when the user program is running.Otherwise, interrupting the program from the debugger is not possible.For the RAM debug monitor for the C16x the WR# pin and the BHE# pinare enabled at startup of the monitor. The init field in the targetconfiguration file can be used to change the values at startup. The signalBHE# is used by the chip−select logic for the 16−bit data bus modes. Herethe signal may not be disabled by the user, respectively port P3.12 maynot be used as an I/O port.
Mon−16Execution Environment5.3 REBUILDING THE DEBUG MONITORSThe monitor and boot programs are also included as source, installed inthe mon subdirectory. This directory contains the following files:boot.cboot_get.cbootcom.hboot.ilocommand.cmemcopy.cmemcopy.hid.cthe boot program for RAM debug monitorinput from serial port functions for RAM boot programdata structures to save data for the switch from bootprogram to monitorlocator invocation file for locating the bootstrap loaderthe command interface for ROM and RAM debugmonitorfunctionality to copy the ROM monitor into RAM andrun from copied RAMdefinitions and prototypes for memcopy.cthe monitor version string routineROM/RAM MONITORio.ciocan.ccandef.hioserial.cioserial.hvio.cvio.hflash_exe.cflash_exe.hflash_ptr.hthe general low−level I/O routines for ROM and RAMdebug monitorthe CAN low−level I/O routines for ROM and RAMdebug monitordefinitions for CAN, used by iocan.c and mon.cthe serial low−level I/O routines for ROM and RAMdebug monitordefinitions for ioserial.cthe virtual output routines for ROM and RAM debugmonitor that cannot stop the applicationdefinitions for vio.cthe flash programming monitorflash programming monitor definitionsdefinitions and prototype for flash setup
ROM/RAM MonitorMon−17flash_st10f16x.cflash_st10f276.cadditional flash routines for the <strong>ST10</strong>x168additional flash routines for the <strong>ST10</strong>x276trap.ctrap_get.cvectabl.asmmon.cmon.hmon.ilomondef.hmakefileset specific monitor trap vectorget specific monitor trap vectorcontains the interrupt vector table for the ROM debugmonitor with dual vector table configurationthe mainline and startup code of ROM and RAM debugmonitordefinitions and prototypeslocator invocation file for all configurations of themonitor. This file is preprocessed by the Cpreprocessor to select a configurationdefinitions for all configurationsused to build all monitors. This makefile uses themakefiles in the mon167, monext2 and monxc16xsubdirectories.subdirectory mon167:makefileused to build C16x/<strong>ST10</strong> debug monitors and bootprogramssubdirectory monext2:makefileused to build Super10 debug monitors and bootprogramssubdirectory monxc16x:makefileused to build XC16x debug monitors and bootprogramsWhen you have the TASKING <strong>C166</strong>/<strong>ST10</strong> C compiler version 5.0 or higheryou can rebuild the monitors. Make the mon subdirectory the currentworking directory and type:mk166• • • • • • • •
Mon−18Execution EnvironmentThe S−Record files (.sre) of the boot programs and monitors are createdin the mon167, monext2 and monxc16x subdirectories. If you need theIntel HEX file format (for example, for programming into flash) instead ofthe Motorola S record format, type:mk166 IHEX=When you typemk166 cleanall files which can be created when building the monitors are removed.5.3.1 DEBUG MONITOR CONFIGURATIONPARAMETERSSelection of serial channelThe makefiles in the mon167, monext2 and monxc16x subdirectoriescontain a variable PORT which selects the serial channel the monitor isbuild for (0 or 1). Please run a mk166 clean before rebuilding the monitorwith a different PORT setting.ROM/RAM MONITORMonitor serial channel interrupt and group levelThe file mon.h contains the settings of interrupt level (SxILVL) and grouplevel (SxGLVL) of the serial interrupt of the monitor. When you have tasksrunning at a higher interrupt/group level than the monitor, you cannotbreak into the monitor when that task is active. In this case you should setthe defines SxILVL and SxGLVL to a higher value. If you want, forexample, PEC transfer to continue while the monitor is active the monitorinterrupt/group level should be lower than the level of the PEC transfer.Memory modelThe boot program can only be translated in the medium memory model,using the special stack frame. The monitor is tuned to be translated in thesmall memory model. It cannot be translated in the tiny model becausehuge pointers are used. Translating it in the medium or large model ispossible. Note that the monitor does not need to be translated in the samememory model as your application.
ROM/RAM MonitorMon−19Memory configurationThe memory configuration depends on the values of the SYSCON,CPUCON1, VECSEG, BUSCON and ADDRSEL registers. The values forthese registers can be specified with the einit and init fields for theselected target board in a target configuration file (.cfg). <strong>CrossView</strong> <strong>Pro</strong>will initialize the registers as specified just after booting the boot programand just after booting the monitor. This is not the case for the registersspecified within the einit field, because they cannot be modified afterexecution of the EINIT instruction. For this reason <strong>CrossView</strong> <strong>Pro</strong> alwayssends the values as specified in the einit field before the boot programhas executed the EINIT instruction. These values are passed by the bootprogram to the monitor by storing them in the internal memory which isnot changed by a SRST instruction.Memory layoutThe memory layout of the three basic configurations of the monitor isdefined in the locator invocation file mon.ilo with defines in mondef.h.The files are preprocessed by the C preprocessor to select one of the threeconfigurations and to substitute the defined macros. The followingparameters can easily be changed in the mondef.h file by changing thedefines:MON_RB_STARTThe start address of the monitor register bank, default 0FCC0h.ROM_STARTThe start address of the monitor code in ROM.ROM_SIZEThe monitor code size.RAM_STARTThe start address of the monitor data in RAM.RAM_SIZEThe monitor data size.• • • • • • • •
Mon−20Execution EnvironmentVECTAB_APP_STARTThe start address of the vector table of the user application for theROM dual vector table configuration. All vectors except the reset, NMIand serial receive interrupt vectors in the monitor vector table jump toa vector table starting at this address in RAM. The default is 08000h.VECTAB_MON_STARTThe start address of the monitor for the ROM dual vector tableconfiguration.Startup configure at NMIC16x/<strong>ST10</strong> derivatives can enter the bootstrap mode by activating the NMIpin in combination with another port pin. When the bootstrap programstarts the monitor using the SRST instruction, the following may happen:1. the target board has deactivated the NMI pin when the RSTOUT pinwent low. Then the NMI remains deactivated when the SRSTinstruction causes the RSTOUT pin to go high again.2. the target board did not deactivate the NMI pin or activated it again atthe SRST instruction.ROM/RAM MONITORNow the NMI occurs before starting at the reset vector.To cope with both situations the monitor module main.c uses a Cpreprocessor macro NMI_STARTUP. When this macro is set, an additionalNMI handler is defined. This NMI handler does the startup configuration ofthe CPU and then returns. Then the monitor main function is executedfrom the reset vector.When this macro is not set, the CPU is configured by the main functionexecuted from the reset vector.
ROM/RAM MonitorMon−215.4 DEBUG MONITOR INTERFACE DESCRIPTIONThis section describes the interface protocol which allows host computerdebuggers to communicate with target RAM debug monitors.5.4.1 INITIALIZATIONTo initiate the connection, the host sends a null byte to the target. In caseof a serial link, the target monitor measures the time between start bit andstop bit, and the monitor should appropriately set up the baud rategenerator.Then the host sends the SYNC command to synchronize host program andtarget monitor. The monitor should reply with the acknowledge byte:0xAA.Now the connection is established at monitor command interface level.5.4.2 CONVENTIONScommandName of the command as used in descriptions and documentation.Token:Decimal code for command byte.Parameters:Additional data which should be supplied with the command token.Returns:Data returned by monitor. Hexadecimal numbers are prepended by 0x.The data format, if applicable, is annotated between parentheses. If theformat is to be applied more than once, the format is preceded orsucceeded by a count number and multiplication operator. These are thedata formats used:• • • • • • • •
ROM/RAM MONITORMon−22Execution EnvironmentADDR: 4−byte address, little endianWORD: 2−byte word, little endianBYTE: 1 byteSTRING: set of subsequent bytes, all non−zero, terminatedby a byte with zero value.
ROM/RAM MonitorMon−235.4.3 COMMAND SETNULLDescription:Dummy command, no action to be performed.Token:0 (BYTE)Parameters:noneReturns:When the monitor supports the EINIT command and the command is notyet executed:0xEE(BYTE)otherwise:0xAA(BYTE)• • • • • • • •
Mon−24Execution EnvironmentPCTOMEMDescription:Send number of bytes from host to target. Start address and start address +count must be in the same 16K page.Token:1 (BYTE)Parameters:start addresscountdata byte(ADDR)(WORD)(BYTE) * countReturns:noneMEMTOPCROM/RAM MONITORDescription:Receive number of bytes from target at host. Start address and start address+ count must be in the same 16K page.Token:2 (BYTE)Parameters:start addresscountReturns:data byte(ADDR)(WORD)(BYTE) * count
ROM/RAM MonitorMon−25POKEDescription:Write a 16−bit word to target. The supplied address parameter must beeven.Token:3 (BYTE)Parameters:addressvalue(ADDR)(WORD)Returns:nonePEEKDescription:Read a 16−bit word from target. The supplied address parameter must beeven.Token:4 (BYTE)Parameters:addressReturns:value(ADDR)(WORD)• • • • • • • •
Mon−26Execution EnvironmentREGLOADDescription:Receive all 16 user program General Purpose Register values from thetarget.Token:5 (BYTE)Parameters:noneROM/RAM MONITORReturns:reg R0 valuereg R1 valuereg R2 valuereg R3 valuereg R4 valuereg R5 valuereg R6 valuereg R7 valuereg R8 valuereg R9 valuereg R10 valuereg R11 valuereg R12 valuereg R13 valuereg R14 valuereg R15 value(WORD)(WORD)(WORD)(WORD)(WORD)(WORD)(WORD)(WORD)(WORD)(WORD)(WORD)(WORD)(WORD)(WORD)(WORD)(WORD)
ROM/RAM MonitorMon−27REGSAVEDescription:Send 16 new user program General Purpose Register values to target.Token:6 (BYTE)Parameters:reg R0 valuereg R1 valuereg R2 valuereg R3 valuereg R4 valuereg R5 valuereg R6 valuereg R7 valuereg R8 valuereg R9 valuereg R10 valuereg R11 valuereg R12 valuereg R13 valuereg R14 valuereg R15 value(WORD)(WORD)(WORD)(WORD)(WORD)(WORD)(WORD)(WORD)(WORD)(WORD)(WORD)(WORD)(WORD)(WORD)(WORD)(WORD)Returns:none• • • • • • • •
Mon−28Execution EnvironmentMOVMEMDescription:Copy range of target memory contents to another memory location. Sourcerange and destination range should be in the same 16K page.Token:7 (BYTE)Parameters:src range startsrc range enddest range startReturns:0xAA(ADDR)(ADDR)(ADDR)(BYTE)FILLMEMROM/RAM MONITORDescription:Fill a target memory range with a specific value.Token:9 (BYTE)Parameters:start address (ADDR)count (ADDR)fill value (WORD)Returns:0xAA (BYTE)
ROM/RAM MonitorMon−29SETIPDescription:Set user program CSP:IP registers on target to given address value .Token:14 0x0E (BYTE)Parameters:new CSP:IP value(ADDR)Returns:noneVERSIONDescription:Receive the target monitor version string.Token:15 0x0F (BYTE)Parameters:noneReturns:monitor id string(STRING)• • • • • • • •
Mon−30Execution EnvironmentGODescription:Start user program on target.Token:16 0x10 (BYTE)Parameters:noneReturns:noneSHOWSTATROM/RAM MONITORDescription:Receive user program’s most important SFR values.Token:17 0x11 (BYTE)Parameters:noneReturns:reg CP value(WORD)reg IP value(WORD)reg CSP value (WORD)reg PSW value (WORD)reg SP value(WORD)reg DPP0 value (WORD)reg DPP1 value (WORD)reg DPP2 value (WORD)reg DPP3 value (WORD)reg ADCON value (WORD)reg STKOV value (WORD)
ROM/RAM MonitorMon−31reg STKUN valuereg T01CON valuereg T2CON valuereg T3CON valuereg T4CON valuereg T5CON valuereg T6CON valuereg T78CON valuereg TFR value(WORD)(WORD)(WORD)(WORD)(WORD)(WORD)(WORD)(WORD)(WORD)SYNCDescription:Test if target monitor is alive. Monitor should return acknowledge token0xAA.Token:20 0x14 (BYTE)Parameters:noneReturns:0xAA(BYTE)• • • • • • • •
Mon−32Execution EnvironmentMONADRDescription:Receive target memory locations where the user program resources aresaved when the target monitor is running and uses these resources itself.Token:21 0x15 (BYTE)Parameters:noneReturns:saved regs address(ADDR)ILVLROM/RAM MONITORDescription:Write the monitor ILVL/priority to the target. The interrupt/priority levelshould be 15 or lower. When the monitor should allow certain interruptroutines to continue to be served when the program is halted, this monitorinterrupt/priority level should be lower than the interrupt level of theinterrupt routines.Token:22 0x16 (BYTE)Parameters:interrupt levelReturns:none(BYTE)
ROM/RAM MonitorMon−33DEBUGDescription:Receive the debug instruction that will activate the monitor when abreakpoint is encountered.This instruction is the trap function with corresponding trap number.Token:25 0x19 (BYTE)Parameters:noneReturns:used trap intruction(WORD)BAUD_ZLDescription:Internal use to calculate the baud rate oscillator frequency used on thetarget board.Token:26 0x1A (BYTE)Parameters:noneReturns:myltiply factorbaud rate zero length(BYTE)(WORD)• • • • • • • •
Mon−34Execution EnvironmentEINITDescription:Internal use to execute the einit instruction to initialize the target at startup.Token:32 0x20 (BYTE)Parameters:noneReturns:noneROM/RAM MONITOR
ROM/RAM MonitorMon−356 THE TARGET CONFIGURATION FILEThe target configuration files (*.cfg) describe the available target boards.These files are text files and can be edited with any text editor.Empty lines, lines consisting of only white space are allowed. Commentstarts at an exclamation−sign (’!’) and ends at the end of the line.An information line has the following synopsis:[! comment] field: [subfield =] field−valuefieldsubfieldfield−valuecommentone of the keywords described belowthe usage of this part depends on the value of field, seebelowthe value assigned to the fieldoptional commentThe fields listed in the configuration file are:Fieldtitlecpu_typeDescriptionThe full name of the configuration. Thisname will be displayed in the Targetconfiguration field of Target Settingsdialog.The name of the CPU present on thetarget board. <strong>CrossView</strong> <strong>Pro</strong> knows fourtypes of CPUs, 167, 167mac, ext2macand ext22mac. ’167’ represents theextended architecture, like the C161,C163, C164, C165 and C167 families.’167mac’ represents the extendedarchitecture including the MACcoprocessor, like the <strong>ST10</strong>x262 and<strong>ST10</strong>x272 families. ’ext2mac’ representsthe second extended architectures likethe XC16x and Super10. ’ext22mac’represents the enhanced Super10architectures.• • • • • • • •
Mon−36Execution EnvironmentROM/RAM MONITORFielddebug_instrument_modulebslackbootmonitorflash_monitorDescriptionThe name of the Debug Instrument(using GDI) used for debugging:’dieva166’ for a target board connectionusing a serial or CAN interface. Beaware, the name should be specifiedwithout the extension ’.dll’.The bootstrap loader identification byte ofthe CPU on the board. When <strong>CrossView</strong><strong>Pro</strong> receives this byte from the boardwhen making connection, it starts thebootstrap sequence. Please check yourchip manual, chapter ’Bootstrap loader’for the definition of this identification byte.You can specify multiple identificationbytes, by separating them with commas.The filename of the boot program fortarget boards using a bootstrap loader.<strong>CrossView</strong> <strong>Pro</strong> searches the bootprogram in the etc directory of theproduct or in the current workingdirectory. The field can be omitted whenthe ROM Monitor is placed in ROM orFLASH. When this field is omitted,<strong>CrossView</strong> <strong>Pro</strong> will issue an error whenthe target board requests bootstraploading.The filename of the monitor program fortarget boards using a RAM debugmonitor to be downloaded on the boardusing a bootstrap program. <strong>CrossView</strong><strong>Pro</strong> searches the monitor program in theetc directory of the product or in thecurrent working directory. The field canbe omitted when the ROM Monitor isplaced in ROM or FLASH. When this fieldis omitted, <strong>CrossView</strong> <strong>Pro</strong> will issue anerror when the target board requestsbootstrap loading.The filename of the flash programingmonitor, used for flashing files (forexample a ROM monitor) in an EPROM.
ROM/RAM MonitorMon−37Fieldflash_direct_accessflash_device_numflash_workspaceflash_vendor0flash_chip0flash_width0flash_chips0flash_base_address0register_filesysconinitDescriptionWhen set to TRUE, <strong>CrossView</strong> <strong>Pro</strong>performs flash operations using targetmemory read/write accesses. WhenFALSE, <strong>CrossView</strong> <strong>Pro</strong> downloads aFLASH programming monitor to thetarget and executes this program toperform the flash operations.The FLASH device number.The code address where the FLASHprogramming monitor must be loaded.The name of the FLASH device vendor.The name or type of FLASH device.The width (in bits) per FLASH device.The number of FLASH devices used.The start address of the memory rangethat will be covered by the FLASHdevice.The filename of the register file (*.def)to be used for the CPU on the target.When this field is omitted <strong>CrossView</strong> <strong>Pro</strong>uses the default reg.def as register file.This register file contains debuginformation for <strong>CrossView</strong> <strong>Pro</strong> like which(E)SFR registers are present and atwhich location.The initialization value for the SYSCONregister. This entry is here for backwardscompatibility only. The SYSCON registercan now be initialized usinginit.syscon.Initialize the register specified in thesubfield with the value specified infield−value. The register name in subfieldmust be known by <strong>CrossView</strong> <strong>Pro</strong>, i.e.,must be specified in the register file. Youcan specify multiple registers byseparating them with commas ’,’.• • • • • • • •
Mon−38Execution EnvironmentFieldeinitilvlreserveDescriptionInitialize the register specified in thesubfield with the value specified infield−value before the EINIT instruction isexecuted. Up to 6 registers can beinitialized before EINIT. The registername in subfield must be known by<strong>CrossView</strong> <strong>Pro</strong>, i.e., must be specified inthe register file. You can specify multipleregisters by separating them withcommas ’,’.Specify the monitor interrupt/priority level.This level should be 15 or lower. Whenthe monitor should allow certain interruptroutines to continue to be served whenthe program is halted, this monitorinterrupt/priority level should be lowerthan the interrupt level of the interruptroutines.The reserved memory ranges (from − to)for monitor resources. EDE uses this fieldto generate RESERVE MEMORY locatorcontrols. You can specify multiple rangesby separating them with commas ’,’.ROM/RAM MONITORreset_periodrs232_reset_pinrs232_reset_levelrs232_reset_hold_levelrs232_bootstrap_pinrs232_bootstrap_levelrs232_bootstrap_hold_levelTable Mon−7: Configuration file fieldsA period in milliseconds to hold the resetlevel at the required level.The name of the RS232−pin to reset thetarget, for example RTS.The level when the reset is active.The hold level when the reset is active.The name of the RS232−pin to set thetarget in bootstrap mode, for exampleDTR.The level when the BSL pin is active.The hold level when the BSL pin isactive.Notes:• Fields not required for the target can be omitted.• <strong>CrossView</strong> <strong>Pro</strong> searches for the *.cfg files in the current directory andin the etc directory.
ROM/RAM MonitorMon−39The SYSCON register will always be initialized before the boot programand monitor execute the EINIT instruction.The configuration files could have the following syscon/einitcombinations:1. syscon: 0x0080 ! configuration value for sysconeinit: − ! empty field, necessary for! new boot/monitor program.2. syscon: 0x0000 ! overruled value.einit: $syscon = 0x0080; ! new value3. einit: $syscon = 0x0080;Fields not required for the target board can be omitted.Example of a part of the target.cfg file.! Target board configuration file for <strong>CrossView</strong>title:Ertec EVA167cpu_type: 167bslack: 0xC5,0xA5boot:b167.sremonitor: m167n.sreregister_file: reg167.dateinit: $syscon = 0x0000;init: $addrsel1 = 0x0406, $buscon1 = 0x0680,$stkov = 0xfa00;debug_instrument_module: dieva166reserve: 0x200−0xFFF,0xFCC0−0xFCDF,0xFD00−0xFD4B<strong>CrossView</strong> <strong>Pro</strong> searches for the target configuration file in the currentdirectory and in the etc directory.On startup <strong>CrossView</strong> <strong>Pro</strong> reads the target configuration file in memoryand selects the target configuration file indicated with the −tcfg commandline option or by the target configuration field of Target | Settings...dialog. This board can be selected using the filename of the targetconfiguration file or the full name (title field) of the target board.• • • • • • • •
Mon−40Execution EnvironmentNote for the XC16x/Super10 architectures:For each execution of the user application (step and run commands) themonitor installs the interrupt vectors used by the monitor. So, when theuser application changes the VECSC in CPUCON1 or VECSEG the monitorcould not be accessed anymore and that results into a connection lossfrom <strong>CrossView</strong> <strong>Pro</strong>. The configuration file should be updated for yourown VECSC and VECSEG values.The CPUCON1 could be changed by the initialization routine of the userapplication when the monitor program mext2ib.sre or mxc16xib.sreis used.7 BUILDING YOUR APPLICATIONIn the start.asm file, the define EVA must be enabled (set to 1). TheEVA define is needed to force tiny model to execute with CPUsegmentation enabled. This implies that interrupt behavior innon−segmented mode cannot be done. However, calls within the tinymodel program are still executed as non−segmented.For the C16x/<strong>ST10</strong> derivatives the _EXT define must also be enabled to getC16x/<strong>ST10</strong> startup code.ROM/RAM MONITORWhen locating your application you should reserve the memory areas usedby the monitor running on your target board by using the RESERVEMEMORY control in the locator invocation. See the description of themonitor for your target board for a list of the ranges to be reserved.
ROM/RAM MonitorMon−418 CONNECTING TO THE TARGET BOARD8.1 RS−232All configurations of the monitor have an automatic baud rate detection.We recommend using a baudrate in the range 4800 to 19200 baud. Byusing the −D rs232,port,baud−rate (Execution environment port andcommunication Speed: baud−rate) option of <strong>CrossView</strong> <strong>Pro</strong> you can forcethe serial connection parameters to non−default values. You can use theCommunication Setup dialog (Target | Communication Setup...) to setthe port and baudrate. The set of valid parameters for PC host computersrunning MS−Windows is listed here:port:COM1 (default)COM2COM3COM4baud−rate: 1200240048009600 (default)19200The defaults for other host computers are:host computer port baud rateSun /dev/ttya 9600others /dev/tty00 9600Table Mon−8: Communication defaults UNIX hostsWhen your host computer can handle it, we advise you to use a baud rateof19200 to improve debugger performance. The monitor does notoperate at transmission speeds slower than 1200 bps.After a hardware reset, the monitor or the on−chip bootstrap loaderautomatically detects the transmission speed by analyzing the first bytereceived. Therefore, when selecting a different transmission speed for<strong>CrossView</strong> <strong>Pro</strong>, be sure to reset the target board first. If you do not, youwill get a connection error from <strong>CrossView</strong> <strong>Pro</strong>.• • • • • • • •
Mon−42Execution EnvironmentWhen connecting to the target board <strong>CrossView</strong> <strong>Pro</strong> first detects if amonitor is already running. If it gets a response from an on−chip bootstraploader instead of the monitor, it will start the boot sequence. First the bootprogram is sent to the serial port and then the debug monitor. When forthe selected target no boot or monitor program is specified in the targetconfiguration file, <strong>CrossView</strong> <strong>Pro</strong> cannot connect to the board.See also section 6, The Target Configuration File , in this addendum.On a connection error during startup of <strong>CrossView</strong> <strong>Pro</strong>, <strong>CrossView</strong> <strong>Pro</strong>comes up with a window where you have the following options:−−−−retry to connect to the target boardexit <strong>CrossView</strong> <strong>Pro</strong>change startup options, this should be used to select a differenttarget boardchange communication parameters, this should be used when youwant to select a different baud rate or communication channelYou can solve the problem that caused the error, reset the board, and clickthe Retry button to try connecting again.ROM/RAM MONITORIn the midst of a debug session, whenever <strong>CrossView</strong> <strong>Pro</strong> might loseconnection with the monitor, the debugger times out issues a errormessage in a window where you can choose to retry the last command orto exit <strong>CrossView</strong> <strong>Pro</strong>. You can reset the board and click the Retry buttonto reestablish the connection. When using a ROM monitor the memorycontents are not affected by the reset. When the board uses a RAM debugmonitor, <strong>CrossView</strong> <strong>Pro</strong> reboots the monitor using the on−chip bootstraploader and the boot program. Some memory is overwritten at startup ofthe boot program and monitor and your application must be downloadedagain using the download command dn or select DownloadApplication... from the File menu.The RAM debug monitor can only use serial port 0 of the CPU becauseonly that port can be used by the on−chip BSL. The ROM debug monitorsinstalled in the etc directory use port 0 by default. They should be rebuiltwhen port 1 has to be used.The monitors are always configured using 8 data bit, one stop bit and noparity.
ROM/RAM MonitorMon−438.2 CAN (WINDOWS ONLY)ROM/RAM monitors and configuration files are available for debuggingover the CAN interface.First a ROM/RAM monitor with CAN support must be downloaded via theRS−232 serial interface. The connection will be lost after downloading themonitor because the monitor now tries to communicate via the CANinterface whereas <strong>CrossView</strong> <strong>Pro</strong> still uses RS−232. <strong>CrossView</strong> <strong>Pro</strong> has tobe restarted with CAN support options to establish the CAN connection.1. Download the RAM/ROM monitor via the RS−232 interface:• From EDE select <strong>Pro</strong>ject | <strong>Pro</strong>ject Options... Expand the <strong>CrossView</strong><strong>Pro</strong> entry.• Select the Execution Environment entry and select a target with CANsupport in the Board configuration field (for example PhytecKitCON−167 using CAN debugging).• Select the RAM/ROM Monitor Communication Setup entry andselect RS−232, a serial port (for example COM1) and a baud rate (forexample 19200). The RAM/ROM monitor for the selected target will beloaded at <strong>CrossView</strong> startup.The command line equivalent looks like:xvw166 −D rs232,port,baud−rate −tcfg kc167c.cfgport:COM1, COM2, COM3, COM4baud−rate: 2400, 4800, 9600, 19200, 38400, 57600, 115200Configuration files are located in the etc directory of your toolchaininstallation directory.2. Establish connection via CAN interface:• Close <strong>CrossView</strong> <strong>Pro</strong>.• From EDE select <strong>Pro</strong>ject | <strong>Pro</strong>ject Options... Expand the <strong>CrossView</strong><strong>Pro</strong> entry.• Select the Execution Environment entry and select a target with CANsupport in the Board configuration field (for example PhytecKitCON−167 using CAN debugging).• • • • • • • •
Mon−44Execution Environment• Select the RAM/ROM Monitor Communication Setup entry andselect CAN. Select a CAN card manufacturer (for example PhytecNET−CAN) and the CAN interface card from this manufacturer (forexample pcNET−CAN).• Select the CAN Communication Setup entry and select a CAN baudrate and a CAN identifier. Depending on the selected CAN interfacecard, select values for the other editable fields as well.The command line equivalent looks like:xfw166 −D can,baud−rate,identifier,0,time_out | board_segment |hardware_index | port_IO_address,interface_card_ID,port−id |net_number | interrupt_number | hardware_channel[,manufacturer]−tfcg target_board.cfgbaud−rate: 50, 125, 250, 500, 1000identifier: Default is 30.This value is the send identifier host−>target); thereceive identifier target−>host) is identifier+1.time_out: tx/rx timeout of handle. Define to 0board_segment:Board segment the interface card is usingROM/RAM MONITORhardware_index: Index of the hardware (slot) (0,1,...)port_IO_address:The memory address used to access the (E)ISAcard.interface_card_ID: Vendor specific CAN host adapter. This number, incombination with the manufacturer, identifies aunique interface card.port_id:net_number:PC I/O port number or I/O channel used foraccessing the (E)ISA card.Locical net number the interface card is usinginterrupt_number: Interrupt number the CAN interface card is usinghardware_channel:Index of the channel (connector) (0,1,...)manufacturer:Name of the manufacturer of the CAN interfacecard. Together with the interface_card_ID, aunique interface card is defined.
ROM/RAM MonitorMon−45target_board:Name of the target configuration file (.cfg)For example:xfw166 −D can,500,30,0,0,0,0,pcnetcan −tcfg kc167c.cfg8.3 CAN INTERFACE MESSAGESThe following messages can be displayed while <strong>CrossView</strong> <strong>Pro</strong> iscommunicating over a CAN interface. The CAN−idname can be one ofESDNTCAN, IXXATVCI, PCAN, pcNETCAN or Vector.CAN−idname: can’t set baudrate for CAN interfaceSpecify one of the following baud rates. ESDNTCAN and PCAN support:50, 125, 250, 500, 1000. IXXATVCI supports: 10, 20, 50, 100,125, 250, 500, 800, 1000CAN−idname: can’t add id−number for CAN interfaceThe receive identifier is determined by the send identifier + 1. Thismessage occurs if this addition cannot be performed.CAN−idname: can’t find all required CAN interface argumentsNot all required interface arguments are specified.CAN−idname: found wrong interface card numberSpecify a valid interface_card_ID number to identify the vendor specificCAN host adapter.CAN−idname: found unsupported board typeSpecify the correct number of the interface card/board type.CAN−idname: can’t open CAN interfaceThe CAN interface could not be openend.CAN−idname: can’t initialize CAN interfaceThe CAN interface could not initialize the Timing register.CAN−idname: can’t start CAN interfaceThe CAN interface could not be started.• • • • • • • •
Mon−46Execution EnvironmentCAN−idname: can’t set acceptance−mask for CAN interfaceThe CAN interface could not set the Acceptance−Mask register.CAN−idname: can’t define transmit queue for CAN interfaceThe CAN interface could not create a transmit queue.CAN−idname: can’t define receive queue for CAN interfaceThe CAN interface could not create a receive queue.CAN−idname: can’t make assignment for CAN interfaceThe CAN interface could not make the assignment/blocking of messagesto the given receive queue.CAN−idname: can’t read from CAN interface<strong>CrossView</strong> <strong>Pro</strong> did not receive a message from the CAN interface.CAN−idname: can’t write to CAN interface<strong>CrossView</strong> <strong>Pro</strong> could not send a message to the CAN interface.ROM/RAM MONITORCAN−idname: found error − ILLPARMThe value of a parameter is invalid.CAN−idname: found error − ILLHWThe pcNETCAN hardware could not be found.CAN−idname: found error − BUSOFFBus error: the CAN controller went in a ’Bus−Off’ state.CAN−idname: found error − BUSERROR / BUSLIGHT / BUSHEAVYBus error: an error counter reached its limit.CAN−idname: found error − REGTESTAn error occured during the register test of the CAN controller.CAN−idname: found error − XMTFULLThe send buffer in the CAN controller is full.
ROM/RAM MonitorMon−47CAN−idname: found error − QXMTFULLThe send queue is full.CAN−idname: found error − RCVEMPTY<strong>CrossView</strong> <strong>Pro</strong> did not receive a new message from the CAN interface.CAN−idname: found error − QRCVEMPTYThe receive queue is empty.CAN−idname: found error − OVERRUNThe CAN controller was read too late.CAN−idname: found error − QOVERRUNThe receive queue was read too late.CAN−idname: found error − NOVXDVxD not loaded, license expired.CAN−idname: found error − RESOURCEA resource (FIFO, Client, Timeout) was not available.8.4 CONNECTION PROCESS MESSAGESThe following messages can be displayed while <strong>CrossView</strong> <strong>Pro</strong> isconnecting to the target board.Connecting to ’boardname’This message is printed when connecting for the first time in the session tothe board or when <strong>CrossView</strong> <strong>Pro</strong> did not get a response from the boardand starts connection.Connecting: waiting for response from the targetAfter detecting that the monitor is not alive <strong>CrossView</strong> <strong>Pro</strong> starts waitingfor a known response from the board. This response can either be thebootstrap acknowledge byte or a 0xAA response from the monitor.• • • • • • • •
Mon−48Execution EnvironmentConnecting: sending bootstrap<strong>CrossView</strong> <strong>Pro</strong> received the bootstrap loader acknowledge byte from theboard and starts the boot sequence. The bootstrap acknowledge byte for aboard is defined in the target configuration file (.cfg) with the fieldbslack.<strong>CrossView</strong> <strong>Pro</strong> starts downloading the boot program defined in the targetconfiguration file (.cfg).Connecting: Could not open S−record file<strong>CrossView</strong> <strong>Pro</strong> detected that no boot program file name is defined in thetarget configuration file (.cfg) for the selected board. Check if youselected the right board with the −tcfg command line option or with theTarget | Settings... menu.Connecting: sending monitor<strong>CrossView</strong> <strong>Pro</strong> starts downloading the monitor program defined in thetarget configuration file (.cfg).ROM/RAM MONITORConnecting: Target board not respondingAfter the boot program was downloaded and running <strong>CrossView</strong> <strong>Pro</strong> didnot get the expected response from it. See 8.5 Connection <strong>Pro</strong>blems for achecklist.Connecting: no or bad acknowledge from bootstrap loaderWhile downloading the monitor <strong>CrossView</strong> <strong>Pro</strong> did not get the expectedacknowledge from the boot program. <strong>CrossView</strong> <strong>Pro</strong> checks this each timea series of bytes is downloaded to the board.When <strong>CrossView</strong> <strong>Pro</strong> is ready downloading the monitor, it gives a GOcommand to the boot program. The boot program then executes a SRSTinstruction to boot the monitor. As soon as the monitor is running itshould give a response to <strong>CrossView</strong> <strong>Pro</strong>. This message is issued when<strong>CrossView</strong> <strong>Pro</strong> got no or an unexpected response. See 8.5 Connection<strong>Pro</strong>blems for a check list.Connecting: connection lostAfter <strong>CrossView</strong> <strong>Pro</strong> first detected that the monitor was running, someinitial commands are executed. Before the connection is marked asestablished, <strong>CrossView</strong> <strong>Pro</strong> does a last check if it the monitor is reallyalive. This message is issued when that check fails.
ROM/RAM MonitorMon−498.5 CONNECTION PROBLEMSWhen connection fails or errors occur, first check the following:• check if you selected the right target board. All target boards aredefined in a target configuration file (*.cfg). You can select thetarget board with the −tcfg option or with the Target | Settings...menu.• check if all parameters in the target configuration file match yourboard:− if you want to boot the monitor using the on−chip bootstraploader the bslack field must be defined, the right boot programmust be defined with the boot field and the right monitor mustbe defined with the mon field.− the init field can be used to initialize several registers. Theseregisters include bus and system configuration registers. Check ifthe values for these registers match your board configuration.Changing the bus mode on the board may imply that you haveto modify the values for these registers.− the registers specified in the init field must be defined as anSFR in the register file specified with the register_file field.Check if you specified the right register file, and if this registerfile includes these registers.See also section 6, The Target Configuration File, in this addendum.• you may have serial communication problemsWhen you have serial communication problems, check thefollowing:−−check the serial parameters: 8 data bit, 1 stop bit, no parity, nohandshake. You can set the parameters with the −D commandline option or the Target | Communication Setup... dialog.check whether the IRQ settings of both COM−ports do notconflict with any other device in the PC• • • • • • • •
Mon−50Execution Environment−check whether the target execution board loops back controlflow signals decently. If not make it yourself by creating thefollowing cable:host DCE | target DTE______________________ | ________________________signal pin D9 pin D25______________________| pin D25 pin D9 signal| ________________________RTS 7 4 >−− | 4 7 RTS| |CTS 8 5 −−−−−−−−> 2 3 TxD|RxD 2 3 −−−−−−−−> 7 5 GND|DSR 6 6 >−− | 6 6 DSR| |DTR 4 20
ROM/RAM MonitorMon−51cannot stop execution of user programThe serial receive interrupt used to break into monitor has by default avery low interrupt level (ILVL/GLVL). If your application keeps running aninterrupt with a higher interrupt level, the serial interrupt will not activatethe monitor or activates it too late. The interrupt level is set this low sothat if your application uses short interrupt routines, or PEC transfers at ahigher level, they can continue running. This problem can be solved byrebuilding the monitor program with a higher interrupt level.• • • • • • • •
Mon−52Execution Environment10 TARGET BOARD APPLICATION NOTESWhen you invoke <strong>CrossView</strong> <strong>Pro</strong>, you have to specify which board is usedwith the −tcfgcfg−filename option (see section 6, The TargetConfiguration File). You can select the board in the Target | Settings...dialog. From the selected target board <strong>CrossView</strong> <strong>Pro</strong> knows which CPU,boot program, monitor program and register file are used.The following table contains an overview of all supported target boards.Ertec GmbHBootstrapLoaderMonitorFlashMonitorConfiguration FileEVA165 b167.sre m167n.sre f167.sre eva165.cfgEVA167 b167.sre m167r.sre f167.sre eva167.cfgROM/RAM MONITORFS FORTH SystemeBootstrapLoaderMonitorFlashMonitorConfiguration FileEVA167 with C167CR Demux b167nrb.sre m167r.sre f167.sre fsf_167cr_demux.cfgEVA167 with C167CR Mux b167nrb.sre m167r.sre f167.sre fsf_167cr_mux.cfg<strong>ST10</strong>x168 b167nrb.sre m167r.sre f16x.sre fsf_168.cfg<strong>ST10</strong>x269 b167nrb.sre m167r.sre f167.sre fsf_269.cfg<strong>ST10</strong>x276 b167nrb.sre m167r.sre f276.sre fsf_276.cfg<strong>ST10</strong>x280 b167nrb.sre m167r.sre f167.sre fsf_280.cfgSuper10 Evaluation Board bext2i.sre mext2b.sre fext2.sre fsf_super10bo.cfgSuper10 Evaluation Board withfast baudratebext2f.sre mext2fb.sre fext2.sre fsf_super10bo_fbd.cfgSuper10R303 Evaluation Board bext2i.sre mext2b.sre fext2.sre fsf_super10r303.cfgSuper10R303 Evaluation Board bext2fi.sre mext2fb.sre fext2.sre fsf_super10r303_fbd.cfgwith fast baudrateI+ME ACTIABootstrapLoaderMonitorFlashMonitorConfiguration FileI+ME C167C bi_me167.sre m167r.sre f167.sre ime167c.cfgInfineonBootstrapLoaderMonitorFlashMonitorConfiguration FileEasy Utah 161U b167nrb.sre m167r.sre f167.sre inf_161u.cfgEasy Utah 161U with OCDS − m167ocds.sre − inf_161u_ocds.cfgEasy Utah V1.1 b167nrb.sre m167r.sre f167.sre inf_165utah.cfgEasy Utah V1.1 with OCDS − m167ocds.sre − inf_165utah_ocds.cfgM2 evaluation board b167nrb.sre m167r.sre f167.sre inf_sda6000.cfg
ROM/RAM MonitorMon−53InfineonBootstrapLoaderMonitorFlashMonitorConfiguration FileXC161CJ (DEMUX) bxc16xnrbe.sre mxc16xre.sre fxc16x.sre inf_xc161cj_demux.cfgXC161CJ (MUX) bxc16xnrbe.sre mxc16xre.sre fxc16x.sre inf_xc161cj_mux.cfgXC161CJ with OCDS (singlechip)− − fxc16xs.sre inf_xc161cj_ocds.cfgXC161CJ with OCDS (DEMUX) − − fxc16x.sre inf_xc161cj_ocds_demux.cfgXC161CJ with OCDS (MUX) − − fxc16x.sre inf_xc161cj_ocds_mux.cfgXC161CS (DEMUX) bxc16xnrbe.sre mxc16xre.sre fxc16x.sre inf_xc161cs_demux.cfgXC161CS (MUX) bxc16xnrbe.sre mxc16xre.sre fxc16x.sre inf_xc161cs_mux.cfgXC161CS with OCDS (singlechip)− − fxc16xs.sre inf_xc161cs_ocds.cfgXC161CS with OCDS (DEMUX) − − fxc16x.sre inf_xc161cs_ocds_demux.cfgXC161CS with OCDS (MUX) − − fxc16x.sre inf_xc161cs_ocds_mux.cfgXC164CS (DEMUX) bxc16xnrbe.sre mxc16xre.sre fxc16x.sre inf_xc164cs_demux.cfgXC164CS (MUX) bxc16xnrbe.sre mxc16xre.sre fxc16x.sre inf_xc164cs_mux.cfgXC164CS with OCDS (singlechip)− − fxc16xs.sre inf_xc164cs_ocds.cfgXC164CS with OCDS (DEMUX) − − fxc16x.sre inf_xc164cs_ocds_demux.cfgXC164CS with OCDS (MUX) − − fxc16x.sre inf_xc164cs_ocds_mux.cfgXC167CI (DEMUX) bxc16xnrbe.sre mxc16xre.sre fxc16x.sre inf_xc167ci_demux.cfgXC167CI (MUX) bxc16xnrbe.sre mxc16xre.sre fxc16x.sre inf_xc167ci_mux.cfgXC167CI with OCDS (singlechip)− − fxc16xs.sre inf_xc167ci_ocds.cfgXC167CI with OCDS (DEMUX) − − fxc16x.sre inf_xc167ci_ocds_demux.cfgXC167CI with OCDS (MUX) − − fxc16x.sre inf_xc167ci_ocds_mux.cfgPhytecBootstrapLoaderMonitorFlashMonitorConfiguration FileKitCON−160 with 161PI b167nrb.sre m167r.sre f167.sre kc161pi.cfgKitCON−160 with 161RI b167nrb.sre m167r.sre f167.sre kc161ri.cfgKitCON−161 b167nrb.sre m167r.sre f167.sre kc161.cfgKitCON−162 with 161CI b167nrb.sre m167r.sre f167.sre kc161ci.cfgKitCON−162 with 161CS b167nrb.sre m167r.sre f167.sre kc161cs.cfgKitCON−162 with 161JC b167nrb.sre m167r.sre f167.sre kc161jc.cfgKitCON−163 b167nrb.sre m167r.sre f167.sre kc163.cfgKitCON−164 b164nrb.sre m164r.sre f167.sre kc164.cfgKitCON−165 b167nrb.sre m167r.sre f167.sre kc165.cfgKitCON−167 b167nrb.sre m167r.sre f167.sre kc167.cfgKitCON−167 using CANdebuggingb167nrb.sre m167cr.sre f167.sre kc167c.cfg• • • • • • • •
Mon−54Execution EnvironmentPhytecKitCON−167 usingPEAK−CAN−DongleBootstrapLoaderMonitorFlashMonitorConfiguration Fileb167nrb.sre m167crd.sre f167.sre kc167cd.cfgMicroMODUL−165 b167nrb.sre m167r.sre f167.sre um165.cfgMiniMODUL−165 b167nrb.sre m167r.sre f167.sre mm165.cfgMiniMODUL−167CR b167nrb.sre m167r.sre f167.sre mm167cr.cfgMiniMODUL−167CS b167nrb.sre m167r.sre f167.sre phy_167cs_mm.cfgMiniMODUL−167CW b167nrb.sre m167r.sre f167.sre mm167cw.cfgMiniMODUL−<strong>ST10</strong>F168 b167nrb.sre m167r.sre f167x.sre mmst10f168.cfgNanoMODUL−164 b164nrb.sre m164r.sre f167.sre nm164.cfgphyCORE−161CS/JC/JI b167nrb.sre m167r.sre f167.sre phy_161jc_phycore.cfgphyCORE−167 b167nrb.sre m167r.sre f167.sre phy_167cs_phycore.cfgphyCORE−<strong>ST10</strong>F168 b167nrb.sre m167r.sre f167x.sre phy_168_phycore.cfgphyCORE−XC161CJ bxc16xnrbe.sre mxc16xre.sre fxc16x.sre phy_xc161cj_phycore.cfgphyCORE−XC161CJ withOCDS− − fxc16x.sre phy_xc161cj_phycore_ocds.cfgphyCORE−XC167CI bxc16xnrbe.sre mxc16xre.sre fxc16x.sre phy_xc167ci_phycore.cfgphyCORE−XC167CI with − − fxc16x.sre phy_xc167ci_phycore_ocds.cfgOCDSROM/RAM MONITORRigel CorporationBootstrapLoaderMonitorFlashMonitorConfiguration FileRMB−165 b167.sre m167r.sre f167.sre rmb165.cfgRMB−167 b167.sre m167r.sre f167.sre rmb167.cfgRMB−167CRI b167.sre m167r.sre f167.sre rm167cri.cfgRMB−167SR b167.sre m167r.sre f167.sre rmb167sr.cfgSTMicroelectronicsBootstrapLoaderMonitorFlashMonitorConfiguration FileSuper10 Evaluation Board bext2i.sre mext2b.sre fext2.sre evasuper10.cfgTara SystemsBootstrapLoaderMonitorFlashMonitorConfiguration FileTara Guido SDA6000 b167nrb.sre m167r.sre f167.sre tara_sda6000.cfgTQ−ComponentsBootstrapLoaderMonitorFlashMonitorConfiguration FileSTK16X with TQM164C b164nrb.sre m164r.sre f167.sre tqs_164ci_tqm164c.cfgSTK16X with TQM165 b167nrb.sre m167r.sre f167.sre tqs_165_tqm165.cfg
ROM/RAM MonitorMon−55TQ−ComponentsBootstrapLoaderMonitorFlashMonitorConfiguration FileSTK16X with TQM167C b167nrb.sre m167r.sre f167.sre tqs_167cr_tqm167c.cfgSTK16X with TQM167LC b167nrb.sre m167r.sre f167.sre tqs_167cr_tqm167lc.cfgSTK16XU with TQM167U b167nrb.sre m167r.sre f167.sre tqs_167cr_tqm167u.cfgSTK16XU with TQM167UE b167nrb.sre m167r.sre f167.sre tqs_167cr_tqm167ue.cfgSTK16XU with TQMX161U bxc16xnrbe.sre mxc16xre.sre fxc16x.sre tqs_xc161cj_tqmx161u.cfgSTK16XU with TQMX167U bxc16xnrbe.sre mxc16xre.sre fxc16x.sre tqs_xc167ci_tqmx167u.cfgOtherBootstrapLoaderMonitorFlashMonitorConfiguration FileRAM Monitor (default) b167.sre m167r.sre f167.sre default.cfgROM monitor C165 − − − rom165.cfgROM monitor C167 − − − rom167.cfgTable Mon−9: Supported target boardsThe following sections contain application notes on several target boards.10.1 ERTEC EVA165, EVA167 AND EVA167AAThe debugger has been developed and tested with EVA165 and EVA167boards which support the on−chip bootstrap loader (BSL). These boardsare using the TASKING RAM debug monitor for working with <strong>CrossView</strong><strong>Pro</strong>.The Ertec EVA167 manual (supplied with your evaluation board) explainshow to connect your board to the host computer. For more information onconnecting the target board to your host computer see also section 8,Connecting to the Target Board, in this addendum.To enable the BSL of the C16x the switch S2 on the evaluation board mustbe set to the position "ON". Then the bootstrap loader can be activatedwith a hardware reset.• • • • • • • •
Mon−56Execution Environment10.2 RIGEL RMB−165, RMB−167, RMB−167SR ANDRMB−167CRIThe debugger has been tested with the the RMB−165, RMB−167,RMB−167SR and the RMB−167CRI evaluation boards of RIGEL Corporation.The TASKING boot program and monitor can be loaded and downloadedby <strong>CrossView</strong> <strong>Pro</strong>. For more information about the boot program andmonitor see section 5, The RAM and ROM Debug Monitor.The Hardware <strong>Manual</strong> (supplied with your evaluation board) explains howto connect your board to the host computer.10.3 I+ME C167C BOARDThe I+ME C167C board uses the on−chip BSL to load the TASKING bootprogram and RAM debug monitor. Please read section 5, The RAM andROM Debug Monitor of this addendum first for more information on themonitor. The following section describes some details on the configurationfor the monitor for the I+ME C167C board.ROM/RAM MONITOR10.3.1 DEBUG MONITORSBecause of the unusual memory configuration, the boot program exists ina special configuration: bi_me167.sre. This boot program is translatedwith the C preprocessor macro I_ME_C167C defined which enables thecode to configure the memory for this board.<strong>CrossView</strong> <strong>Pro</strong> is only tested in combination with the RAM debug monitor.For using the RAM debug monitor the on−chip BSL should be enabledwith the appropriate jumper.10.3.2 CONNECTIONThe I+ME C167C board should be connected to the host computer usingthe D−Sub 9 female connector. The board does not loop back handshakesignals decently, so when you have connection problems please readsection 9 Troubleshooting the Debug Monitor first.
ROM/RAM MonitorMon−5710.4 PHYTEC MM−165, MM−167CR AND MM−167CWThe debugger has been tested with the PHYTEC miniModul−165, 167CRand 167CW plugged on the baseboard. The TASKING boot program andmonitor can be loaded and downloaded by <strong>CrossView</strong> <strong>Pro</strong>. For moreinformation about the boot program and monitor see section 5, The RAMand ROM Debug Monitor.The following sections describe some details on the configuration for themonitor for the MM−165, MM−167CR and MM−167CW boards.10.4.1 BOOT PROGRAMBecause of the unusual memory configuration, the boot programs exist ina special configuration: b167nrb.sre. This boot program is translatedwith the C preprocessor macro NORAMBOOT defined which enables thecode to start the monitor correctly. This boot program does not start themonitor with a software reset, but with a trap instruction. The reason forthis way of starting the monitor is that the RAM is selected with CS1instead of CS0. When a software reset is executed, the C16x uses CS0 toaddress the memory.10.4.2 CONNECTIONFor using the RAM debug monitor the mode jumper should be set to ’1’ toselect the appropriate memory configuration. The BSL should be enabledwith a resistor of 10K between the P0.4 and signal ground.The MM−165 or MM−167 board should be connected to the host computerusing the D−Sub 9 female connector. The board does not loop backhandshake signals decently, so when you have connection problemsplease read section 9 Troubleshooting the Debug Monitor first.• • • • • • • •
Mon−58Execution Environment10.5 PHYTEC KC−161, KC−163, KC−164 AND KC−167The debugger has been tested with the PHYTEC KitCon−161, 163, 164 and167. The TASKING boot program and monitor can be loaded anddownloaded by <strong>CrossView</strong> <strong>Pro</strong>. For more information about the bootprogram and monitor see section 5, The RAM and ROM Debug Monitor.The hardware manual, delivered with the KC−16x describes how toconnect the board to the host computer and how the board should beconfigured to enable bootstrap loading.10.6 TQ−COMPONENTS STK16X/STK16XU STARTERKITSROM/RAM MONITORThe debugger has been tested with the TQ−Components TQM164C,TQM165, TQM167C and TQM167LC mini−moduls that can be put onto thestarter kit STK16X and the TQM167U, TQM167UE, TQMX161U andTQMX167U mini−moduls that can be put onto the starter kit STK16XU.The mini−moduls are reset hardwired by the RS−232 serial port. With atarget reset the mini−moduls are set in BSL mode and so the TASKINGboot program and monitor can be loaded and downloaded by <strong>CrossView</strong><strong>Pro</strong>. For more information about the boot program and monitor seesection 5, The RAM and ROM Debug Monitor.
ADDENDUMSIMULATOR
SIMULATORSim−2Execution EnvironmentADDENDUM
SimulatorSim−31 INTRODUCTIONThis addendum contains information specific to the simulator version of<strong>CrossView</strong> <strong>Pro</strong> for the <strong>C166</strong>/<strong>ST10</strong>. The simulator use the host memory tosimulate the memory of the target. To avoid that the whole address range(up to 16MB) of these derivatives has to be allocated on the host, amemory map should be supplied to the simulator with the simulatorconfiguration file.2 EXECUTABLE NAMEThe following <strong>CrossView</strong> <strong>Pro</strong> executable is delivered with the package (forPC with .exe extension):xfw166<strong>CrossView</strong> <strong>Pro</strong> <strong>Debugger</strong> for the <strong>C166</strong>/<strong>ST10</strong>The simulator is delivered as a separate DLL within the package:disim166.dll<strong>CrossView</strong> <strong>Pro</strong> <strong>Debugger</strong> Simulator(for UNIX with .so extension)3 SUPPORTED FEATURESExcept for the restrictions mentioned in section 6, the simulator version ofthe debugger cleanly supports the standard features of <strong>CrossView</strong> <strong>Pro</strong>,including single stepping, code breakpoints, data breakpoints, tracesupport, C expression evaluation and record/playback capability. Thesimulator disim166 logs a user definable number of addresses of the mostrecent instructions. The simulator disim166 also supports code coverage,profiling, background debug mode and peripheral simulation.3.1 MAPPING MEMORYThe simulator version of the debugger can use the linker generated mapfile (with .map extension) to determine how much memory must beallocated from the system and how logical addresses are mapped tophysical addresses. In the Load Symbolic Debug dialog, select Use mapfile for memory map to specify that <strong>CrossView</strong> <strong>Pro</strong> must process theapplication specific memory definition before a new file is loaded and/ordownloaded to the target.• • • • • • • •
Sim−4Execution EnvironmentWhen you use EDE, the memory settings are automatically transferred tothe debugger. All memory mappings of your applications are automaticallydone by the debugger.4 PERIPHERAL SIMULATIONThe <strong>C166</strong>/<strong>ST10</strong> simulator includes peripheral simulation for a range ofperipherals. With peripheral simulation and CXL scripting you can makescenarios for testing (parts of) your application before hardware isavailable.4.1 PERIPHERAL SUPPORTThe simulator supports the following peripherals:• General purpose timers• Interrupt system• Peripheral Event Controller• Parallel ports• SSC/ASC Serial ports• Phased Locked Loop• Watchdog Timer• Real Time Clock• A/D converter• Capture Compare UnitSIMULATORFor XC16x/Super10, peripherals are only enabled when the alternatefunction is selected from the ALTSEL0Px register. When a peripheral isenabled from the ALTSEL1Px register the peripheral will not be enabledwithin the simulator.SSC/ASC Serial PortsThe SSC/ASC peripherals automatically get DIO (Debug Instrument I/O)streams assigned to terminal windows. You can use these terminalwindows to display and enter data from and to these peripherals. You canalso redirect the terminals to read or write data to/from files. If DIO is notdesired for these peripherals you can disable the DIO streams from within<strong>CrossView</strong> <strong>Pro</strong>. See section 10.4, Debug Instrument I/O for moreinformation on DIO.
SimulatorSim−5Parallel PortsThe processor pins for parallel port Px are available in <strong>CrossView</strong> <strong>Pro</strong> as aspecial register PORT_Px. The bits in these special registers are onlyeffective if the DPx register is set properly.A/D ConverterYou can use the <strong>CrossView</strong> <strong>Pro</strong> special register PIN_ADCx as replacementof the A/D converter external port pin. The value of this register is thevalue as put on the external ADC port pin. The type of this register isfloating point.The A/D converter also requires a ground and reference voltage. Thespecial registers PIN_VAREF and PIN_VAGND are for this purpose. Thetypes of these registers is also floating point.General Purpose TimersAll timers work only when there are no external inputs selected(TxUDE=0). In all cases when the transition level is used as trigger, it onlyworks on the OTL level of the core timer.The following four modes apply for all GPT timers.TIMER_MODE:All five timers T2, T3, T4, T5 and T6 can be used in this mode.GATED_TIMER_MODE:All five timers T2, T3, T4, T5 and T6 can be used in this mode.COUNTER_MODE (timer concatenation):Only the timers T2, T4 and T5 can be used in this mode when thetransition comes from the corresponding OTL of the core timer. Thismode is used for the concatenation of the timers.RELOAD_MODE:Timers T2 and T4 can be used for this mode only when the transitioncomes from the corresponding OTL of the core timer. Timer T6 couldbe reloaded with the value of CAPREL when the sfrbit T6SR is set.• • • • • • • •
Sim−6Execution Environment4.2 SCENARIO SCRIPTING USING CXLBefore reading this section it is recommended to read Appendix B,<strong>CrossView</strong> Extension Language (CXL).With the <strong>CrossView</strong> eXtension Language (CXL) you can set up scripts forsimulation scenarios. These scenarios are usually a sequence of eventssupplied to the peripherals. In <strong>CrossView</strong> <strong>Pro</strong> you can achieve this byusing probe points to run scripts at defined intervals.Cycle <strong>Pro</strong>be PointWhen a CXL script must perform some action after every number ofcycles, you will need to set a cycle probe point with the execution of aCXL script assigned. You can do this as follows in <strong>CrossView</strong> <strong>Pro</strong>:1. From the Breakpoints menu, select Breakpoints...The Breakpoints dialog appears.2. Click the Add > button and select Cycle Breakpoint...The Add Cycle Breakpoint dialog appears.3. Click the Advanced >> button.4. Now fill in the following fields:SIMULATORCycle countName<strong>Pro</strong>be pointCommandsThe number of cycles between hitting thebreakpoint and thus between the execution ofthe script.Just a fancy name for your breakpoint, so thatyou can easily recognize it in the list if morebreakpoints are listed.Enable this check box. This makes thatexecution continues after the breakpoint is hitand the Commands are executed.Supply the cxl command to execute thescript. For example:cxl "myscript.cxl"If you supply a relative path, it will be relativeto the location of the absolute file (.abs) ofyour program.
SimulatorSim−75. Click OK.6. Click OK.It is also possible to set the breakpoint via the command window:break CYCLES no−of−cycles, name=fancy−name, probe_point=true,commands=cxl "script−name"The no−of−cycles is the number representing the number of cyclesbetween each probe point hit. The fancy−name is the name you want togive to the probe point to recognize it easily in the breakpoint list or to beused with other commands. The script−name is the filename of the CXLscript.CyclesWhen writing a CXL script that is executed every number of cycles by acycle probe point, you have to keep in mind that the simulator is aninstruction set simulator. If an instruction takes more than one cycle, thesimulator will never break in the middle of the instruction, but completesthe whole instruction first. When the number of cycles of the cycle probepoint is elapsed in the middle of an instruction, the probe point is hit afterthe instruction is finished and this may be a number of cycles later. So, theCXL script invoked by the probe point is not always executed exactly afterthe number of cycles defined with the probe point.You have to keep this in mind when writing a CXL script that does thingsdepending on the cycle counter. For example, it triggers a port pin every1000 cycles and it triggers another port pin every 2000 cycles. You willhave to round the cycle counter in the CXL script to get this done. Thismeans that it is inevitable that there is an inaccuracy in the timing. Anexample of rounding the cycle counter:long ccnt;ccnt = floor( ( get( "$CCNT" ) / 20)) * 20;In this example the script is executed by a probe point every 20 cycles.To do something in the script every 1000 cycles, you can now for exampleuse:if( ccnt % 1000 == 0 ){// actions here}• • • • • • • •
Sim−8Execution EnvironmentThe number of cycles that you fill in with the probe point is depending onthe demand of your scenario. If you need a high frequency of events, alower cycle count may be required than with a low frequency of events.Keep in mind that with lower cycle counts the script is executed morefrequently, which makes the simulation slower.As an alternative to using cycle probe points, you could also useinstruction probe points. Or if you only need certain actions at definedpoints in your code you could use code probe points.CXL and Simulator InteractionUsually your CXL script will need some interaction with the CPU’sregisters, port pins or the application’s variables. CXL supports the built−infunctions get() and set() for this purpose. The <strong>C166</strong>/<strong>ST10</strong> simulatorsupports special registers that represent the processor’s port pins. See theperipheral description for the names of these special registers.Note that when supplying a register name to the get() and set()function, the name should be prefixed by a $ to tell <strong>CrossView</strong> <strong>Pro</strong> that aregister is requested.4.3 PERIPHERAL EXAMPLESThe <strong>C166</strong>/<strong>ST10</strong> product contains examples that use peripheral simulationand CXL scripting. These examples include:adcUses the A/D converter to read a sine wave produced on theA/D converter input by CXL.SIMULATORportpeccserialAn up and down counter on the parallel port, controlled byother port pins. CXL is used to put input on the port pins andto log the counter values on the port to a file.Serial port output using PEC transfers simulation, usingdebug instrument I/O to display the output in <strong>CrossView</strong> <strong>Pro</strong>You can use the examples as a starting point for writing your own CXLscript.
SimulatorSim−95 TARGET CONFIGURATION FILEThe target configuration files (sim*.cfg) describe the available simulatorconfigurations. A configuration file is a text file and can be edited with anytext editor. <strong>CrossView</strong> <strong>Pro</strong> searches for the target configuration file in thecurrent directory and in the etc directory.On startup <strong>CrossView</strong> <strong>Pro</strong> selects the configuration indicated with the−tcfg command line option or by the Target | Settings... dialog andreads the target configuration file in memory. This configuration can beselected using the filename or the full name (title field) of theconfiguration.Empty lines, lines consisting of only white space are allowed. Commentstarts at an exclamation−sign (’!’) and ends at the end of the line.An information line has the following synopsis:[! comment] field : field−valuefieldfield−valuecommentone of the keywords described belowthe value assigned to the fieldoptional commentThe known fields are:Fieldtitlecpu_typeDescriptionThe full name of the configuration. Thisname will be displayed in the Targetconfiguration field of the Target |Settings... dialog.The name of the target CPU. <strong>CrossView</strong><strong>Pro</strong> knows four types of CPUs, 167,167mac, ext2mac and ext22mac. ’167’represents the extended architecture, likethe C161, C163, C164, C165 and C167families. ’167mac’ represents the extendedarchitecture including the MACcoprocessor, like the <strong>ST10</strong>x262 and<strong>ST10</strong>x272 families. ’ext2mac’ representsthe second extended architectures like theXC16x and Super10. ’ext22mac’represents the enhanced Super10architectures.• • • • • • • •
Sim−10Execution EnvironmentFieldregister_filedebug_instrument_modulemap_irammap_sfrmap_rammap_rompsm_dll_nameDescriptionThe filename of the register file (*.def) tobe used for the CPU on the target. Whenthis field is omitted <strong>CrossView</strong> <strong>Pro</strong> uses thedefault reg.def as register file. Thisregister file contains debug information for<strong>CrossView</strong> <strong>Pro</strong> like which (E)SFR registersare present and at which location.The name of the Debug Instrument (usingGDI) used for debugging: ’disim166’ for theinstruction set simulator (ISS).The range where the simulator shouldsimulate internal RAM memory. Multipleranges can be separated by commas ’,’.The range where the simulator shouldsimulate the SFRs and/or ESFRs. Multipleranges can be separated by commas ’,’.The range where the simulator shouldsimulate external RAM memory. Multipleranges can be separated by commas ’,’.The range where the simulator shouldsimulate external ROM memory. Multipleranges can be separated by commas ’,’.The name of the pheripheral simulationmodule: ’psm166’.Table Sim−1: Configuration file fieldsNotes:SIMULATOR• Fields not required for the target can be omitted.• <strong>CrossView</strong> <strong>Pro</strong> searches for the *.cfg files in the current directory andin the etc directory.Example of a part of the sim167.cfg file.title: C167 / <strong>ST10</strong>x167 Simulatorregister_file: reg167.defdebug_instrument_module: disim166cpu_type: 167psm_dll_name: psm166
SimulatorSim−11With the example above, to select the SIM167 configuration the commandoption would be:−tcfg sim167.cfg6 RESTRICTIONS AND IMPLEMENTATION DETAILSFacilities for real−time kernel support are absent in the simulator versionsof <strong>CrossView</strong> <strong>Pro</strong>. As a consequence, the <strong>CrossView</strong> <strong>Pro</strong> commands bt,bti, btI, et and l t for kernel support, are not available. With the simulatorversions the >& command to record target communication and the ocommand for transparency mode are not available. Also, the simulatorversions of the debugger do not support command line function calling.Menu and dialog items related to the mentioned commands are disabled.The following CPU features are not supported in these versions of thesimulator:• Automatically clearing the upper byte when writing a byte to anSFR.• Odd byte access traps when accessing a data/instruction word.Other implementation details:• CMP writes unmodified first operand back to memory: executionwill break when a data write breakpoint is set on the effectiveaddress of the first operand.• The PWRDN and IDLE instructions stop the simulation.• execution state counting not implemented.• The TFR flags are implemented as follows:The CPU latches a ’0’ to ’1’ transition of a TFR flag in an internal flipflop. This flip flop is reset upon entering the trap handler. Thisimplies that setting a TFR flag by software has no effect when it hasalready been set, independent of the situation. Also, a pending trapcan never be canceled.• sequentially crossing the boundary between internal and externalmemory is allowed in the simulator, not in hardware.• explicit SP updates followed by RET, RETI, RETS, RETP or POPrequire a one instruction delay but not in the simulator.• • • • • • • •
Sim−12Execution Environment• When the DIVL or DIVLU instructions results in an overflow, thecontents of the MDL and MDH registers on the simulator are not thesame as on the C167 (hardware). As the results are unpredictable onthe overflow, the simulator fills the MDL and MDH registers withthe value 0xFFFF. The simulator calculates the division as a 32−bitsdivision. The MDL contains the truncated lower 16 bits of the resultof the division and the MDH contains the truncated lower 16 bits ofthe result of the modulo. The V−flag is set when the result is largerthan 16 bits. The N−flag is set then the highest bit of the MDL is set.• When a breakpoint is set in an ATOMIC or EXTEND sequence,<strong>CrossView</strong> <strong>Pro</strong> will set a breakpoint at the first instruction after thesequence. Within an ATOMIC or EXTEND sequence ’class A’hardware traps are not handled. Therefore, it is not possible to set abreakpoint within a sequence, because breakpoints are set by aTRAP #2 (NMI) instruction which is a ’class A’ hardware trap.SIMULATOR
ADDENDUMON−CHIP DEBUGSUPPORT
OCDS/JTAGOCDS−2Execution EnvironmentADDENDUM
On−chip Debug SupportOCDS−31 INTRODUCTIONThis addendum gives supporting information for use of <strong>CrossView</strong> <strong>Pro</strong>with the on−chip debug support (OCDS) of the Infineon Technologiesarchitectures. Part of the OCDS concept is the JTAG debug connection, anindustry standard serial connection with the MCU’s inner states. OCDSallows pervasive debugging control of the MCU.<strong>CrossView</strong> <strong>Pro</strong> can debug with OCDS via the parallel port (LPT) or via theDevice Access Server (DAS). The DAS architecture was designed byInfineon for multi−device multi−core systems with very demandingemulation requirements. The goal of the DAS architecture is to provideone single interface for all types of tools. <strong>CrossView</strong> <strong>Pro</strong> works with DASand a USB wiggler connected to the on−board OCDS connector.2 SUPPORTED HARDWARE<strong>CrossView</strong> <strong>Pro</strong> supports the following hardware:OCDS via the parallel port• EASY UTAH v1.1 evaluation board with C161U or C165UTAH• Phytec phyCore XC161CJ or XC167CIOCDS via the Device Access Server• Starterkit XC164CM Rev 20OCDS via the parallel port or via the Device Access Server• XC16Board Rev 200 with XC161CJ, XC164CS or XC167CI3 ADDITIONAL SYSTEM REQUIREMENTSThe following are the additional system requirements:OCDS via the parallel port• One unused parallel printer port on your PC (LPT1, LPT2, or LPT3)• Parallel printer cable (capable of high speed transfers)• OCDS supporting architecture• Infineon Technologies OCDS interface• • • • • • • •
OCDS−4Execution EnvironmentOCDS via the Device Access Server• OCDS supporting architecture• One unused USB port on your PC• Infineon Technologies USB wiggler• Infineon Technologies DAS interface4 INSTALLATION4.1 HARDWARE INSTALLATION OCDS VIA THEPARALLEL PORTIt is strongly recommended that both the PC and the target board bepowered off during the installation. It is also strongly recommended thatinstallation of the connection follows electrostatic conventions to preventdamage to the target CPU.1. Verify that JTAG support of the targeted OCDS interface is enabled. Forexample, in case of an EASY UTAH v1.1 board, check the presence of ajumper on JP7.2. Connect the selected parallel port to the Infineon Technologies OCDSinterface using a parallel printer cable.4.2 HARDWARE INSTALLATION OCDS VIA DAS1. Connect the USB wiggler to the Infineon Technologies OCDS interface.OCDS/JTAG2. When there is an on−board wiggler disable this and use the OCDSinterface connector.4.3 SOFTWARE INSTALLATIONThe required <strong>CrossView</strong> <strong>Pro</strong> and GDI (Generic Debug Instrument)software is automatically installed and configured when the product isinstalled.OCDS via the Device Access Server• Install the DAS package from the installation CD.
On−chip Debug SupportOCDS−54.4 CONFIGURING CROSSVIEW PROIn <strong>CrossView</strong> <strong>Pro</strong> choose one of the OCDS target configurations, reachablefrom EDE. From the <strong>Pro</strong>ject menu, select <strong>Pro</strong>ject Options... Expand the<strong>CrossView</strong> <strong>Pro</strong> entry and select Execution Environment. In theExecution Environment field select a target board with OCDS (forexample, Easy Utah 161U with OCDS via LPT).5 OCDS BREAKPOINTSThe usage of OCDS software breakpoints is limited to 64k breakpoints. Asoftware breakpoint is set by injecting DEBUG instructions into thememory, so software breakpoints are only possible within RAM memory.The OCDS has a limited number of hardware breakpoints:• 4 code breakpoints or data write breakpoints, of which you can useone for a code range breakpoint or a data range read or writebreakpoint.• or 1 data value write breakpointFor data breakpoints, <strong>CrossView</strong> <strong>Pro</strong> always uses hardware breakpoints.For the XC16x and XC22xx derivatives there is a CMCTR register with abit−field ’Injection Level’ that is influencing the OCDS breakpoints. Whenthe bit−field value of the ’Injection Level’ is lower than a specific interruptlevel, the interrupt could not be debugged. The default value for the’Injection Level’ bit−field contains the highest value, so all interrupts couldbe debugged by default.• • • • • • • •
OCDS−6Execution Environment6 THE TARGET CONFIGURATION FILEThe target configuration files (*.cfg) describe the available target boards.These files are text files and can be edited with any text editor.Empty lines, lines consisting of only white space are allowed. Commentstarts at an exclamation−sign (’!’) and ends at the end of the line.An information line has the following synopsis:[! comment] field: [subfield =] field−valuefieldsubfieldfield−valuecommentone of the keywords described belowthe usage of this part depends on the value of field, seebelowthe value assigned to the fieldoptional commentThe fields listed in the configuration file are:OCDS/JTAGFieldtitlecpu_typeDescriptionThe full name of the configuration. Thisname will be displayed in the Targetconfiguration field of the Target |Settings... dialog.The name of the CPU present on the targetboard. <strong>CrossView</strong> <strong>Pro</strong> knows four types ofCPUs, 167, 167MAC, EXT2MAC andEXT22MAC. ’167’ represents the extendedarchitecture, like the C161, C163, C164,C165 and C167 families. ’167MAC’represents the extended architectureincluding the MAC coprocessor, like the<strong>ST10</strong>x262 and <strong>ST10</strong>x272 families.’EXT2MAC’ represents the secondextended architectures like the XC16x andSuper10. ’EXT22MAC’ represents theenhanced Super10 architectures.
On−chip Debug SupportOCDS−7Fieldregister_filedebug_instrument_moduleRegisterFileinitResetDelayreserveDescriptionThe filename of the register file (*.def) tobe used for the CPU on the target. Whenthis field is omitted <strong>CrossView</strong> <strong>Pro</strong> uses thedefault reg.def as register file. Thisregister file contains debug information for<strong>CrossView</strong> <strong>Pro</strong> like which (e)sfr registersare present and at which location.The name of the Debug Instrument (usingGDI) used for debugging: ’diocds166’ fortarget boards that use the OCDS interfacevia the parallel port and ’gdi2das’ for targetboards that use the OCDS interface viaDAS.The filename of the register list file (*.dat)to be used for OCDS interface. Thisregister file contains register information forDebug Instrument like which (E)SFRregisters are present and at which location.This file must be used along with theregister_file entry which contains theregister information for <strong>CrossView</strong> <strong>Pro</strong>.Initialize the register specified in thesubfield with the value specified infield−value. The register name in subfieldmust be known by <strong>CrossView</strong> <strong>Pro</strong>, i.e.,must be specified in the register file. Youcan specify multiple registers by separatingthem with commas ’,’.A delay in miliseconds for <strong>CrossView</strong> <strong>Pro</strong>after a target reset. When you use OCDS,<strong>CrossView</strong> <strong>Pro</strong> resets the target. However,<strong>CrossView</strong> <strong>Pro</strong> cannot detect if the reset isreleased when a capacitor is used insidethe reset circuit on the board.The reserved memory ranges (from − to)for OCDS monitor resources. EDE usesthis field to generate RESERVE MEMORYlocator controls. You can specify multipleranges by separating them with commas’,’.• • • • • • • •
OCDS−8Execution EnvironmentFields specific for the JTAG/OCDS connection via the parallel port:OCDS/JTAGFieldmonitorJtagDriverPeripheralsStopCableChipResetClientValueDescriptionThe filename of the monitor program fortarget boards using a JTAG/OCDS debuginterface. When this field is omitted,<strong>CrossView</strong> <strong>Pro</strong> will issue an error. For theC165UTAH board this is the filem167ocds.sre.The filename of the JTAG API interface.This interface communicates with the<strong>CrossView</strong> <strong>Pro</strong> ’diocds166’ Debuginstrument (DI) on one side and the actualJTAG driver (installed as a service) on theother side. This driver actuallycommunicates with target board via theparallel port.When set to 1, peripherals will be stoppedwhen hitting a breakpoint. By default,peripherals will not be stopped upon abreakpoint. For the C161U/C165UTAH youshould also specify the suspendingperipherals within the clock controlregisters S0CLC, SSCCLC, GPTCLC,RTCCLC, EPECCLC, USBCLC, IOMCLC.For the XC16x you should specify thesuspending perihperals in the OPSENregister.JTAG cable number to the chip where theOCDS module is located. The value shouldalways be 0.By default the OCDS interface performs aChip Reset with the reset pin (RSTIN) ofthe chip. You can disable this by setting thevalue to zero.JTAG I/O mode OCDS module number.The value should always be 2.
On−chip Debug SupportOCDS−9Fields specific for OCDS via DAS:FieldDASserverAccessPortTerminateServerDescriptionThe name of the used DAS server, whichmust be run and/or installed on theconnected host.The connection to the device. For the USBserver USBx means access via x and theUSB of the device.When TerminateServer != 0, if a server isstarted by the debug instrument, thisserver is also terminated on exit.Table OCDS−1: Target configuration file fieldsNotes:• Fields not required for the target can be omitted.• <strong>CrossView</strong> <strong>Pro</strong> searches for the *.cfg files in the current directory andin the etc directory.To be able to debug the C161U or C165UTAH via JTAG, an OCDS monitormust be placed in RAM that is loaded after each download of yourprogram. The OCDS monitor uses only the DEBUG interrupt vector andthe reserved memory area 0200h−0250h.When debugging with OCDS via DAS, peripherals always will be stoppedupon a breakpoint.7 INFINEON BOARD OCDS INTERFACE CIRCUITWhen debugging with OCDS via the parallel port you can add theInfineon OCDS interface circuit to enable JTAG debugging with a customtarget board. This circuit in effect only serves to protect the microcontrollerfrom voltage peaks and operates as a voltage level shifter if necessary.Halting the target also implies that servicing interrupts is inhibited.• • • • • • • •
OCDS−10Execution Environment470LED0.0110k10k 10k 10k 10k 10k 10k 10k10k 10k82(Schottky)1325515110k0Vcc115a1b126a2b23 7a3b34 8a4 b4TMSTDORESET#TDI82821 23 45 67 8VCCGNDGND1a5b5 2TRST#829101a6b6 2TCLK821112GND14111015b7a726b8a83 7a9b94 8b10 a10BRK_IN#BRK_OUT#OCDS_E#828213 1415 16Wiremount SocketDB25-F0.01µGND02xSN74HC244NFigure OCDS−1: Infineon OCDS Interface Electric SchematicsOCDS/JTAGNumber of Partparts2 74HC24411 10k Ohm1 470 Ohm1 110 Ohm2 51 Ohm7 82 Ohm2 10 nF1 LED1 Schottky1 DB25 Female connectorTable OCDS−2: Parts list
On−chip Debug SupportOCDS−117.1 THE INFINEON JTAG CONNECTORSince there is no standard connector defined in the IEEE1149.1 JTAGstandard specification nor an established industry standard has emerged,Infineon has defined their own standard connector for debuggingpurposes.7.1.1 THE CONNECTOR LAYOUTMechanicalThe connector is a standard 2.54mm (0.1 inch) centers.TMSTDOCPU_CLOCKTDITRSTTCLKBrk_INTRAP1 23 45 67 89 1011 1213 1415 16VCCGNDGNDRESETBrk_OUTGNDOCDS_EKey (no Pin)Figure OCDS−2: Infineon JTAG Connector V1.2The connector layout is similar to the connector of the USB wiggler usedfor debugging with OCDS via DAS.Signal descriptionTable OCDS−3 contains the Infineon JTAG connector signals. The directionis specified as follows:O = output from the CPU processor board to the debuggerI= input to the CPU processor board from the debugger• • • • • • • •
OCDS−12Execution EnvironmentSignal Name Direction Pin Number CommentTDO O 3 IEEE 1149.1TDI I 7 IEEE 1149.1TMS I 1 IEEE 1149.1TCLK I 11 IEEE 1149.1TRST I 9 IEEE 1149.1Brk_IN I 13Brk_OUT O 10RESET I 8 Open collectorCPU_CLOCK O 5 OptionalTRAP O 15 TriCore onlyOCDS_E I 14 TriCore only. Must beheld down during resetGND − 4,6,12VCC O 2 I/O ring voltage of CPUKey I 16 Mechanical key, shouldbe driven to GND bythe debugger.Table OCDS−3: Signal names of the JTAG connectorVoltageAll signals have the voltage of the I/O ring. The current voltages are 5 Volt,3.3 Volt or 2 Volt VCC.OCDS/JTAGFrequenciesThe speed of the JTAG signals must not exceed 200% of the actual CPUclock speed.
On−chip Debug SupportOCDS−137.1.2 IMPLEMENTATION CONSIDERATIONSPull Up’s & Down’sThe following signals should be connected to pull−up’s or pull−down’srespectively on the CPU−board.Signals Pull−up Pull−downOCDS_E 10kTMS10kTDI10kTRST 10kRESET 10kBrk_IN 10kTCLK10kTable OCDS−4: Pull−up’s & Down’sClock PinThe clock is optional since not every CPU has a Clock−out pin available.Since the clock pin is very likely to act as a antenna, it should beconnected via any sort of Jumper.If not applied, the TCLK signal should be connected to GND to enablesensing of the clock signal’s presence.Mechanical Key Pin (no Pin)The key pin signal should be driven by the debugger side to GND.• • • • • • • •
OCDS/JTAGOCDS−14Execution Environment
INDEXINDEX
INDEXIndex−2IndexINDEX
IndexIndex−3Symbols. (period) operand, 3−18! command, 13−21? command, 5−15, 13−23& operator, 3−18@format code, 3−13−−ddeservername, A−28−−timeout, 9−10/ command, 5−15, 13−22/format code, 3−13^ command, 13−37< command, 13−24 command, 13−26>& command, 13−34># command, 13−30>@ command, 13−28>* command, 13−36>> command, 13−32_EXT, Mon−40AA command, 13−38a command, 13−39a166, 1−11absolute file, 15−3accelerator bar, 4−25accelerator button, 4−12, 4−25accessing code and data, 6−1AccessPort, 1−24, OCDS−9AddDDEMenuEntry, A−28adding files to a project, 1−41address bias, set, 13−153addressesin expressions, 3−18specifying format of, 6−17applicationdebugging, 1−30executing, 1−28application notesEVA165, Mon−55EVA167, Mon−55EVA167AA, Mon−55I+ME C167C, Mon−56PHYTEC KC−161, Mon−58PHYTEC KC−163, Mon−58PHYTEC KC−164, Mon−58PHYTEC KC−167, Mon−58PHYTEC MM−165, Mon−57PHYTEC MM−167CR, Mon−57PHYTEC MM−167CW, Mon−57RMB−165, Mon−56RMB−167, Mon−56RMB−167SR, Mon−56target board, Mon−52TQ−Components, Mon−58ar166, 1−11argument of a function, 3−9arraysdisplay address of, 6−6display character, 3−15, 6−6displaying two−dimensional, 6−17viewing contents of, 3−16, 6−16assembler, 1−11assembly windowhexadecimal display, 3−10intermixed assembly, 3−10pipeline, 3−10source merge limit, 3−11assertion mode, 7−28, 15−3assertions, 1−5, 7−28, 15−3activating, 7−28activating and suspending, 7−31assertion mode, 7−28debugging with, 7−33define or modify assertion, 13−39defining, 7−29deleting, 7−32editing, 7−31quit assertion mode, 13−189statistics, 7−35• • • • • • • •
Index−4IndexINDEXtoggle mode, 13−38AssertionsChanged, A−11autosrc, 6−19BB command, 13−41b command, 13−42b164nrb.sre, Mon−8b167.sre, Mon−7b167a.sre, Mon−8b167nrb.sre, Mon−7b167nrbe.sre, Mon−8b167snrb.sre, Mon−8background color, 2−5background mode, 11−23, 15−3assertions, 11−28leaving, 11−26local and global variables, 11−27manual refresh, 11−24refresh limitations, 11−27running a program, 11−25stack, 11−27starting, 11−25stopping a program, 11−26updating windows, 11−23waiting, 11−26batch mode, 9−10batch processing, 9−10bB command, 13−43bb command, 13−44bc command, 13−45bCYC command, 13−46bcyc command, 13−47bD command, 13−48bd command, 13−50bdis command, 13−52bena command, 13−53bext2.sre, Mon−7bext2f.sre, Mon−8bext2fi.sre, Mon−8bext2i.sre, Mon−8bext2nrb.sre, Mon−7bext2nrbe.sre, Mon−8bext2nrbi.sre, Mon−8bI command, 13−54bi command, 13−55bi_me167.sre, Mon−8bias, 15−4binary constants, 3−5binary notation, 3−4bINST command, 13−56binst command, 13−57bit, 6−9bitword, 6−15boot, 1−20, Mon−36boot program, Mon−16boot programs, Mon−7boot sequence, Mon−5bootstrap loader (BSL), Mon−55break command, 13−58breakpoint toggle, 4−24, 7−4breakpoints, 1−4, 7−1, 13−58, 15−4,Mon−15and diagnostic output, 7−27and multi−line statements, 7−5and multiple statements, 7−5and statistical information, 7−27attaching macros to, 7−21code, 7−3commands associated with, 7−19conditionals, 7−21count, 15−4count of, 7−3cycle count, 7−3, 13−46, 13−47data, 7−7data breakpoints over a range ofaddresses, 7−11delete, 13−88delete all, 13−87deleting, 7−16disable, 7−17, 13−52emulator mode, 7−6
IndexIndex−5enable, 7−17, 13−53for loops, 7−6function, permanent, 13−44instruction count, 7−3, 13−56, 13−57list, 13−41listing, 7−8low−level, 15−7name, 7−3names, 7−13patching code with, 7−25permanent, 7−4permanent low−level, 13−55task aware, 13−65permanent up−level, 13−70probe point, 1−5, 7−4quiet reporting of, 7−22reset count, 7−3, 7−14restrictions on OCDS, OCDS−5sequence, 7−15set at beginning of function, 13−43set count, 13−45setting, 1−28, 7−8from command window, 7−10from menu, 7−9from source window, 7−9from stack window, 7−10setting the count of, 7−14strings, 7−22system startup code, 7−7task awarecode, 13−63permanent low−level, 13−65temporary low−level, 13−64temporary, 7−4, 7−12temporary low−level, 13−54task aware, 13−64temporary up−level, 13−68time, 13−66, 13−67timer, 7−3up−level, 7−23while loops, 7−6BreakpointsChanged, A−11bslack, 1−20, Mon−36bt command, 13−63btI command, 13−64bti command, 13−65bTIM command, 13−66, 13−67bU command, 13−68bu command, 13−70bufa command, 13−72bufd command, 13−73bxc16x.sre, Mon−7bxc16xnrb.sre, Mon−7bxc16xnrbe.sre, Mon−8CC, character constants, 3−6C command, 5−12, 13−74C trace, 1−5, 13−82C++ compiler, 1−11c166, 1−11Cable, 1−23, OCDS−8cache, debugging with, 15−4CAN, Mon−43interface messages, Mon−45case sensitivity, 3−20, 13−190casting values, 3−16, 6−16CB command, 13−75cc166, 1−11cd command, 13−76ce command, 13−77character codes, 6−14character codes table, 3−6character constants, 3−6ChipReset, 1−23, OCDS−8clear command, 13−78ClientValue, 1−23, OCDS−8close a file I/O stream, 13−128CmdAnnotatedOutput, A−11cmdannotatedoutput, A−22cmdoutput, A−21code breakpointsSee also breakpoints• • • • • • • •
Index−6IndexINDEXset breakpoint, 13−42task aware, 13−63code coverage, 1−6color, windows, 2−5color offset, 11−17color settings, 2−5COM interfaces, A−5COM methodsExecute, A−6ExecuteNoWait, A−7Halt, A−7Init(), A−6COM object interface, A−3activating, A−5events, A−8examples, A−12methods, A−6using, A−3command history, displaying recentcommands, 9−19command language, 3−1command line, batch processing, 9−10command line options, 4−5Command Window, 4−22displaying data in, 6−10opening, 1−32CommandCanceledByUser, A−9CommandInterpreterBusy, A−8CommandInterpreterReady, A−9commandsmultiple, 3−17syntax, 4−3comments, 3−17communication setup, 1−24compare application, 1−27, 13−89compiler, 1−11C++, 1−11conditional command execution,13−127conditional keywords, 3−19configuration file, Mon−35, Sim−9,OCDS−6configure <strong>CrossView</strong> <strong>Pro</strong>, 1−24connection error, Mon−42constants, 3−4binary, 3−5character, 3−6character constants in C, 3−6floating point, 3−5hexadecimal, 3−4long integer, 3−5octal, 3−5strings, 3−6continue execution, 5−9control operations, 4−39control program, 1−11coverage, 1−6, 11−6, 15−5disable, 11−6, 13−76enable, 11−6, 13−77information, 13−79marker, 4−24, 7−4memory window, 4−29next covered block, 13−154next not covered block, 13−155previous covered block, 13−160previous not covered block, 13−165source window, 4−25covinfo command, 13−79cp166, 1−11cproinfo command, 13−80CPU, reserved variable, 3−10CPU selection, 4−7cpu selection, 13−98, 13−99cpu_type, 1−18, Mon−35, Sim−9,OCDS−6creating a makefile, 1−41<strong>CrossView</strong>and command line options, 4−5command files, 4−6command language, 3−1command line batch processing,9−10command reference, 13−1commands summary, 13−4, 13−16customizing, 4−18desktop, 4−12
IndexIndex−7executable name, Mon−3, Sim−3features of the executionenvironment, Sim−3invoking, 4−4restrictions of executionenvironment, Mon−4, Sim−11sound support, C−1special features, 11−1starting, 4−4state of, 13−126using, 4−1<strong>CrossView</strong> <strong>Pro</strong>before starting, 1−13debugger, 1−13debugging environment, 1−8documentation, 1−7exiting, 1−33features, 1−3how it works, 1−9invoking, 1−15output, 1−32source level debugging, 1−8target settings, 1−16using windows, 1−4windows, 1−4<strong>CrossView</strong> <strong>Pro</strong> workspace, 1−33ct command, 13−82ct i command, 13−83ct r command, 13−84cursor, 5−3cxl command, 13−85CXL script, 4−38execute, 13−85reset variables, 13−86supplied scripts, 11−13syntax, B−3CXL scripting, Sim−6CXL syntax, B−3array and string functions, B−11base types, B−6compound types, B−7constants and expressions, B−8file inclusion, B−9functions, B−9graph functions, B−13I/O functions, B−11mathematical functions, B−10miscellaneous functions, B−17operators, B−8pointers, B−7predefined functions, B−10variables, B−6cxl_reset command, 13−86cycle count, breakpoints, 7−3DD command, 13−87d command, 13−88d166, 1−11DAS, Device Access Server, OCDS−3DASserver, 1−24, OCDS−9datadisplaying, 6−1enumerated, 6−5list data monitors, 13−141data analysis, 11−11add update commands, 13−118bufa, 13−72bufd, 13−73clear sequence of update commands,13−119close window, 13−120create window, 13−117graph, 13−117graph debug, 13−121graph_add_update, 13−118graph_clear_updates, 13−119graph_close, 13−120graph_debug, 13−121graphm, 13−122graphmn, 13−123graphp, 13−124memget, 13−145• • • • • • • •
Index−8IndexINDEXposition window, 13−124rawmemget, 13−169supplied scripts, 11−13update, 13−186update window, 13−186Data Analysis Window, 4−37toolbar, 4−37data breakpointsset at an address, 13−50set over range of addresses, 13−48data coverage, 4−29data monitoring, 1−5, 15−5removing expressions, 6−13Data Window, 1−5, 4−30, 6−12toolbar, 4−32dcmp command, 13−89DDE command line options,−−ddeservername, A−28DDE commands, AddDDEMenuEntry,A−28DDE events, A−27DDE itemscmdannotatedoutput, A−22cmdoutput, A−21event, A−26exec, A−24execext, A−23halt, A−25Help, A−20result, A−27DDE server interface, A−20debug instrument, 13−15save/restore state, 13−91debug instrument I/O, 10−9debug_instrument_module, 1−18,Mon−36, Sim−10, OCDS−7debugger, starting, 1−40debuggingand optimized code, 3−7assembly language, 12−3code without symbols, 5−14environment, 1−8multiple programs, 12−3notes about, 12−1quitting, 1−33source−level, 1−8viewing source while, 1−28debugging an application, 1−30desktop, 4−12DestroyedAllSymbols, A−11development flow, 1−12Device Access Server, OCDS−3di_state command, 13−91diagnostic output, and breakpoints,7−27diagnostics, 15−5dialog boxes, 4−17DidAddSymbols, A−11DidDownloadImage, A−11DidLoadSymbols, A−10dis command, 13−92disassemble memory, 13−92disassembler, 1−11disassembly, 6−18window, 15−5display, customizing, 4−18display formats, set default, 13−103dmp166, 1−11dn command, 13−93documentation, 1−7dot operand, 6−12download a file, 13−93download image, 13−140downloading, files to the executionenvironment, 1−25dual vector table, Mon−11dump, 3−16, 6−16dump command, 13−94dump utility, 1−11Dy command, 13−87Ee command, 5−14, 13−96
IndexIndex−9EasyCODE, 4−9eC command, 13−98ec command, 13−99echo command, 13−100echo string to terminal, 13−20EDE, 1−35build an application, 1−39load files, 1−37open a project, 1−37select a toolchain, 1−36start a new project, 1−40starting, 1−35edit source, 4−26ei command, 13−101einit, 1−21, Mon−38embedded development environment.See EDEembedded system, 15−6emulator communication setup, 1−24emulator mode, 1−9environment variableLD_LIBRARY_PATH, 2−3UIDPATH, 2−3error messages, alphabetical listing of,14−1Esc key, 4−22et command, 13−102EVA, Mon−40EVA165, application notes, Mon−55EVA167, application notes, Mon−55EVA167AA, application notes, Mon−55evaluate expression, 13−17event, A−26events, A−8, A−27AssertionsChanged, A−11BreakpointsChanged, A−11CmdAnnotatedOutput, A−11CommandCanceledByUser, A−9CommandInterpreterBusy, A−8CommandInterpreterReady, A−9DestroyedAllSymbols, A−11DidAddSymbols, A−11DidDownloadImage, A−11DidLoadSymbols, A−10HaltButtonPressed, A−9MenuEntrySelected, A−11Quit, A−12Reset, A−10Reset<strong>Pro</strong>gram, A−10Running, A−9RunningInBackground, A−9SourceFileChanged, A−10Stopped, A−9ViewedLineNrChanged, A−10examplestarting EDE, 1−35using EDE, 1−35using the control program, 1−42using the makefile, 1−45exec, A−24execext, A−23executable, building for <strong>CrossView</strong>,1−35Execute, A−6ExecuteNoWait, A−7executing an application, 1−28execution control commands,summary of, 13−8execution environment, Mon−1, Sim−1,OCDS−1connecting to <strong>CrossView</strong>, 4−6downloading files to, 1−25execution position, 5−3changing the, 5−5definition of, 15−6sync with viewing position, 5−7exit, 4−20exponential notation, 3−5expression evaluator, 1−4expressions, 3−3C character codes, 3−6character constants, 3−6evaluating, 6−11evaluation precision, 3−4floating point constants, 3−5format of, 3−13• • • • • • • •
Index−10IndexINDEXmonitoring, 6−12removing monitored, 6−13show, 4−30special expressions, 3−18specifying variables in, 3−8strings, 3−6watch, 4−30extension language, B−3eye diagram, 11−19Ff command, 13−103fa command, 13−104far, 6−8, 6−15fc command, 13−105fd command, 13−106FFT power spectrum, 11−15combined with phase, 11−18multi, 11−15multi in lines, 11−16multi in lines and grid, 11−17FFT waterfall, 11−15file system simulation, 10−7, 15−6close a stream, 13−112libraries, 10−8redirect output to a file, 13−113redirection, 10−7, 13−111summary of commands, 13−14filenames, 2−3fl command, 13−107FLASH programming, 11−19add FLASH device, 13−104check FLASH device, 13−105delete FLASH device, 13−106disable protection, 13−109FLASH monitor workspace, 13−114get protection status, 13−108list FLASH devices, 13−107protect FLASH device, 13−110flash_base_address, 1−19, Mon−37flash_chip, 1−19, Mon−37flash_chips, 1−19, Mon−37flash_device_num, 1−19, Mon−37flash_direct_access, 1−19, Mon−37flash_monitor, 1−19, Mon−36flash_vendor, 1−19, Mon−37flash_width, 1−19, Mon−37flash_workspace, 1−19, Mon−37floating point constants, 3−5format codes, 3−14formats, for variables, 6−14formattera.out to IEEE−695, 1−13a.out to Intel Hex, 1−13a.out to Motorola S, 1−13formatting expressions, 3−13fp command, 13−108fpd command, 13−109fpe command, 13−110frame pointer, 3−10FSSredirection, 10−7summary of commands, 13−14FSS command, 13−111FSS_stdio_close, 13−112FSS_stdio_open, 13−113functions, 3−20listing all, 6−10listing local variables and parametersof, 6−23fw command, 13−114Gg command, 5−5, 13−115GDI, 1−8, 9−12, 9−13logging, 9−13, 9−15, 9−17getting started, 1−13gi command, 5−6, 13−116global variables, 3−8glossary, 15−1graph command, 13−117graph_add_update command, 13−118
IndexIndex−11graph_clear_updates command,13−119graph_close command, 13−120graph_debug command, 13−121graphm command, 13−122graphmn command, 13−123graphp command, 13−124GUI update suppress, 13−125gus command, 13−125HHalt, A−7halt, A−25halt execution, 5−9HaltButtonPressed, A−9Help, A−20helpon−line, 1−7, 4−40summary of help commands, 13−15hexadecimal disassembly, 3−10hexadecimal notation, 3−4history mechanism, 15−6huge, 6−8, 6−15II command, 13−126I+ME C167Capplication notes, Mon−56connecting to, Mon−56debug monitors, Mon−56I/O simulation, 1−5defined, 15−7disable streams, 10−7enable streams, 10−7file system simulation, 10−7redirecting streams, 10−6setting up streams, 10−4terminal windows, 4−35ieee166, 1−13if command, 13−127ihex166, 1−13ilvl, Mon−38image part, 15−7in−situ editing, 6−7, 6−29init, 1−21, 1−22, 1−23, Mon−37,OCDS−7Init(), A−6input/output simulation, 10−1defined, 15−7summary of commands, 13−13instruction count breakpoints, 7−3integers, 3−4binary, 3−5hexadecimal, 3−4integral promotion, 3−5long, 3−5negative, 3−4octal, 3−5integral promotion, 3−5intermixed source and disassembly,6−19interprocess communication, A−1, B−1interrupt key, 15−7ios_close command, 13−128ios_open command, 13−129ios_read command, 13−131ios_readf command, 13−132ios_rewind command, 13−133ios_wopen command, 13−134ios_write command, 13−135ios_writef command, 13−136JJTAG, OCDS−3JtagDriver, 1−22, OCDS−8jump to cursor, 5−5• • • • • • • •
Index−12IndexINDEXKkernel support, 1−7, 11−4keyboard mappings, 10−10keywords, conditional, 3−193−20KitCon, Mon−58LL command, 13−137l command, 13−138l166, 1−11label, in disassembly, 6−18language, 3−1LD_LIBRARY_PATH, 2−3librarian, 1−11line command, 13−19line numbers, 3−11linker, 1−11listing, 13−138load command, 13−140load symbol file, 13−140, 13−152local variables, 3−7and the stack, 3−7auto−watch, 4−32locator, 1−11logging, 9−12command window output, 13−32commands and screen output, 9−15debugger−emulator I/O, 13−34debugger−GDI accesses, 13−36example, 9−15resume, 9−15setting up, 9−13start, 9−13startup options, 9−18stop, 9−17summary of commands, 13−11suspend, 9−15long integer constants, 3−5MM command, 13−141m command, 13−142m164r.sre, Mon−9m166, 1−11m167cmcp.sre, Mon−9m167cr.sre, Mon−9m167crd.sre, Mon−9m167d.sre, Mon−11m167mcp.sre, Mon−9m167n.sre, Mon−9m167r.sre, Mon−9m167re.sre, Mon−9m167rvh.sre, Mon−9m167s.sre, Mon−13macro preprocessor, 1−11macros, 1−7, 8−1, 15−7calling other macros, 8−4define, 13−174defining, 8−3delete definition, 13−185deleting, 8−8echo command, 13−100expanding, 8−5listing, 8−5parameters of, 8−9reading from a file, 8−7redefining, 8−5, 8−10save, 13−173saving to a file, 8−6summary of commands, 13−12using the toolbox, 8−11main() function, 15−7make utility, 1−11makefileautomatic creation of, 1−41updating, 1−41makepy utility, A−15map_iram, 1−19, Sim−10map_ram, 1−19, Sim−10
IndexIndex−13map_rom, 1−20, Sim−10map_sfr, 1−19, Sim−10MAU (minimum addressable unit),15−7mcp command, 13−144memget command, 13−145memorycopy, 13−144disassembly, 13−92displaying, 6−15dump, 13−94fill, 13−148mapping, Sim−3search, 13−150single fill, 13−147memory access, tracing, 1−6memory configuration, Mon−19memory dump, 3−16, 6−16memory layout, Mon−19memory map, 4−6, 15−8memory map file, Sim−3memory model, Mon−18memory switch, Mon−13Memory Window, 4−28setup, 4−29toolbar, 4−29menu, 4−14local popup, 4−15menu bar, 4−12MenuEntrySelected, A−11messagesCAN interface, Mon−45connection process, Mon−47mext2b.sre, Mon−9mext2d.sre, Mon−11mext2fb.sre, Mon−9mext2ib.sre, Mon−10mext2n.sre, Mon−9mext2r.sre, Mon−9mext2re.sre, Mon−9mF command, 13−147mf command, 13−148minimum addressable unit, 15−8mk166, 1−11Monitorconfiguration parameters, Mon−18connecting target boardCAN, Mon−43RS−232, Mon−41I+ME C167C, Mon−56interface description, Mon−21rebuild, Mon−16resources used by, Mon−14startup configure at NMI, Mon−20troubleshooting, Mon−50monitor, 1−20, 1−22, Mon−36, OCDS−8monitor commandBAUD_ZL, Mon−33DEBUG, Mon−33EINIT, Mon−34FILLMEM, Mon−28GO, Mon−30ILVL, Mon−32MEMTOPC, Mon−24MONADR, Mon−32MOVMEM, Mon−28NULL, Mon−23PCTOMEM, Mon−24PEEK, Mon−25POKE, Mon−25REGLOAD, Mon−26REGSAVE, Mon−27SETIP, Mon−29SHOWSTAT, Mon−30SYNC, Mon−31VERSION, Mon−29monitor data, 13−141monitor programs, Mon−7monitors, 13−142more, 3−10ms command, 13−150multi FFT power spectrum, 11−15in lines, 11−16in lines and grid, 11−17mxc16xb.sre, Mon−10mxc16xd.sre, Mon−11• • • • • • • •
Index−14IndexINDEXmxc16xib.sre, Mon−10mxc16xn.sre, Mon−9mxc16xr.sre, Mon−9mxc16xre.sre, Mon−9NN command, 13−152n command, 13−153nC command, 13−154near, 6−8, 6−15near pointer, 6−9nU command, 13−155Oo command, 13−156OCDS, OCDS−1octal constants, 3−5octal notation, 3−4on−chip debug support, OCDS−1configuration, OCDS−5hardware, OCDS−4Infineon OCDS interface circuit,OCDS−9installationhardware, OCDS−4software, OCDS−4software, OCDS−4system requirements, OCDS−3open a file I/O stream, 13−129, 13−134operators, 3−17order of precedence, 3−17using addresses, 3−18opt command, 13−157optimization, and debugging, 3−7options, display or set, 13−157OSEK/ORTI, 11−4output paging mechanism, 3−10overview, 1−1PP command, 13−158p command, 13−159packet format, A−27patches, 15−8and breakpoints, 7−25pC command, 13−160pd command, 13−161pe command, 13−162performing timing analysis, 1−6peripheral simulation, Sim−4peripheral support, Sim−4PeripheralsStop, 1−22, OCDS−8PHYTEC KC−161, application notes,Mon−58PHYTEC KC−163, application notes,Mon−58PHYTEC KC−164, application notes,Mon−58PHYTEC KC−167, application notes,Mon−58PHYTEC MM−165, application notes,Mon−57PHYTEC MM−167CRapplication notes, Mon−57connecting to, Mon−57PHYTEC MM−167CWapplication notes, Mon−57connecting to, Mon−57pipeline, 3−10playback, 9−8calling other playback files, 9−9quitting, 9−10setting the type of, 9−9startup options, 9−18summary of commands, 13−11playback mode, 1−7continuous, 13−24single step, 13−25pointer, 3−16, 6−8, 6−15display character, 3−15, 6−6
IndexIndex−15precision, evaluating expresions, 3−4print source lines, 13−158, 13−159probe point, 1−5, 7−4, 15−8problemscommon, 1−34communicating with <strong>CrossView</strong>,4−11profiling, 1−6, 11−8, 15−9code range, 1−6, 11−10cumulative, 11−9cumulative information, 13−80disable, 11−10, 13−161enable, 11−10, 13−162function, 11−9functions, 1−6information, 13−163program builder, 1−11program counter, 3−10, 5−7, 13−74g command (change), 13−115gi command (change), 13−116inside function, 3−9program development, 1−11program executioncontrolling, 5−1notes about, 5−14program reset, 13−164proinfo command, 13−163project files, adding files, 1−41prst command, 13−164pseudo−assembly, 6−19psm_dll_name, 1−20, Sim−10pU command, 13−165QQ command, 13−166q command, 13−167quiet breakpoint recording, 13−166Quit, A−12quit debugger, 13−167RR command, 5−8, 13−168radm, 1−18RAM Debug Monitor, Mon−5booting, Mon−5command set, Mon−23configurations, Mon−5resources used by, Mon−14rawmemget command, 13−169read from an I/O stream, 13−131formatted, 13−132recordcommands only, 13−26<strong>CrossView</strong> <strong>Pro</strong> and emulatorcommands, 13−28emulator commands only, 13−30record and playback, 9−1definition of, 15−9record mode, 1−7recordingchecking status, 9−6close file for, 9−6entering comments, 9−4example, 9−7resume, 9−5start, 9−3startup options, 9−18stop, 9−6summary of commands, 13−11suspend, 9−5refresh windows, 13−184register file, 1−18, Mon−37, Sim−10,OCDS−7Register Window, 4−27, 6−27setup, 6−27register_file, 1−18, Mon−37, Sim−10,OCDS−7RegisterFile, 1−22, 1−23, OCDS−7registers, 3−11displaying the contents of, 6−10• • • • • • • •
Index−16IndexINDEXspecial variable, 3−10reserve, 1−21, 1−23, 1−24, Mon−38,OCDS−7Reset, A−10reset program, 5−8, 13−164reset target system, 13−168, 13−170reset_period, 1−21, Mon−38ResetDelay, 1−23, 1−24, OCDS−7Reset<strong>Pro</strong>gram, A−10resource file, 2−3result, A−27rewind an I/O stream, 13−133RMB−165, application notes, Mon−56RMB−167, application notes, Mon−56RMB−167SR, application notes,Mon−56ROM Debug Monitor, Mon−5configurations, Mon−5dual vector table, Mon−11memory switch, Mon−13resources used by, Mon−14RS−232, Mon−41rs232_bootstrap_hold_level, 1−21,Mon−38rs232_bootstrap_level, 1−21, Mon−38rs232_bootstrap_pin, 1−21, Mon−38rs232_reset_hold_level, 1−21, Mon−38rs232_reset_level, 1−21, Mon−38rs232_reset_pin, 1−21, Mon−38rst command, 13−170RTOS aware debugging, 11−4Running, A−9RunningInBackground, A−9SS command, 5−11, 13−171s command, 13−172save command, 13−173save on exit, 4−20scoping rules and variables, 3−9scroll bar, 4−12searchbackward for string, 13−23forward for string, 13−22summary of commands, 13−16searching, 5−145−16for a function, 5−14for a source line, 5−16for a string, 5−15serial channel, Mon−18serial ports, 4−6set command, 13−174sfr, 6−15sfrbit, 6−9, 6−15Si command, 5−12, 13−176si command, 5−12, 13−177signal analysis, 4−37sim167.cfg, Sim−10simulation, I/O, 1−5simulation scenarios, Sim−6simulator, Sim−1peripheral support, Sim−4timer support, Sim−5simulator configuration, selecting,Sim−9single stepping, 1−5, 5−95−10at machine level, 5−125−16defined, 15−10into, 5−10into function calls, 13−172into functions, 5−10machine level into functions, 13−177machine level over functions, 13−176over, 5−11over function calls, 13−171over functions, 5−11sizeof() function, 6−7skidding, 15−10sound support, C−1source directory, change, 13−187source level debugging, 1−8source line, jump to, 5−16
IndexIndex−17source merge limit, 3−11source positioning, 5−3Source Window, 4−24change execution position, 5−5change viewing position, 5−4controlling program execution,5−85−16edit source, 4−26searching in, 5−145−16single stepping, 5−9sync execution and viewing positions,5−7toolbar, 4−25source window, line numbers, 3−11SourceFileChanged, A−10special function register, 3−11special variables, 3−9, 15−10reserved, 15−9user−defined, 3−12srec166, 1−13st command, 13−178stack, 6−20local variables, 3−7organization of, 6−20system, Mon−14user, Mon−14stack pointer, 3−10stack trace, 13−179, 13−180Stack Window, 4−33, 6−21toolbar, 4−34start.asm, Mon−40startup options, 4−5definition, 15−10list of, 4−7static variables, 3−7status bar, 4−12stop target execution, 13−178Stopped, A−9storage classes, 3−7string command, 3−18strings, 3−6structuresassignment, 6−8viewing, 6−5style codes, 3−14symbol information, 15−11symbolic disassembly, 6−18symbols, in disassembly, 3−10synchronize execution and viewingpositions, 5−7, 13−137syscon, 1−21, Mon−37system stack, 6−21, Mon−14system startup code, 15−11TT command, 13−179t command, 13−180Tab key, 4−22target board, Mon−1, Mon−3application notes, Mon−52connectingCAN, Mon−43RS−232, Mon−41connection messages, Mon−47connection problems, Mon−49selecting, Mon−4, Mon−39target communication, 15−11target configuration file, 1−17, Mon−35,Sim−9, OCDS−6example, Mon−39target program counter, 13−75target settings, 1−16target state, 13−15target system, 1−8task selection, 13−102td command, 13−181te command, 13−182Terminal Window, 4−35keyboard mappings, 10−10setup, 4−36TerminateServer, 1−24, OCDS−9timer breakpoints, 7−3timer support, Sim−5• • • • • • • •
Index−18Indextitle, 1−18, Mon−35, Sim−9, OCDS−6toolbar, 4−12data analysis window, 4−37data window, 4−32memory window, 4−29source window, 4−25stack window, 4−34toolbox, 8−11TQ−Components, application notes,Mon−58traceC, 13−82disable, 13−181disassembled, 13−83enable, 13−182instruction level, 6−26raw, 6−26, 13−84source level, 6−25trace buffer, 15−11Trace Window, 4−34, 6−25instruction level, 13−83raw, 13−84source level, 13−82traceback mode, 1−5transparency mode, 1−9, 11−3, 13−156and <strong>CrossView</strong> startup, 4−6defined, 15−11entering, 11−3one−shot commands, 11−3startup options, 11−3trigraph sequence, 3−7troubleshooting, 1−34, 4−11, Mon−50use command, 13−187user defined functions, 1−7user stack, 6−21using EDE, 1−35Vvariables, 3−7and case sensitivity, 3−20and scoping rules, 3−9casting, 3−7changing, 6−7determining the size of, 6−7formats of, 6−14global, 6−10global variables, 3−8local, 15−7local variables, 3−7scope, 15−9special, 15−10special variables, Pages, 3−9specifying in expressions, 3−8static variables, 3−7user−defined special variables, 3−12ViewedLineNrChanged, A−10viewing position, 3−9, 5−3changing the, 5−45−7defined, 15−12establish, 13−96establish at address, 13−101sync with execution position, 5−7INDEXUu command, 13−183ubgw command, 13−184UIDPATH, 2−3unset command, 13−185update command, 13−186update windows, 13−183, 13−184updating makefile, 1−41Wwait for target completion, 13−188waiting, 11−26window updatereactivate, 13−125suppress, 13−125
IndexIndex−19windows, 4−21active, 4−16, 15−3automatic switching between sourceand assembly, 3−10closing, 4−16command window, 4−22customizing, 4−18data analysis window, 4−37data window, 4−30help window, 4−38memory window, 4−28opening, 4−15pop−up, 4−38register window, 4−27selecting, 4−16source positioning, 5−3source window, 4−24stack window, 4−33terminal windows, 4−35toolbox, 4−38trace window, 4−34workspace file (.cws), 1−33write to an I/O stream, 13−135formatted, 13−136wt command, 13−188Xx command, 13−189X Resources, 2−4X Widgets, <strong>CrossView</strong> Motif, 2−4X WindowsMotif environment, 2−3resources, 2−4x−t plotting, 11−14x−y plotting, 11−14xfw166, 1−13xvwedit, 4−26ZZ command, 13−190• • • • • • • •
INDEXIndex−20Index