STATISTICAL INFORMATIONCAMPERDOWN/LISMORE CAMPUSES 2005/06 2004/05 2003/04 2002/03 2001/02Accommodation - Registered Beds 67 67 67 67 67Inpatient Separations by Patient TypeEmergency 600 609 675 615 626Elective 1040 975 995 1164 1175Obstetrics 148 129 95 132 132Total Inpatient Separations 1,788 1,713 1,765 1,911 1,933Public Separations (Acute) 1,424 1,369 1,421 1,521 1,534Total WIES 1,182 1,196 1,214 1,376 1,487Average Inlier Equivalent DRG Weight 0.6684 0.6986 0.6888 0.7257 0.7703Acute Bed Days 6,198 5,260 5,500 6,308 6,753Aged Care Bed Days 12,859 12,668 12,650 12,889 12,918Total Bed Days (Acute plus Aged Care) 19,057 17,928 18,150 19,197 19,671% Occupancy on Available BedsAcute 76.71 70.97 70.67 79.34 85.84Aged Care 97.86 96.41 96.01 98.09 98.31Average Length <strong>of</strong> StayAcute 3.50 3.05 3.14 3.27 3.49Births 65 60 48 52 60Total Operations 516 492 566 649 640Day Case Surgery in Theatre (Incl above) 403 375 448 500 485Non Inpatient ServicesEmergency Department 2,897 2,819 2,824 2,647 2,759Outpatient Attendances 2,056 2,236 2,343 2,225 2,520District Nursing Visits 5,164 5,881 5,657 5,913 8,278Community <strong>Health</strong> - Contacts 3,043 2,231 3,176 3,147 2,763Community <strong>Health</strong> - Group Session Attendances 4,763 4,318 6,302Day Care Attendances 1,645 2,555 3,121 2,863 2,719Meals on Wheels Prepared 13,701 12,221 11,844 9,315 7,599Total Non Inpatient Activity 33,269 32,261 35,267 26,110 26,638MACARTHUR CAMPUS 2005/06 2004/05 2003/04 2002/03 2001/02District Nursing/personal care visits 2,368 2,346 3,228 2,054 1,784Community <strong>Health</strong> contacts 1,086 986 1,077 1,338 923Community <strong>Health</strong> groups 1,777 1,511 1,112 108 29Day Care session attendances 1,284 1,265 1,397 1,273 1,285HACC Groups 137 138 142 204 44Meals on Wheels Prepared 1,187 1,189 1,305 1,139 1,463Volunteer contacts 1,289 1,290 1,529 1,220 1,238PSYCHIATRIC SERVICES 2005/06 2004/05 2003/04 2002/03 2001/02StatisticsNumber <strong>of</strong> Inpatient Separations 431 469 488 469 420Bed Days 4,745 3,957 4,350 4,291 4,371Daily Average Inpatients Accommodated 11.65 10.84 11.89 11.76 11.97Percentage Occupancy (%) 77.68 72.27 79.24 78.37 79.84Average Inpatient Length <strong>of</strong> Stay (days) 9.87 8.44 8.92 9.15 10.41Number <strong>of</strong> Outpatient Contacts 89,428 95,523 94,656 96,767 84,226Number <strong>of</strong> Residential Bed Days 1,721 1,618 1,475 1,289 1,460Central Linen ServiceKilograms Produced 712,642 709,583 680,058 708,853 701,381Average cost per kilogram (cents) 179.59 175.29 165.93 160.84 156.23Accreditation Status Fully Accredited. Successful organisation-wide survey in May 200633
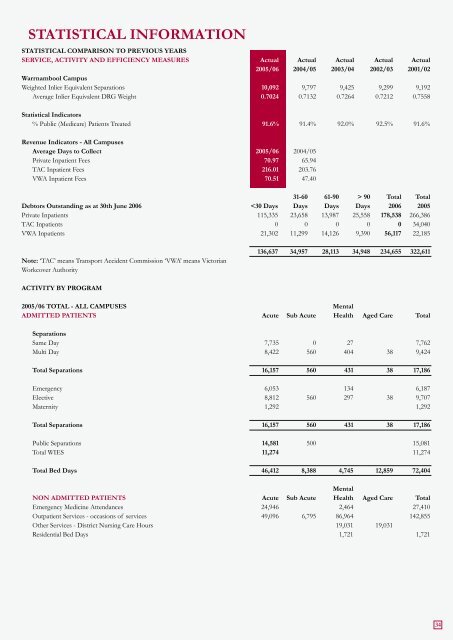
STATISTICAL INFORMATIONSTATISTICAL COMPARISON TO PREVIOUS YEARSSERVICE, ACTIVITY AND EFFICIENCY MEASURES Actual Actual Actual Actual Actual2005/06 2004/05 2003/04 2002/03 2001/02Warrnambool CampusWeighted Inlier Equivalent Separations 10,092 9,797 9,425 9,299 9,192Average Inlier Equivalent DRG Weight 0.7024 0.7132 0.7264 0.7212 0.7558Statistical Indicators% Public (Medicare) Patients Treated 91.6% 91.4% 92.0% 92.5% 91.6%Revenue Indicators - All CampusesAverage Days to Collect 2005/06 2004/05Private Inpatient Fees 70.97 65.94TAC Inpatient Fees 216.01 203.76VWA Inpatient Fees 70.51 47.4031-60 61-90 > 90 Total TotalDebtors Outstanding as at 30th June 2006