US 1 / MD 175 Improvement Study Phase I Final Report March 2010
US 1 / MD 175 Improvement Study Phase I Final Report March 2010
US 1 / MD 175 Improvement Study Phase I Final Report March 2010
- No tags were found...

Create successful ePaper yourself
Turn your PDF publications into a flip-book with our unique Google optimized e-Paper software.
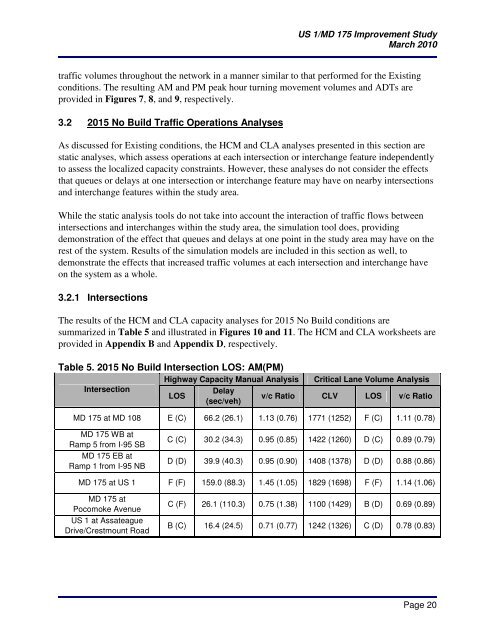
<strong>US</strong> 1/<strong>MD</strong> <strong>175</strong> <strong>Improvement</strong> <strong>Study</strong><strong>March</strong> <strong>2010</strong>traffic volumes throughout the network in a manner similar to that performed for the Existingconditions. The resulting AM and PM peak hour turning movement volumes and ADTs areprovided in Figures 7, 8, and 9, respectively.3.2 2015 No Build Traffic Operations AnalysesAs discussed for Existing conditions, the HCM and CLA analyses presented in this section arestatic analyses, which assess operations at each intersection or interchange feature independentlyto assess the localized capacity constraints. However, these analyses do not consider the effectsthat queues or delays at one intersection or interchange feature may have on nearby intersectionsand interchange features within the study area.While the static analysis tools do not take into account the interaction of traffic flows betweenintersections and interchanges within the study area, the simulation tool does, providingdemonstration of the effect that queues and delays at one point in the study area may have on therest of the system. Results of the simulation models are included in this section as well, todemonstrate the effects that increased traffic volumes at each intersection and interchange haveon the system as a whole.3.2.1 IntersectionsThe results of the HCM and CLA capacity analyses for 2015 No Build conditions aresummarized in Table 5 and illustrated in Figures 10 and 11. The HCM and CLA worksheets areprovided in Appendix B and Appendix D, respectively.Table 5. 2015 No Build Intersection LOS: AM(PM)IntersectionHighway Capacity Manual Analysis Critical Lane Volume AnalysisDelayLOSv/c Ratio CLV LOS v/c Ratio(sec/veh)<strong>MD</strong> <strong>175</strong> at <strong>MD</strong> 108 E (C) 66.2 (26.1) 1.13 (0.76) 1771 (1252) F (C) 1.11 (0.78)<strong>MD</strong> <strong>175</strong> WB atRamp 5 from I-95 SB<strong>MD</strong> <strong>175</strong> EB atRamp 1 from I-95 NBC (C) 30.2 (34.3) 0.95 (0.85) 1422 (1260) D (C) 0.89 (0.79)D (D) 39.9 (40.3) 0.95 (0.90) 1408 (1378) D (D) 0.88 (0.86)<strong>MD</strong> <strong>175</strong> at <strong>US</strong> 1 F (F) 159.0 (88.3) 1.45 (1.05) 1829 (1698) F (F) 1.14 (1.06)<strong>MD</strong> <strong>175</strong> atPocomoke Avenue<strong>US</strong> 1 at AssateagueDrive/Crestmount RoadC (F) 26.1 (110.3) 0.75 (1.38) 1100 (1429) B (D) 0.69 (0.89)B (C) 16.4 (24.5) 0.71 (0.77) 1242 (1326) C (D) 0.78 (0.83)Page 20