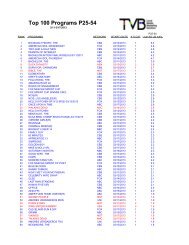
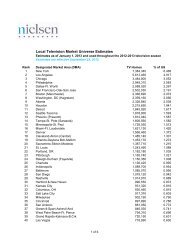
TV Basics Online - Television Bureau of Advertising
TV Basics Online - Television Bureau of Advertising
TV Basics Online - Television Bureau of Advertising

Create successful ePaper yourself
Turn your PDF publications into a flip-book with our unique Google optimized e-Paper software.
<strong>TV</strong> <strong>Basics</strong><br />
Total Local <strong>Online</strong> <strong>Advertising</strong><br />
Local online media sales accounted for 18% <strong>of</strong> all local advertising in<br />
2011, or $16.4 billion out <strong>of</strong> $91.2 billion. That made it the second-largest<br />
category behind newspapers. And it’s closing the gap fast.<br />
2005<br />
2006<br />
2007<br />
2008<br />
2009<br />
2010<br />
2011<br />
2012f<br />
2013f<br />
2014f<br />
2015f<br />
2016f<br />
Local <strong>Online</strong> Ad Revenue Trends<br />
Through 2016<br />
($ in millions)<br />
$4,200<br />
$5,500<br />
$8,200<br />
$12,900<br />
$13,400<br />
$13,600<br />
$16,400<br />
$19,900<br />
$22,700<br />
Source: © 2012, Borrell Associates, Inc. 2012-2016: forecast. All rights reserved.<br />
2011 Local <strong>Online</strong> Ad Revenues by Media Choice<br />
Broadcast <strong>TV</strong><br />
12.0%<br />
Directories<br />
12.6%<br />
Radio<br />
1.8%<br />
Magazines/Other<br />
Print<br />
1.7% Cable/Satellite<br />
1.0%<br />
Source: © 2012, Borrell Associates, Inc. All rights reserved.<br />
$24,800<br />
Newspapers<br />
24.7%<br />
$26,600<br />
$27,900<br />
Pure-Play Internet Sites<br />
46.2%<br />
(Defined as Google, Yahoo!, Monster, etc.)<br />
22<br />
Local Station Website Strength<br />
Local <strong>TV</strong> stations have been outpacing the overall growth in digital<br />
advertising. Estimates for last year’s revenue for local broadcasters<br />
were $1.97 billion, an increase <strong>of</strong> 41% over 2010. Forecasts for 2012<br />
are continued robust growth <strong>of</strong> 35%, to $2.7 billion.<br />
2005<br />
2006<br />
2007<br />
2008<br />
2009<br />
2010<br />
2011f<br />
2012f<br />
2013f<br />
2014f<br />
2015f<br />
$283<br />
$447<br />
$772<br />
$1,050<br />
$1,153<br />
Local Broadcast <strong>TV</strong><br />
Web Revenues<br />
($ in millions)<br />
$1,400<br />
$2,000<br />
$2,700<br />
$2,900<br />
Source: © 2012, Borrell Associates, Inc. 2012-2016: forecast. All rights reserved.<br />
$3,200<br />
$3,400<br />
2016f $3,800<br />
<strong>TV</strong> Stations Increasing Targeted<br />
<strong>Advertising</strong><br />
Stations remain dependent on display advertising, although their dependence<br />
on “static” banner ads declined from 60% <strong>of</strong> all online ad sales in 2010 to<br />
58% last year. Targeted banner sales increased 66% from 2010 levels for <strong>TV</strong><br />
stations. Streaming video advertising sold by stations also increased, up 31%<br />
from 2010 to $338 million (with newspapers at $328.2 million).<br />
Broadcast <strong>TV</strong> Stations <strong>Online</strong> Revenues<br />
($ in millions)<br />
Untargeted Banners $1,157.9<br />
Targeted Banners $228.8<br />
Paid Search $57.8<br />
E-mail $190.9<br />
Streaming Video $338.0<br />
Total $1,973.5<br />
Source: © 2012, Borrell Associates, Inc. All rights reserved.