2006 HCSDB Adult Sampling Report - Tricare
2006 HCSDB Adult Sampling Report - Tricare
2006 HCSDB Adult Sampling Report - Tricare
- No tags were found...

Create successful ePaper yourself
Turn your PDF publications into a flip-book with our unique Google optimized e-Paper software.
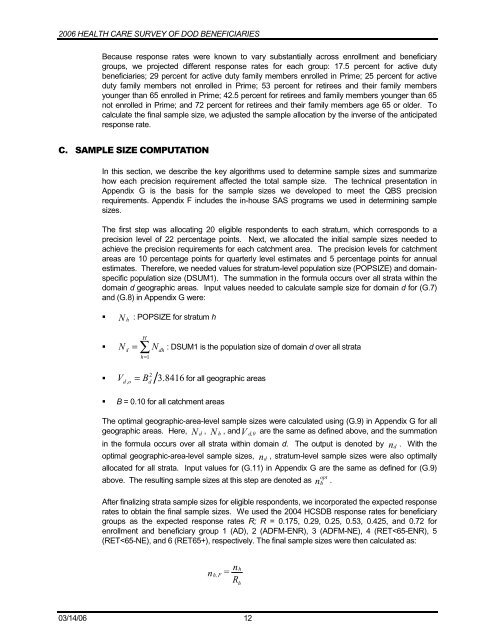
<strong>2006</strong> HEALTH CARE SURVEY OF DOD BENEFICIARIESBecause response rates were known to vary substantially across enrollment and beneficiarygroups, we projected different response rates for each group: 17.5 percent for active dutybeneficiaries; 29 percent for active duty family members enrolled in Prime; 25 percent for activeduty family members not enrolled in Prime; 53 percent for retirees and their family membersyounger than 65 enrolled in Prime; 42.5 percent for retirees and family members younger than 65not enrolled in Prime; and 72 percent for retirees and their family members age 65 or older. Tocalculate the final sample size, we adjusted the sample allocation by the inverse of the anticipatedresponse rate.& 6$03/(6,=(&20387$7,21In this section, we describe the key algorithms used to determine sample sizes and summarizehow each precision requirement affected the total sample size. The technical presentation inAppendix G is the basis for the sample sizes we developed to meet the QBS precisionrequirements. Appendix F includes the in-house SAS programs we used in determining samplesizes.The first step was allocating 20 eligible respondents to each stratum, which corresponds to aprecision level of 22 percentage points. Next, we allocated the initial sample sizes needed toachieve the precision requirements for each catchment area. The precision levels for catchmentareas are 10 percentage points for quarterly level estimates and 5 percentage points for annualestimates. Therefore, we needed values for stratum-level population size (POPSIZE) and domainspecificpopulation size (DSUM1). The summation in the formula occurs over all strata within thedomain d geographic areas. Input values needed to calculate sample size for domain d for (G.7)and (G.8) in Appendix G were:ƒ N h : POPSIZE for stratum hƒNdH= ∑ Nh=1dh: DSUM1 is the population size of domain d over all strata2ƒ V = B 3. 8416 for all geographic areasd , o dƒ B = 0.10 for all catchment areasThe optimal geographic-area-level sample sizes were calculated using (G.9) in Appendix G for allgeographic areas. Here, N d , N h , andV d,0 are the same as defined above, and the summationin the formula occurs over all strata within domain d. The output is denoted by nd . With theoptimal geographic-area-level sample sizes, nd , stratum-level sample sizes were also optimallyallocated for all strata. Input values for (G.11) in Appendix G are the same as defined for (G.9)above. The resulting sample sizes at this step are denoted as n opth .After finalizing strata sample sizes for eligible respondents, we incorporated the expected responserates to obtain the final sample sizes. We used the 2004 <strong>HCSDB</strong> response rates for beneficiarygroups as the expected response rates R; R = 0.175, 0.29, 0.25, 0.53, 0.425, and 0.72 forenrollment and beneficiary group 1 (AD), 2 (ADFM-ENR), 3 (ADFM-NE), 4 (RET