2006 HCSDB Adult Sampling Report - Tricare
2006 HCSDB Adult Sampling Report - Tricare
2006 HCSDB Adult Sampling Report - Tricare
- No tags were found...

Create successful ePaper yourself
Turn your PDF publications into a flip-book with our unique Google optimized e-Paper software.
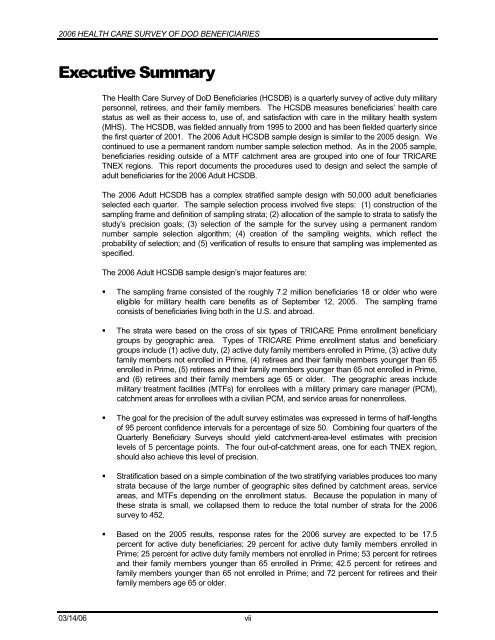
<strong>2006</strong> HEALTH CARE SURVEY OF DOD BENEFICIARIES([HFXWLYH6XPPDU\The Health Care Survey of DoD Beneficiaries (<strong>HCSDB</strong>) is a quarterly survey of active duty militarypersonnel, retirees, and their family members. The <strong>HCSDB</strong> measures beneficiaries’ health carestatus as well as their access to, use of, and satisfaction with care in the military health system(MHS). The <strong>HCSDB</strong>, was fielded annually from 1995 to 2000 and has been fielded quarterly sincethe first quarter of 2001. The <strong>2006</strong> <strong>Adult</strong> <strong>HCSDB</strong> sample design is similar to the 2005 design. Wecontinued to use a permanent random number sample selection method. As in the 2005 sample,beneficiaries residing outside of a MTF catchment area are grouped into one of four TRICARETNEX regions. This report documents the procedures used to design and select the sample ofadult beneficiaries for the <strong>2006</strong> <strong>Adult</strong> <strong>HCSDB</strong>.The <strong>2006</strong> <strong>Adult</strong> <strong>HCSDB</strong> has a complex stratified sample design with 50,000 adult beneficiariesselected each quarter. The sample selection process involved five steps: (1) construction of thesampling frame and definition of sampling strata; (2) allocation of the sample to strata to satisfy thestudy’s precision goals; (3) selection of the sample for the survey using a permanent randomnumber sample selection algorithm; (4) creation of the sampling weights, which reflect theprobability of selection; and (5) verification of results to ensure that sampling was implemented asspecified.The <strong>2006</strong> <strong>Adult</strong> <strong>HCSDB</strong> sample design’s major features are:ƒ The sampling frame consisted of the roughly 7.2 million beneficiaries 18 or older who wereeligible for military health care benefits as of September 12, 2005. The sampling frameconsists of beneficiaries living both in the U.S. and abroad.ƒ The strata were based on the cross of six types of TRICARE Prime enrollment beneficiarygroups by geographic area. Types of TRICARE Prime enrollment status and beneficiarygroups include (1) active duty, (2) active duty family members enrolled in Prime, (3) active dutyfamily members not enrolled in Prime, (4) retirees and their family members younger than 65enrolled in Prime, (5) retirees and their family members younger than 65 not enrolled in Prime,and (6) retirees and their family members age 65 or older. The geographic areas includemilitary treatment facilities (MTFs) for enrollees with a military primary care manager (PCM),catchment areas for enrollees with a civilian PCM, and service areas for nonenrollees.ƒ The goal for the precision of the adult survey estimates was expressed in terms of half-lengthsof 95 percent confidence intervals for a percentage of size 50. Combining four quarters of theQuarterly Beneficiary Surveys should yield catchment-area-level estimates with precisionlevels of 5 percentage points. The four out-of-catchment areas, one for each TNEX region,should also achieve this level of precision.ƒ Stratification based on a simple combination of the two stratifying variables produces too manystrata because of the large number of geographic sites defined by catchment areas, serviceareas, and MTFs depending on the enrollment status. Because the population in many ofthese strata is small, we collapsed them to reduce the total number of strata for the <strong>2006</strong>survey to 452.ƒ Based on the 2005 results, response rates for the <strong>2006</strong> survey are expected to be 17.5percent for active duty beneficiaries; 29 percent for active duty family members enrolled inPrime; 25 percent for active duty family members not enrolled in Prime; 53 percent for retireesand their family members younger than 65 enrolled in Prime; 42.5 percent for retirees andfamily members younger than 65 not enrolled in Prime; and 72 percent for retirees and theirfamily members age 65 or older.03/14/06 vii