Sprinkler Irrigation System Detailed Evaluation Center Pivot Lateral ...
Sprinkler Irrigation System Detailed Evaluation Center Pivot Lateral ...
Sprinkler Irrigation System Detailed Evaluation Center Pivot Lateral ...
- No tags were found...

Create successful ePaper yourself
Turn your PDF publications into a flip-book with our unique Google optimized e-Paper software.
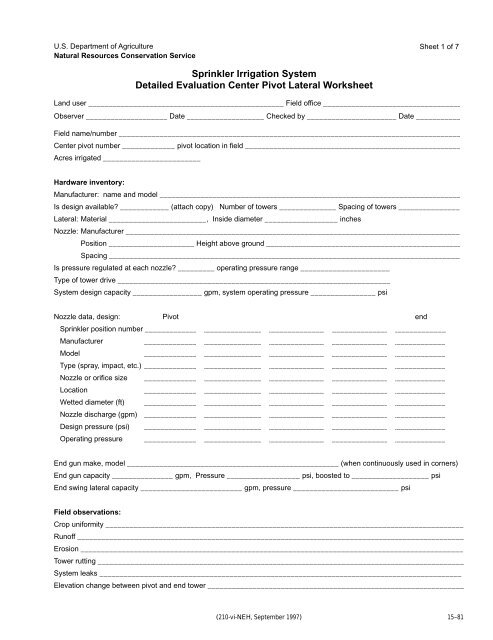
Chapter U.S. Department 15 of AgricultureResource Planning and <strong>Evaluation</strong>Natural Resources Conservation ServiceTools and WorksheetsPart 652<strong>Irrigation</strong> GuideSheet 1 of 7<strong>Sprinkler</strong> <strong>Irrigation</strong> <strong>System</strong><strong>Detailed</strong> <strong>Evaluation</strong> <strong>Center</strong> <strong>Pivot</strong> <strong>Lateral</strong> WorksheetLand user ________________________________________________ Field office __________________________________Observer ____________________ Date ___________________ Checked by ______________________ Date ___________Field name/number ____________________________________________________________________________________<strong>Center</strong> pivot number _____________ pivot location in field _____________________________________________________Acres irrigated ________________________Hardware inventory:Manufacturer: name and model __________________________________________________________________________Is design available? ____________ (attach copy) Number of towers ______________ Spacing of towers ________________<strong>Lateral</strong>: Material ________________________, Inside diameter __________________ inchesNozzle: Manufacturer ___________________________________________________________________________________Position _____________________ Height above ground ________________________________________________Spacing _______________________________________________________________________________________Is pressure regulated at each nozzle? _________ operating pressure range ______________________Type of tower drive ___________________________________________________________________<strong>System</strong> design capacity _________________ gpm, system operating pressure ________________ psiNozzle data, design: <strong>Pivot</strong> end<strong>Sprinkler</strong> position number __________________________________________________________________________Manufacturer__________________________________________________________________________Model__________________________________________________________________________Type (spray, impact, etc.) __________________________________________________________________________Nozzle or orifice size __________________________________________________________________________Location__________________________________________________________________________Wetted diameter (ft) __________________________________________________________________________Nozzle discharge (gpm) __________________________________________________________________________Design pressure (psi) __________________________________________________________________________Operating pressure __________________________________________________________________________End gun make, model ____________________________________________________ (when continuously used in corners)End gun capacity _______________ gpm, Pressure __________________ psi, boosted to ___________________ psiEnd swing lateral capacity _________________________ gpm, pressure __________________________ psiField observations:Crop uniformity ________________________________________________________________________________________Runoff _______________________________________________________________________________________________Erosion ______________________________________________________________________________________________Tower rutting __________________________________________________________________________________________<strong>System</strong> leaks _________________________________________________________________________________________Elevation change between pivot and end tower _______________________________________________________________(210-vi-NEH, September 1997)15–81
Chapter U.S. Department 15 of AgricultureResource Planning and <strong>Evaluation</strong>Natural Resources Conservation Service Tools and WorksheetsPart 652<strong>Irrigation</strong> GuideSheet 2 of 7<strong>Sprinkler</strong> <strong>Irrigation</strong> <strong>System</strong><strong>Detailed</strong> <strong>Evaluation</strong> <strong>Center</strong> <strong>Pivot</strong> <strong>Lateral</strong> WorksheetWind: Speed _________________ mph Direction (from) ________________________Line direction: From center to outer tower ______________________ moving _______________________Time of day ______________ , Humidity: ________ low ______ med _______ high, Air temp ________________Evaporation: start depth __________ inches, end depth ___________ inches, Evaporation ___________ inchesCrop _________________________, Root zone depth ________ foot, MAD 1/ ________ %, MAD ________ inchesSoil-water data (typical): (show location of sample site on soil map or sketch of field)Moisture determiniation method ______________________________________________________________Soil series name, surface texture _____________________________________________________________Depth Texture *AWC (in) 1/ *SWD (%) 1/ *SWD (in) 1/____________ ____________________ ______________ ____________ __________________________ ____________________ ______________ ____________ __________________________ ____________________ ______________ _____________ __________________________ ____________________ ______________ ____________ __________________________ ____________________ ______________ ____________ ______________Totals ____________________________Comments about soils:____________________________________________________________________________________________________________________________________________________________________________________________________________________________________________________________________________________________________________________________________Present irrigation practices:Typical system application:Crop Stage Hours per 2/ Speed Netof growth revolution setting applicationpercent(in)___________________________________________________________________________________________________________________________________________________________________________Hours operated per day ___________________ hoursApproximate number of pivot revolutions per season ___________________1/ MAD = Management allowed depletion, AWC = Available water capacity, SWD = Soil water deficit2/ To calculate the hours per revolution around the field, first calculate the average speed the end tower movesper cycle (start to start) = distance in feet divided by time in seconds.Then: hours per revolution = 2 (distance to end tower in feet) x π(end tower speed in ft/s) x 3,600 seconds per hour15–82 (210-vi-NEH, September 1997)
Chapter U.S. 15 Department of Agriculture Resource Planning and <strong>Evaluation</strong>Natural Resources Conservation Service Tools and WorksheetsPart 652<strong>Irrigation</strong> GuideSheet 3 of 7<strong>Sprinkler</strong> <strong>Irrigation</strong> <strong>System</strong><strong>Detailed</strong> <strong>Evaluation</strong> <strong>Center</strong> <strong>Pivot</strong> <strong>Lateral</strong> Worksheet<strong>System</strong> data:Distance from pivot point to : end tower ____________ ft, wetted edge ____________ ft* End tower speed: Distance between stakes ________________Time at first stake __________________, Time at second stake ____________________Time to travel between stakes __________________ min* This method is satisfactory for a continuous moving system, but need to allow for moving in start-stop cycles.Recommend using end tower move distance and from start to star. Typically, percent speed setting forend tower represents, 60% = 36 seconds of each minute, 72 seconds of each 2 minutes, etc.Measured system flow rate ______________ gpm, method ___________________Calculations: ________________________________________________________<strong>Evaluation</strong> computations:Circumference of end tower:(6.2832)Distance to end tower x 2π = ________________ x 6.2832 = _______________ ftEnd tower speed:Distance traveled (ft) x 60 = ______________ x 60 = _____________ ft/hrTime in minutesHours per revolution:Circumference at end tower (ft) = ___________________ = __________ hrEnd tower speed (ft/hr)Area irrigated:(3.1416)(Distance to wetted edge) 2 x π = ______________ x 3.1416 = _______________ ac43,560 square feet/acre43,560Gross application per irrigation:Hours per revolution x gpm = _________________ = ______________ in435 x acres irrigated 453 x acWeighted system average application:Sum of: catch x factors(Sum of: factors) x number of containers= _______________ = _________ cc (ml)(210-vi-NEH, September 1997)15–83
Chapter U.S. 15 Department of Agriculture Resource Planning and <strong>Evaluation</strong>Natural Resources Conservation Service Tools and WorksheetsPart 652 Sheet 4 of 7<strong>Irrigation</strong> Guide<strong>Sprinkler</strong> <strong>Irrigation</strong> <strong>System</strong><strong>Detailed</strong> <strong>Evaluation</strong> <strong>Center</strong> <strong>Pivot</strong> <strong>Lateral</strong> WorksheetConvert cc (ml) in measuring cylinder to inches depth in catch container:_____________ cc (ml) = 1 inch in catch containerAverage application = Average catch (cc) = _________________ = _____________ incc/inchWeighted low 1/4 average application:Sum of low 1/4 catch x factors = _____________ = ____________ cc (ml)(Sum of low 1/4 factors) x number of low 1/4 containersLow 1/4 average application = Average low 1/4 (cc) = _______________ = _________ incc/inchDistribution uniformity low 1/4 a (DU):DU = Weighted low 1/4 average applic. = _________________ = __________ %Weighted system average applicationApproximate Christiansen uniformity (CU):CU = 100 - [0.63 x (100 - DU)] = 100 - [0.63 x (100 - _____________)] = __________%Effective portion of water applied (R e ):R e = Weighted system average application (in) = _____________ = _____________Gross applicaiton (in)Application efficiency of low 1/4 (E q ):E q = DU x R e = ____________________________ = _____________ %(Use for medium to high value crops)Approximate application efficiency low 1/2 (E h ):E h = DU x R e = ____________________________ = _____________ %(Use for low value field and forage crops)15–84 (210-vi-NEH, September 1997)
Chapter U.S. Department 15 of AgricultureResource Planning and <strong>Evaluation</strong>Natural Resources Conservation ServiceTools and WorksheetsSheet 5 Part of 652 7<strong>Irrigation</strong> GuideApplication:<strong>Sprinkler</strong> <strong>Irrigation</strong> <strong>System</strong><strong>Detailed</strong> <strong>Evaluation</strong> <strong>Center</strong> <strong>Pivot</strong> <strong>Lateral</strong> WorksheetGross application x hours operated per day x (E q or E h )Hours per revolution x 100= ____________________________________________ = ________________ in/dayMaximum average application rate:Maximum catch inches x 60 = _____________ = __________ in/hrTime containers are uncovered in minutes<strong>Pivot</strong> revolutions required t replace typical annual moisture deficit:(Based on existing management procedures)Annual net irrig. requirement ______________ in, for _________________________ (crop)<strong>Pivot</strong> revolutions required:Annual net irrig. requirement x 100 = _______________________ = ______________(E q or E h ) x gross applic. per irrig.Potential water and cost savingsPresent management::Gross applied per year = gross applied per irrig x number of irrig= _____________________________ = _______________ in/yrPotential management:Potential application efficiency (E pq or E ph ) _____________ percent (fromirrigation guide, NEH Sec 15, Ch 11, or other source)Potential annual gross applied = Annual net irrig. requirement x 100Potential E pq or E ph= ______________________________ = _____________ inches(210-vi-NEH, September 1997)15–85
Chapter U.S. Department 15 of AgricultureResource Planning and <strong>Evaluation</strong>Natural Resources Conservation ServiceTools and WorksheetsPart 652 Sheet 6 of 7<strong>Irrigation</strong> GuideTotal annual water conserved:<strong>Sprinkler</strong> <strong>Irrigation</strong> <strong>System</strong><strong>Detailed</strong> <strong>Evaluation</strong> <strong>Center</strong> <strong>Pivot</strong> <strong>Lateral</strong> Worksheet= (Present gross applied - potential gross applied) x area irrig. (acre)12= ____________________________________ = ________________ acre feet12Cost savings:Pumping plant efficiency ____________ kind of fuel ___________________Cost per unit of fuel ______________ fuel cost per acre foot $ ________________Cost savings = fuel cost per acre foot x acre foot conserved per year= _____________________________ = $ ____________________Water purchase cost:= Cost per acre foot x acre feet saved per year = ______________________= $ ___________________Cost savings = pumping cost + water cost = _________________ = $ ________________Recommendations:_______________________________________________________________________________________________________________________________________________________________________________________________________________________________________________________________________________________________________________________________________________________________________________________________________________________________________________________________________________________________________________________________________________________________________________________________________________________________________________________________________________________________________________________________________________________________________________________________________________________________________________________________________________________________________________________________________________________________________________________________________________________________________________________________________________________________________________________________________________________________________________________________________________________________15–86 (210-vi-NEH, September 1997)
Chapter U.S. Department 15 of AgricultureNatural Resources Conservation ServiceContainer spacing _____________________ feetContainer Catch Catch (cc) CatchNo. Factor (cc) x Factor (in)12345678910111213141516171819202122232425262728293031323334353637383940414243444546471234567891011121314151617181920212223242526272829303132333435363738394041424344454647Resource Planning and <strong>Evaluation</strong>Tools and WorksheetsPart 652<strong>Irrigation</strong> Guide<strong>Sprinkler</strong> <strong>Irrigation</strong> <strong>System</strong><strong>Detailed</strong> <strong>Evaluation</strong> <strong>Center</strong> <strong>Pivot</strong> <strong>Lateral</strong> WorksheetContainer Catch Catch (cc) CatchNo. Factor (cc) x Factor (in)4849505152535455565748495051525354555657585960616263646566676869701234558596061626364656667686970Sum ________Low 1/4 summation:Sum ____________________________Max application rate data (5 minute catch)Sheet 7 of 7Max. rate = max. catch (in) x 60 = __________ inches/hour5 minutes(210-vi-NEH, September 1997)15–87