Transport Network Development - ericssonhistory.com
Transport Network Development - ericssonhistory.com
Transport Network Development - ericssonhistory.com
- No tags were found...

Create successful ePaper yourself
Turn your PDF publications into a flip-book with our unique Google optimized e-Paper software.
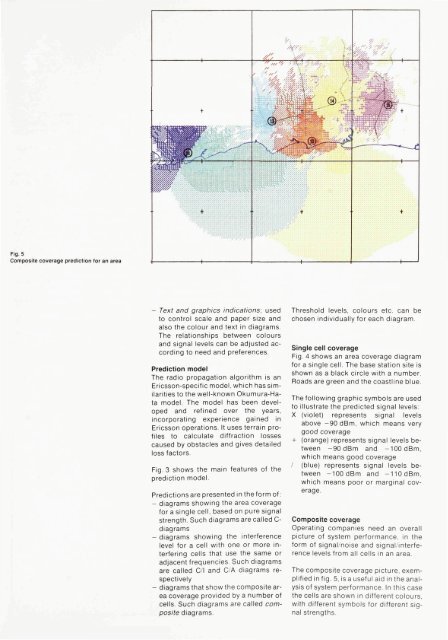
Fig. 5Composite coverage prediction for an area- Text and graphics indications; usedto control scale and paper size andalso the colour and text in diagrams.The relationships between coloursand signal levels can be adjusted accordingto need and preferences.Prediction modelThe radio propagation algorithm is anEricsson-specific model, which has similaritiesto the well-known Okumura-Hatamodel. The model has been developedand refined over the years,incorporating experience gained inEricsson operations. It uses terrain profilesto calculate diffraction lossescaused by obstacles and gives detailedloss factors.Fig. 3 shows the main features of theprediction model.Predictions are presented in the form of:- diagrams showing the area coveragefor a single cell, based on pure signalstrength. Such diagrams are called C-diagrams- diagrams showing the interferencelevel for a cell with one or more interferingcells that use the same oradjacent frequencies. Such diagramsare called C/l and C/A diagrams respectively- diagrams that show the <strong>com</strong>posite areacoverage provided by a number ofcells. Such diagrams are called <strong>com</strong>positediagrams.Threshold levels, colours etc. can bechosen individually for each diagram.Single cell coverageFig. 4 shows an area coverage diagramfor a single cell. The base station site isshown as a black circle with a number.Roads are green and the coastline blue.The following graphic symbols are usedto illustrate the predicted signal levels:X (violet) represents signal levelsabove -90 dBm, which means verygood coverage+ (orange) represents signal levels between-90 dBm and -100 dBm,which means good coverage/ (blue) represents signal levels between-100 dBm and -110 dBm,which means poor or marginal coverage.Composite coverageOperating <strong>com</strong>panies need an overallpicture of system performance, in theform of signal/noise and signal/interferencelevels from all cells in an area.The <strong>com</strong>posite coverage picture, exemplifiedin fig. 5, is a useful aid in the analysisof system performance. In this casethe cells are shown in different colours,with different symbols for different signalstrengths.