View the 2007 UHCC Youth Survey Analysis (pdf 515K)
View the 2007 UHCC Youth Survey Analysis (pdf 515K)
View the 2007 UHCC Youth Survey Analysis (pdf 515K)
- No tags were found...

Create successful ePaper yourself
Turn your PDF publications into a flip-book with our unique Google optimized e-Paper software.
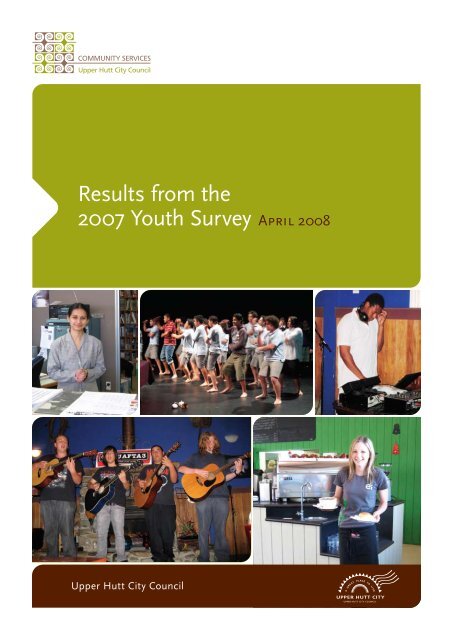
Results from <strong>the</strong><strong>2007</strong> <strong>Youth</strong> <strong>Survey</strong> April 2008Upper Hutt City Council
upper hutt city council | youth survey <strong>2007</strong>TABLE OF CONTENTS1 | EXECUTIVE SUMMARY 32 | ISSUES FOR YOUTH IN UPPER HUTT 63 | NEED FOR MAJOR IMPROVEMENTS 104 | PEER PRESSURE 125 | REAL LIFE SKILL OPPORTUNITIES 176 | PROMINENT HEALTH ISSUES 197 | WHERE TO GET HELP 228 | VIOLENCE 279 | NOTES TO THE ANALYSIS 3210 | <strong>2007</strong> SURVEY 36Appendix | 2006 Upper Hutt <strong>Youth</strong> <strong>Survey</strong> resultsNote: All sections contain analysis broken down into <strong>the</strong> followingsubgroups: results by gender, age, family situation, ethnicity, andoverall summary.1
upper hutt city council | youth survey <strong>2007</strong>1 | Executive Summary1.1 | Introduction and backgroundIn <strong>2007</strong> Upper Hutt City Council surveyed youth in <strong>the</strong> city. The results identifiedissues and concerns for youth in Upper Hutt. This follows on from a similar surveythat was conducted in 2006. This report contains <strong>the</strong> results and discussion of <strong>the</strong><strong>2007</strong> survey.1.2 | MethodologyA written questionnaire was distributed by hard copy to schools, youth hangouts, andcommunity spaces. It was also sent to local groups working with youth in Upper Huttand it was listed on <strong>the</strong> Upper Hutt City Council website. <strong>Youth</strong> who filled in a surveywent into a draw to win an I-Pod MP3 player. Collection boxes were located in <strong>the</strong>college offices and some surveys were also received by mail.The surveys were distributed in June/July <strong>2007</strong> and were collected in August <strong>2007</strong>.A total of 1342 survey responses were received. Most responses were from 13 to 17year olds. A copy of <strong>the</strong> survey is included in section 10 of this document.Age Number of respondents Percentage of respondents13 231 1714 340 2515 268 2016 242 1817 158 121.3 | Biggest issuesNearly one quarter of all respondents identified crime and illegal drug use as <strong>the</strong> twobiggest issues.Crime was more of an issue for males than females. Females were more concernedabout lack of things to do and legal drugs.Maori youth had higher levels of concern across a range of issues. Asian youth aremost concerned with crime and Pacific youth were concerned about legal drugs.The concern with lack of things to do increased with age.3
upper hutt city council | youth survey <strong>2007</strong>1.4 | Need for major improvements“…too many malls, notenough sports centres,too many pubs…nowhere to hang out”“Great place,sport available”“Skate park pools, bikes”<strong>Youth</strong> saw less need for places to hang out and leisure opportunities in <strong>2007</strong>,compared with 2006. More females, than males, wanted improvements in places tohang out.There were large differences in knowing where to go for help depending on <strong>the</strong> youth’sethnicity, with Asian youth <strong>the</strong> least knowledgeable.1.5 | Peer pressureBullying/teasing, appearance/clothing and skipping school were <strong>the</strong> top three mostcommon types of peer pressure.Males experienced more peer pressure than females, as did youth not living with <strong>the</strong>irparents.1.6 | Real life skill opportunitiesDriving and finding a job were <strong>the</strong> real life skills of most interest to youth, particularlythose aged 13 – 15 years. Starting <strong>the</strong>ir own business and learning about budgeting<strong>the</strong>ir own money were of more interest to 16 and 17 year olds.1.7 | Prominent health issuesAddiction to drugs and alcohol and mental health issues (depression, self harm andsuicide) were prominent health issues for <strong>the</strong> youth respondents, particularly olderyouth. <strong>Youth</strong> aged 14 years had higher levels of concern about suicide and pressure tobe thin.More females identified prominent health issues, particularly pressure to be thin anddepression.Males considered physical health to be more of an issue than females.1.8 | Where to get helpAwareness of where to get help for a number of health issues was much lower than<strong>the</strong> concern about <strong>the</strong>se issues.Females had a higher awareness than males about where to get help for every healthissue. Awareness of where to get help increased with age.Pacific youth had a higher awareness, and Asian youth had a lower awareness of whereto get help.4
upper hutt city council | youth survey <strong>2007</strong>1.9 | ViolenceNearly half <strong>the</strong> respondents had been involved in violent situation in <strong>the</strong> past, mostcommonly at school or in public.Males are more likely to experience violence. Maori are most likely to have been inviolent situations.“Too many [people]walking around streetslooking for fights.”Young people living in single parent families are more likely to experience violence athome.1.10 | Results by genderMales were more concerned about crime as an issue, and tended to experience morepeer pressure.Males were less aware of where to get help for health issues.Males are more likely to have been involved in a violent situation.1.11 | Results by family situationThose youth not living with a parent generally had more issues <strong>the</strong>y were concernedabout and experienced more peer pressure.1.12 | Results by ethnicityPacific youth have high awareness and Asian youth low awareness of where to get helpfor health issues.Maori were far more likely to have been involved in a violent situation than o<strong>the</strong>rethnicities.1.13 | SummaryMales, in general, have higher levels of concern around issues that have seriousconsequences (crime, illegal drugs) and experience more peer pressure. They are alsomore likely to experience violence. However <strong>the</strong>y are least likely to know where to ge<strong>the</strong>lp.Maori experience more violence than o<strong>the</strong>r groups, and have <strong>the</strong> highest levels ofconcern around issues of all <strong>the</strong> groups.Concern about mental health issues was higher among female respondents, and <strong>the</strong>ywere also more aware of where to get help.Young people not living with <strong>the</strong>ir parents appear to be most vulnerable: <strong>the</strong>y havehigher concern for issues, experience more peer pressure and are less likely to knowwhere to seek help.5
upper hutt city council | youth survey <strong>2007</strong>2 | Issues for <strong>Youth</strong> in Upper HuttRespondents were asked to rate <strong>the</strong> biggest issues for youthin Upper Hutt.2.1 | Overall resultsThe two most common concerns highlighted by nearly a quarter of respondents were:> Illegal drug use (23%)> Crime (23%).More than 10% of <strong>the</strong> respondents rated <strong>the</strong> following issues as <strong>the</strong>ir most important:> Bullying (15%)> Lack of things to do (13%)> Legal drug use (alcohol, party pills etc) (10%).Less than 10% of <strong>the</strong> respondents rated <strong>the</strong> following issues as <strong>the</strong>ir most importantissue:> Nowhere to hang out (8%)> Truancy (8%)> Graffiti (7%)> Transition from school into <strong>the</strong> workforce (5%)> Cyber/Text bullying (4%).Comparison with 2006 <strong>Survey</strong> 1Major changes in ranking from <strong>the</strong> 2006 <strong>Survey</strong> were:> Crime is more of an issue> Legal drugs are more of an issue> Graffiti is less of an issue.2.2 | Results by genderThe issue with <strong>the</strong> greatest gender difference was crime, with males seeing it is abigger issue.1 The results from <strong>the</strong> 2006 <strong>Youth</strong> <strong>Survey</strong> and <strong>the</strong> <strong>2007</strong> <strong>Youth</strong> <strong>Survey</strong> are not directly comparable. In 2006,respondents were asked to tick all <strong>the</strong> items that <strong>the</strong>y considered to be issues for youth in Upper Hutt. In<strong>2007</strong> respondents were asked to rank <strong>the</strong> issues facing youth from 1 to 10. Only <strong>the</strong> number one issueshave been analysed. The 2006 <strong>Survey</strong> is more likely to record a greater percentage of <strong>the</strong> respondentsindicating that an issue was important because multiple responses were permitted. Some comparison canbe made about <strong>the</strong> ranking of <strong>the</strong> issues from one survey to <strong>the</strong> next.6
upper hutt city council | youth survey <strong>2007</strong>Biggest Issues % of males % of females % pointdifferenceCrime 27 16 +11Lack of things to do 11 16 -5Legal drugs 9 13 -4O<strong>the</strong>r issues canvassed (bullying, cyber/text bullying, illegal drug use, truancy, graffiti,nowhere to hang out and transition form school into <strong>the</strong> workforce) did not show anysignificant gender differences.Biggest Issues – Gender3025Percent201510MaleFemale50Crime Lack of things to do Legal drugsIssues2.3 | Results by ageOf <strong>the</strong> two largest issues to youth – illegal drugs and crime – <strong>the</strong>re is not a greatvariation across <strong>the</strong> age groups.Lack of things to do was more of an issue for older youth, with this issue steadilyrising from <strong>the</strong> youngest to oldest age group.“There is lots ofviolence and drugsand it’s stupid.”Lack of things to do13 year olds 8%17 year olds 18%2.4 | Results by family situation 2In general, those not living with <strong>the</strong>ir parents had more concerns about <strong>the</strong> issues,particularly when compared with two parent families.2 The respondents were categorised into <strong>the</strong> following groups: two-parent (living with Mum and Dad), singleparent (living with Mum or Dad), and not living with a parent.7
upper hutt city council | youth survey <strong>2007</strong>Biggest Issues Actual % pointdifference to2 parent familiesMore of an issue for youth not living with <strong>the</strong>ir parentsNowhere to hangout 13 +5Truancy 12 +5Transition from school into <strong>the</strong> workplace 9 +4More of an issue for youth in single parent familiesBullying 21 +8Lack of things to do 17 +5There was no general trend when comparing youth from single parent and two parentfamilies, with some issues being of more concern to those in two parent families andsome less.2.5 | Results by ethnicityThere were some interesting variations in <strong>the</strong> responses to <strong>the</strong> biggest issues, basedon <strong>the</strong> respondent’s ethnicity.Biggest Issues – Ethnicity35Percent30252015105MaoriAsianNZ EuropeanPacific Peoples0Crime Legal drugs Lack of things to do TruancyCrime had <strong>the</strong> biggest variation between Maori and NZ European.Crime as <strong>the</strong> biggest issueMaori 31%Asian 27%NZ European 22%Pacific Peoples 21%8
upper hutt city council | youth survey <strong>2007</strong>Concern about legal drugs was more of an issue for Pacific Peoples and Maori.Legal drugs as <strong>the</strong> biggest issuePacific Peoples 15%Maori 14%NZ European 9%Asian 5%Lack of things to do was more of a concern for Maori and NZ European than for Asianand Pacific Peoples.Lack of things to do as <strong>the</strong> biggest issueMaori 15%NZ European 14%Asian 7%Pacific Peoples 6%Truancy was more of an issue for NZ European and Maori.Truancy as <strong>the</strong> biggest issueNZ European 9%Maori 8%Pacific Peoples 3%Asian 2%Transition from school into <strong>the</strong> workforce was much more of an issue for Asian youthat 15%, compared with <strong>the</strong> average response of 5%.2.6 | SummaryCrime and illegal drug use were <strong>the</strong> two biggest issues, and of concern for nearly onequarter of respondents. Crime was more of an issue for males than females, whereasfemales were more concerned with lack of things to do and legal drugs.“Heaps of drugs,not safe.”Concern with lack of things to do increased with age.Those youth not living with a parent generally had more issues <strong>the</strong>y were concerned with.There were some interesting ethnic variations in <strong>the</strong> biggest issues:> Maori youth responded with high levels of concern for all four biggest issues> Asian youth were most concerned about crime> Pacific youth were more concerned about legal drugs than o<strong>the</strong>r ethnicities.9
upper hutt city council | youth survey <strong>2007</strong>3 | Need for Major ImprovementsThe survey asked youth what major improvements wereneeded in Upper Hutt.3.1 | Overall resultsRespondents were keen to see improvement in two areas (data from 2006 survey inbrackets):> Leisure opportunities 61%, 2006 69%)> Places to hang out (56%, 2006 64%).Most people knew where to go for help; this was <strong>the</strong> issue with least need forimprovement (25%, 2006 20%).3.2 | Results by genderMore females (63%, 2006 74%) wanted improvements in places to hang out, thanmales (53%, 2006 58%), but this had decreased since 2006.The need for improvement of leisure opportunities showed no gender difference.3.3 | Results by ageImproving leisure opportunities was more of a priority for <strong>the</strong> older respondents.Major improvements % Leisure % Nowhereopportunities to hang out13 year olds 56 5014 year olds 61 6115 year olds 64 5716 year olds 62 5417 year olds 61 60Improving places to hang out was less important in <strong>2007</strong>, than it had been 2006.Places to hangout2006 - 13 year olds 72%<strong>2007</strong> - 13 year olds 50%10
upper hutt city council | youth survey <strong>2007</strong>3.4 | Results by living situationThose not living with <strong>the</strong>ir parents, thought <strong>the</strong>re was less need for majorimprovements in places to hang out and leisure opportunities.3.5 | Results by ethnicityPerhaps young peopleliving with <strong>the</strong>ir parentsneed places to go awayfrom <strong>the</strong>ir parents.The need for major improvements regarding places to hang out and leisureopportunities did not show much variation for different ethnicities. However, when itcame to knowing where to go for help, some major variations were evident.Pacific youth had <strong>the</strong> highest awareness of where to go for help, and Asian youth <strong>the</strong>lowest awareness.Knowing where to go for helpPacific Peoples 42%Maori 34%NZ European 22%Asian 17%3.6 | Summary<strong>Youth</strong> saw less need for places to hang out and leisure opportunities in <strong>2007</strong>,compared with 2006.More females than males wanted improvements in places to hang out.There were large differences in knowing where to go for help depending on <strong>the</strong> youth’sethnicity, with Asian youth <strong>the</strong> least knowledgeable.“It is a hole. Half <strong>the</strong>shops are empty, wehave a ‘brand new’mall, which is terribleand poorly designed.We’ve got an army baseand prison, so we have tolive with <strong>the</strong> people whowork or are imprisoned<strong>the</strong>re.”11
upper hutt city council | youth survey <strong>2007</strong>4 | Peer PressureThe survey questioned youth about a number of differenttypes of peer pressure. Only those respondents who said <strong>the</strong>yexperienced one or more types of peer pressure were analysed.4.1 | Overall resultsRespondents had experienced a range of peer pressure. Nearly half of thoserespondents that had experienced some form of peer pressure, experience <strong>the</strong>following forms of peer pressure.Peer pressure – Most common areasBullying or teasing 49%Appearance/clothing 46%Skipping school 44%O<strong>the</strong>r levels of peer pressure experiencedDrugs/alcohol 39%Sex/relationships 30%School subjects/Job training choices 28%Committing a crime 21%Driving on a restricted licence 18%Cyber/txt bullying 16%Self harm 13%Joining a gang 12%4.2 | Results by genderMales tended to experience more peer pressure than females. This is particularlyaround <strong>the</strong> following forms of peer pressure.Largest gender difference % of males % of females % pointfor peer pressuredifferenceJoining gangs 17 5 +12Drugs/alcohol 44 33 +11Committing a crime 25 15 +1012
upper hutt city council | youth survey <strong>2007</strong>Peer Pressure353025Percent201510MaleFemale50Drugs/alcohol Committing a crime Joining gangsOf <strong>the</strong> top three areas of peer pressure experienced by respondents, <strong>the</strong> differencesbetween <strong>the</strong> genders were less marked for bullying and skipping school butsignificantly greater for girls experiencing pressure around appearance/clothing.Top three areas of % of males % of females % pointpeer pressuredifferenceBullying or teasing 52 47 +5Appearance/clothing 43 54 -11Skipping School 43 46 -34.3 | Results by ageYounger people had experienced more bullying or teasing (13 year olds 61%, 14 yearolds 55%), compared with older youth (16 year olds 39%, 17 year olds 36%).Peer pressure regarding appearance/clothing was lower for 13 and 17 year olds (41%)and higher for 14 – 16 year olds (between 46% and 50%).Peer pressure relating to skipping school increased as <strong>the</strong> respondents got older from35% for 13 year olds to 54% for 17 year olds.Peer Pressures – Age7060Percent5040302010013 14 15 16 17AgeBullying/teasingAppearance/clothingSkipping school13
upper hutt city council | youth survey <strong>2007</strong>4.4 | Results by family situationThose respondents not living with <strong>the</strong>ir parents indicated that <strong>the</strong>y had experiencedmore peer pressure than those living with ei<strong>the</strong>r a single parent or two parents overmost of <strong>the</strong> issues canvassed. However, <strong>the</strong>y experienced less bullying regarding <strong>the</strong>irappearance/clothing, than respondents from two parent families.Peer Pressure % not living % from 2 % pointwith parents parent families differenceJoining gangs 26 11 +15Sex/relationships 41 29 +12Cyber/text bullying 22 14 +8Driving on restricted licence 24 18 +6Skipping school 48 42 +6School subjects/ 35 29 +6job training choicesDrugs/alcohol 44 39 +5Self harm 18 13 +5Committing a crime 24 19 +5Appearance/clothing 39 47 -84.5 | Results by ethnicityThere were no clear trends with respondents’ experience of peer pressure whenanalysed by ethnicity. There were, however, some interesting variations amongst <strong>the</strong>different ethnic groups.Peer pressure to skip school was higher for Pacific and Maori respondents.Skipping schoolMaori 55%Pacific Peoples 53%NZ European 43%Asian 17%Peer pressure relating to sex and relationships was high for Maori, but low for Asians.Sex/relationshipsMaori 40%Average 30%Asian 14%14
upper hutt city council | youth survey <strong>2007</strong>Peer pressure to join gangs was higher than average for Pacific Peoples.Joining gangsPacific Peoples 27%Average 12%Maori experienced more peer pressure relating to self harm than o<strong>the</strong>r groups.Self harmMaori 18%Average 13%Pacific Peoples 9%Asians experienced more peer pressure about bullying than o<strong>the</strong>r ethnicities.BullyingAsian 55%Average 49%“Most of Upper Huttis a social and friendlycommunity [comparedwith] some o<strong>the</strong>rs but<strong>the</strong> gangs make peoplein Upper Hutt feelunsafe”“There’s so manyteenagers who think<strong>the</strong>y’re cool cos <strong>the</strong>y do‘bad’ things but… I don’twant to be associatedwith <strong>the</strong>m”Peer pressure relating to drugs/alcohol was high for Maori but low for Asians.Drugs/alcoholMaori 50%Average 39%Asian 28%Peer pressure regarding committing a crime varied amongst <strong>the</strong> different ethnicities.Committing a crimePacific Peoples 27%Maori 26%NZ European 21%Asian 14%Maori experienced more peer pressure relating to cyber/text bullying than o<strong>the</strong>rgroups.Cyber/Text BullyingMaori 23%Average 16%15
upper hutt city council | youth survey <strong>2007</strong>4.6 | SummaryThe peer pressure thatmales experience haspotential long-termnegative consequences,is illegal, or involvesantisocial behaviour.Bullying/teasing, appearance/clothing and skipping school were <strong>the</strong> top three mostcommon types of peer pressure. Males tended to experience more peer pressure thanfemales.Younger people (13 – 14 year olds) experienced more peer pressure regarding bullying.Peer pressure around appearance starts at 14 years and declines at 17 years.<strong>Youth</strong> were more likely to experience pressure to skip school as <strong>the</strong>y got older.<strong>Youth</strong> not living with <strong>the</strong>ir parents experienced more peer pressure.There were some interesting variations in <strong>the</strong> peer pressure experienced by differentethnicities.> Maori experienced greater peer pressure to skip school, around sex/relationships,self harm, drugs and alcohol, cyber/text bullying.> Pacific youth experienced peer pressure to skip school, commit a crime and joingangs.> Asian youth experienced more peer pressure about bullying.16
upper hutt city council | youth survey <strong>2007</strong>5 | Real Life Skill OpportunitiesRespondents were asked to choose two real life skills that<strong>the</strong>y would be interested in studying at school.5.1 | Overall resultsThe results fell into three bands.Top four real life skills people want to study at schoolDriving 47%Starting my own business 37%Finding a job 35%Budgeting my money 29%O<strong>the</strong>r real life skills people are interested in studyingSetting up my own flat 18%Living away from home 15%Banking/insurance 14%The life skill opportunity least interested in learning at schoolWhat’s in my community 4%5.2 | Results by genderThere were not large differences between males and females in <strong>the</strong> real life skills that<strong>the</strong>y would like to learn at school, with most gender difference listed below.Real Life Skill % of % of % pointmales females differenceStarting my own business 41 30 +11Setting up my own flat 14 22 -8Living away from home 13 19 -617
upper hutt city council | youth survey <strong>2007</strong>5.3 | Results by ageOf <strong>the</strong> real life skills, <strong>the</strong> following trends were evident:> Driving was of most interest to 13 and 14 year olds at 55%, and <strong>the</strong>n fell away to32% for 17 year olds.> Learning about finding a job was of most interest to 13 – 15 year olds at about 40%,and <strong>the</strong>n fell away to 31% for 16 year olds and 23% for 17 year olds.> Starting my own business was of most interest to 15 – 17 year olds at around 40%,compared to only 34% for 13 and 14 year olds.> Budgeting my money was of most interest to 16 – 17 year olds, with 35% expressingan interest in learning about this at school.> Learning about banking and insurance was of more interest to 17 year olds at 22%,compared with about 13% for 13 – 16 year olds.5.4 | Results by family situationThere were no significant differences in <strong>the</strong> life skills that respondents wanted to learnat school, based on <strong>the</strong>ir different family situations (single parent, two parent or notliving with a parent).5.5 | Results by ethnicityThere were no major differences between ethnicities in <strong>the</strong> life skills that <strong>the</strong>respondents were interested in learning. Some points of interest from <strong>the</strong> resultswere:Pacific Peoples andyouth experiencecomparatively highlevels of unemployment.Pacific youth were mostinterested in learningabout finding a job.> Maori respondents were more interested in learning about starting <strong>the</strong>ir ownbusiness, with 42% expressing an interest, compared with 35% for NZ Europeansand 37% for all <strong>the</strong> respondents.> Asians expressed more interest (54%) in learning to drive, compared to <strong>the</strong> overallresponse rate of 47%.> Pacific respondents expressed <strong>the</strong> least interest in learning to drive at 39%.> Pacific respondents wanted to learn <strong>the</strong> most (42%) about finding a job, comparedto <strong>the</strong> overall response rate of 35%. Asian respondents expressed <strong>the</strong> least interestlearning about finding a job at 27%.5.6 | SummaryDriving and finding a job were <strong>the</strong> real life skills of most interest to 13 – 15 year olds.Starting <strong>the</strong>ir own business and learning about budgeting <strong>the</strong>ir own money were ofmore interest 16 and 17 year olds.18
upper hutt city council | youth survey <strong>2007</strong>6 | Prominent Health IssuesThe respondents were asked what <strong>the</strong>y felt were <strong>the</strong> prominen<strong>the</strong>alth issues for youth. Multiple responses were acceptable.6.1 | Overall resultsThe most prominent health issues for youth in Upper Hutt are listed below.Health IssuesAddiction (drugs, alcohol, etc) 73%Depression 57%Self harm 51%“It’s full of youth thatare troubled, no one’sgetting helped but we area pretty close communityin o<strong>the</strong>r ways”Suicide 48%Pressure to be thin 43%Sexually transmitted diseases 39%Physical health 35%O<strong>the</strong>r mental health issues 21%Mental health issuesfeature strongly as issuesfor Upper Hutt youth6.2 | Result by genderGenerally, females considered that <strong>the</strong>re were more health issues than males, with <strong>the</strong>exception of physical health.Health issue % of females % of males % pointdifferencePressure to be thin 56 35 +21Depression 67 51 +16Self harm 56 48 +8Suicide 53 45 +8Physical health 29 40 -11The o<strong>the</strong>r health issues: addiction, sexually transmitted diseases, and o<strong>the</strong>r mentalhealth issues had differences of five percentage points or less.19
upper hutt city council | youth survey <strong>2007</strong>6.3 | Results by ageThe concern regarding some health issues varied with age.Concern regarding addiction was consistently high across <strong>the</strong> 14 – 17 age group.Addiction14 year olds 75%15 year olds 75%16 year olds 72%17 year olds 76%Concern about depression steadily increased with age.Depression“People here arenot happy”13 year olds 49%17 year olds 65%Concern about suicide was reasonably constant, with a slight peak at age 14 years.Suicide13 year olds 49%14 year olds areconcerned about suicideand pressure to be thin14 year olds 52%15 year olds 47%16 year olds 48%17 year olds 49%Pressure to be thin peaked at 49% for 14 year olds for <strong>the</strong> total group of respondents.However, when considering <strong>the</strong> female responses only, it peaked at age 17 years.Pressure to be thin for females13 year olds 56%14 year olds 59%15 year olds 55%16 year olds 57%17 year olds 61%For males pressure to be thin peaked for 14 year olds at 43%, and ranged between 30– 34% for <strong>the</strong> o<strong>the</strong>r age groups.Concern regarding self harm was variable, high for 14 and 16 year olds, but lower for13, 15 and 17 year olds.20
upper hutt city council | youth survey <strong>2007</strong>6.4 | Results by family situationThere were no significant differences in <strong>the</strong> concern about health issues betweenthose living in single parent and two parent families. However, those not living witha parent generally had lower concerns about <strong>the</strong> health issues canvassed. This wasmost notable with addiction.AddictionTwo parent families 75%Not living with a parent 61%O<strong>the</strong>r mental health issuesTwo parent families 21%Not living with a parent 25%Those youth not living with a parent generally had less concern about health issues, in<strong>the</strong> range of four to eight percentage points lower than those in two parent families.The exception was concerns about o<strong>the</strong>r mental health issues, which were higher(+4 percentage points).6.5 | Results by ethnicityThere were not significant differences between ethnicities regarding health issues.Points to note are:> Maori were more concerned about suicide (55%) compared with <strong>the</strong> group as awhole (48%).> Generally, Maori were more concerned about health issues than NZ Europeanrespondents, although <strong>the</strong> differences were generally small between zero and fivepercentage points.> NZ European respondents were more concerned about <strong>the</strong> pressure to be thin(45%) compared with Maori (40%).6.6 | SummaryAddiction to drugs and alcohol and mental health issues (depression, self harm andsuicide) were prominent health issues for <strong>the</strong> youth respondents. <strong>Youth</strong> aged 14 yearshad higher levels of concern about suicide and pressure to be thin.More females identified prominent health issues facing youth, particularly pressure tobe thin and depression.Males were more focused on physical health than females.21
upper hutt city council | youth survey <strong>2007</strong>7 | Where To Get HelpThe respondents were questioned about <strong>the</strong>ir awareness ofwhere <strong>the</strong>y could go to get help in Upper Hutt, for a range ofissues, which were largely <strong>the</strong> same as those in <strong>the</strong> previousProminent Health Issues section.7.1 | Overall resultsResults for <strong>the</strong> total group are:Where to get helpSexually transmitted diseases 43%Physical health 39%Addiction (drugs, alcohol, etc) 37%Depression 35%Self harm 27%Suicide 27%O<strong>the</strong>r mental health issues 26%Pressure to be thin 21%Transition services 20%Transition services have <strong>the</strong> lowest level of awareness, however only 5% of <strong>the</strong>respondents consider it <strong>the</strong>ir biggest issue.Concern and awareness of health issues“[Upper Hutt] is myhome and I have greatfriends to back me up.”“I have lived here allmy life and Upper Hutthas helped me whenI’ve needed.”Comparing <strong>the</strong> concern regarding prominent health issues and respondents’awareness about where to get help, <strong>the</strong> responses separated into two groups.> One group had a large gap (over 20 percentage points) between <strong>the</strong> concern aboutan issue and <strong>the</strong> awareness of where to get help.> The o<strong>the</strong>r group was where <strong>the</strong> awareness of where to get help was higher (aroundfive percentage points) than <strong>the</strong> concern regarding <strong>the</strong> health issue.The first group is recorded below.The gap between health issue % concern % awareness % pointand where to get helpdifferenceAddiction 73 37 -36Self harm 51 27 -24Pressure to be thin 43 20 -23Depression 57 35 -22Suicide 48 27 -2122
upper hutt city council | youth survey <strong>2007</strong>Young people’s awareness of where to get help was higher than <strong>the</strong>ir concern for <strong>the</strong>following:> O<strong>the</strong>r mental health issues> Physical health> Sexually transmitted diseases.7.2 | Result by genderFemales had a higher awareness than males about where to get help for every healthissue questioned, with female awareness being between five and 17 percentage pointshigher.Males had a higher concern than awareness about all health issues, except for o<strong>the</strong>rmental health issues.The gap between concern and awareness for males are shown below.Health issue % male % male % pointconcern awareness differenceAddiction 75 35 -40Self harm 48 24 -24Suicide 45 22 -23Depression 51 30 -21Pressure to be thin 35 18 -17Physical health 40 35 -5Sexually transmitted diseases 41 37 -4O<strong>the</strong>r health issues 22 23 +1While females have a higher awareness about where to get help for health issues,<strong>the</strong>re are still some large gaps between females’ concern and <strong>the</strong>ir awareness. Thosewith a gap are recorded below.Health issuedifference% female concern % female awareness % pointAddiction 71 40 -31Pressure to be thin 56 25 -31Self harm 56 31 -25Depression 67 44 -23Suicide 53 33 -2023
upper hutt city council | youth survey <strong>2007</strong>Young people knowwhere to go for help withSTDs, physical healthand o<strong>the</strong>r mentalhealth issuesAwareness by females of where to get help was higher than <strong>the</strong>ir concern for <strong>the</strong>following health issues:> Sexually transmitted diseases> Physical health> O<strong>the</strong>r mental health issues7.3 | Results by ageFor every health issue queried, <strong>the</strong> awareness of where to get help increased with age.Sexually transmitted diseases – where to get help13 year olds 22%14 year olds 36%15 year olds 50%16 year olds 55%17 year olds 57%The higher awareness for 17 year olds is driven by females, with 69% of 17 year oldfemales being aware of where to get help for sexually transmitted diseases, comparedwith 46% of 17 year old males.Addiction – where to get help13 year olds 29%17 year olds 41%Depression – where to get help13 year olds 29%17 year olds 44%7.4 | Results by family situationThere were no significant differences in <strong>the</strong> concern about health issues betweensingle parent and two parent families. However, those not living with a parent hadlower awareness of where to get help for every health issue canvassed. The gap rangedfrom two to eight percentage points.24
upper hutt city council | youth survey <strong>2007</strong>Know Where to Get Help – Living SituationPercent454035302520151050Addiction Depression Suicide Self harm O<strong>the</strong>rmental healthPhysical STDs Thin TransitionServicesSingle Parent Two parent No parent7.5 | Results by ethnicityThere were no major differences between NZ European and Maori in <strong>the</strong>ir awarenessof where to get help for <strong>the</strong> health issues queried. For some issues, NZ Europeanhad higher awareness and o<strong>the</strong>r issues Maori had higher awareness. The differencesranged from zero to six percentage points.The major differences in awareness occurred with <strong>the</strong> Pacific and Asian respondents.Know Where to Get Help – Ethnicity6050Percent403020100Addiction Depression Suicide Self harm O<strong>the</strong>rmental healthPhysical STDs Thin TransitionServicesAsian Average Pacific PeoplesPacific youth had a higher awareness than average of where to get help for almostevery health issue queried. The awareness ranged from zero to 13 percentage pointshigher.Asian respondents had a lower awareness than average for every health issuequestioned. The lower awareness ranged from eight to 19 percentage points lower.25
upper hutt city council | youth survey <strong>2007</strong>7.6 | SummaryAwareness of where to get help for a number of health issues was much lower than<strong>the</strong> concern about <strong>the</strong>se issues.Females had a higher awareness than males about where to get help for every healthissue.Awareness of where to get help increased with age.Pacific youth had a higher awareness and Asian youth a lower awareness about whereto get help than <strong>the</strong> average for <strong>the</strong> respondents.26
upper hutt city council | youth survey <strong>2007</strong>8 | Violence<strong>Youth</strong> were questioned as to whe<strong>the</strong>r <strong>the</strong>y had ever beeninvolved in a violent situation, and if so where that violenceoccurred. If respondents had not been in a violent situation,<strong>the</strong>y were asked if <strong>the</strong>y knew someone that had.8.1 | Overall resultsOverall, 43% of <strong>the</strong> respondents stated that <strong>the</strong>y had been involved in a violentsituation some time in <strong>the</strong> past. This violent situation occurred in <strong>the</strong> following places.Place where <strong>the</strong> violence occurredAt school 63%In public 48%At an event 29%At home 26%On public transportation (bus, train, etc) 17%O<strong>the</strong>r 11%The total of percentages adds to more than 100%, as some respondents indicatedmultiple places where violence had occurred.Of <strong>the</strong> remaining respondents (n=770) who indicated <strong>the</strong>y had not been involved ina violent situation, 76% stated that <strong>the</strong>y knew someone who had been involved in aviolent situation.8.2 | Result by genderThere was a strong gender bias of those involved in a violent situation. Males weremore likely to have been involved in a violent situation (50%) than females (31%). Ofthose respondents that had been involved in a violent situation, <strong>the</strong>re was a stronggender difference at school and at home.Involvement in a % male % female % pointViolent SituationdifferenceAt school 66 54 +12In public 49 45 +4The most common placefor violence is at schoolAt an event 29 28 +1At home 22 38 -16On public transport 16 17 -1O<strong>the</strong>r 10 13 -327
upper hutt city council | youth survey <strong>2007</strong>8.3 | Results by ageExperience of a past violent situation increased with age, as would be expected. Asyouth got older, <strong>the</strong>y would more likely have experienced a violent situation sometimein <strong>the</strong> past.Involvement in a violent situation – age13 year olds 32%14 year olds 41%15 year olds 45%16 year olds 46%17 year olds 50%Violent situations at school are highest for 15 year-old females and males.8.4 | Result by family situationThose living with a single parent were more likely to have experienced a violentsituation, than those not living with a parent and two parent families.Involvement in a violent situation – family situationSingle parent families 49%Not living with a parent 44%Two parent families 40%Experience of Violence – Family Living Situation60“[Upper Hutt] makesyou feel unsafe.”“I feel like I’m going toget beaten.”Percent5040302010Single parentTwo parentNo parent0Personal Experience28
upper hutt city council | youth survey <strong>2007</strong>The family situation had an impact on <strong>the</strong> amount of violence experience in differentlocations.<strong>Youth</strong> in single parent families were more likely to experience a violent situation athome than those living in two parent families.Violent situation – at homeSingle parent families 37%Not living with a parent 33%Two parent families 22%Young people in singleparent families aremore likely to experienceviolence at homeThose youth not living with a parent were more likely to have experienced a violentsituation in public than o<strong>the</strong>rs.Violent situation – in publicNot living with a parent 62%Single parent families 46%Two parent families 46%Family situation had little effect when <strong>the</strong> violent situation occurred at school.Violent situation – at schoolSingle parent families 64%Two parent families 63%Not living with a parent 62%Location of Violence706050Percent4030Single parentTwo parent2010No parent0At school In public At home At an event PublictransportLocation of violenceO<strong>the</strong>r29
upper hutt city council | youth survey <strong>2007</strong>The lower response from youth living in two parent families was reversed when askedif <strong>the</strong>y knew someone that had been involved in a violent situation (if <strong>the</strong>y did nothave personal experience of a violent situation). This probably reflects <strong>the</strong>ir lower levelof direct involvement in a violent situation.Knowledge of someone involved in a violent situationTwo parent families 79%Single parent families 76%Not living with a parent 58%8.5 | Result by ethnicityOf all <strong>the</strong> questions asked, this is <strong>the</strong> area that produced <strong>the</strong> largest differencesbetween ethnicities, especially between NZ European and Maori. Maori were far morelikely to have experienced a violent situation than o<strong>the</strong>r ethnic groups.Involvement in a violent situationMaori 63%Pacific Peoples 44%NZ European 41%Asian 34%Experience of Violence – Ethnicity706050AsianPercent4030MaoriNZ European2010Pacific Peoples0Personal Experience30
upper hutt city council | youth survey <strong>2007</strong>Interestingly, <strong>the</strong> place where most violence occurred was at school.Violent situation – at schoolAsian 79%Maori 75%Pacific Peoples 67%NZ European 58%Violence – Location by Ethnicity9080Percent706050403020100At school In public At an event At homeLocation of violencePublictransportO<strong>the</strong>rAsianMaoriPacific PeoplesNZ European8.6 | SummaryNearly half <strong>the</strong> respondent had been involved in violent situation in <strong>the</strong> past, with <strong>the</strong>most likely places for this to occur being at school or in public.There was a strong gender bias with males much more likely to have been involved ina violent situation.Maori were far more likely to have been involved in a violent situation than o<strong>the</strong>rethnicities.People living in single parent families are more likely to have experienced violence athome.31
upper hutt city council | youth survey <strong>2007</strong>9 | Notes to <strong>the</strong> <strong>Analysis</strong>9.1 | Profile of respondentsThe <strong>2007</strong> survey attracted a slightly older aged respondent compared with <strong>the</strong> 2006survey, with any increase in <strong>the</strong> number of respondents aged 16 and 17 years old.There was a lower response from those age 13 years.Those respondents aged 13 include students who are in <strong>the</strong>ir final year of intermediateor full primary schools and those that have started college.The analysis focused on those respondents aged 13, 14, 15, 16, and 17 years, <strong>the</strong>sebeing <strong>the</strong> largest age groups that responded to <strong>the</strong> survey.Number of respondents by age groupAge Number of Number of % of total % of totalrespondents respondents respondents respondents<strong>2007</strong> 2006 <strong>2007</strong> 200612 years & younger 27 37 2 313 years 231 322 17 2514 years 340 302 25 2315 years 268 273 20 2116 years 242 191 18 1517 years 158 129 12 1018 years & older 52 26 4 2No age recorded 24 9 2 1Total 1342 1289 100 100GenderThe <strong>2007</strong> survey asked for <strong>the</strong> respondent’s gender. There were many more responsesfrom males than females.The 2006 survey did not ask for <strong>the</strong> respondent’s gender. This was assessed from<strong>the</strong>ir name. Where it was not obvious from <strong>the</strong> name of <strong>the</strong> respondent, <strong>the</strong>y wereclassified as unknown.Gender Number of % of total % of totalrespondents respondents respondents<strong>2007</strong> 2006Male 804 60 41Female 521 39 45Unknown 17 1 13Total 1342 100 10032
upper hutt city council | youth survey <strong>2007</strong>In <strong>2007</strong>, <strong>the</strong>re were a large number of responses (411) from St Patrick’s Silverstream,which probably explains <strong>the</strong> higher number of male responses.Age and GenderAge of respondents by genderFemalesMalesAge Number of Total female Total female Number of Total male Total malerespondents respondents respondents respondents respondents respondents<strong>2007</strong> <strong>2007</strong> 2006 <strong>2007</strong> <strong>2007</strong> 200612 years 21 4% 2% 6 1% 3%& younger13 years 78 15% 27% 151 19% 23%14 years 128 25% 23% 210 26% 25%15 years 94 18% 20% 173 22% 22%16 years 98 19% 16% 144 18% 14%17 years 74 14% 11% 84 10% 10%18 years 24 5% 2% 27 3% 2%& olderNo age 4 1% 0% 9 1% 0%recordedTotal 521 100 100 804 100 100EthnicityThe <strong>2007</strong> survey asked for <strong>the</strong> respondent’s ethnicity. Respondents were categorisedby <strong>the</strong> first ethnicity stated. Ten percent of 137 respondents stated a second ethnicity,<strong>the</strong> highest group being NZ European.Ethnicity Number of % of totalrespondents respondents<strong>2007</strong>NZ European 906 67Maori 120 9Pacific 62 5O<strong>the</strong>r 42 3Asian 41 3Middle Eastern, Latin American, African 4Not stated 167 12Total 1342 10033
upper hutt city council | youth survey <strong>2007</strong>The following table shows respondents who stated <strong>the</strong>ir ethnicity. Those not stating anethnicity have been excluded from <strong>the</strong> analysis to allow a more direct comparison with<strong>the</strong> schools’ data, as described in <strong>the</strong> latest ERO reports completed in 2005.Ethnicity % of stated % of Ethnicity for % of Ethnicity forethnicity respondents UHC from respondents Heretaungarespondents from UH 2005 from from 2005<strong>2007</strong> College ERO report Heretaunga ERO report% College %NZ European 77 80 73 75 71Maori 10 9 16 11 22Pacific 5 4 3 3 4Asian 3 3 6 6 3O<strong>the</strong>r ethnic 4 4 2 5 0groupTotal 100 100 100 100 100Twelve percent of <strong>the</strong> total survey respondents did not stated <strong>the</strong>ir ethnicity, 13%of <strong>the</strong> Upper Hutt College respondents did not state <strong>the</strong>ir ethnicity and 8% of <strong>the</strong>Heretaunga College respondents did not state <strong>the</strong>ir ethnicity. The data indicatesthat <strong>the</strong>re were proportionally fewer Maori and Asian respondents from Upper HuttCollege and fewer Maori respondents from Heretaunga College.The 508 respondents from Upper Hutt College represented approximately 40% of<strong>the</strong> students at <strong>the</strong> College. The 259 respondents from Heretaunga College representapproximately 37% of <strong>the</strong> students at <strong>the</strong> College.Family SituationThe respondents were categorised in <strong>the</strong> following groups: two parent (living withmum and dad), single parent (living with Mum or Dad), and not living with a parent(not living with Mum or Dad). Of those respondents categorised as living with asingle parent, 65 (or 23%) stated that <strong>the</strong>y were also living with a step parent (57 witha stepdad, stepfa<strong>the</strong>r or Mum’s partner and 8 with a stepmum, stepmo<strong>the</strong>r or Dad’spartner).34
upper hutt city council | youth survey <strong>2007</strong>Family Situation Number of % of totalrespondents respondents<strong>2007</strong>Two parents 936 70Single parent 280 21> step dad (65)> step mum (8)Not living with a parent 126 9Total 1342 1009.2 | Comparison between 2006 and <strong>2007</strong> DataQuestion one asked respondents to rank <strong>the</strong> issues facing youth from 1 to 10 (1 being<strong>the</strong> highest and 10 being <strong>the</strong> lowest). Unfortunately all <strong>the</strong> respondents did not follow<strong>the</strong>se instructions, with some people listing multiple 1s (that is, highest issues), anda number missing out <strong>the</strong> middle rankings but completing <strong>the</strong>ir highest and lowestrankings. To cope with <strong>the</strong>se types of responses, <strong>the</strong> question has been analysed bycounting <strong>the</strong> number of 1s (that is, highest issues) that respondents have stated.The 2006 survey asked a similar question but asked respondents to tick all itemsthat <strong>the</strong>y considered to be issues for youth in Upper Hutt. This instruction gaverespondents more encouragement to tick multiple issues.In <strong>the</strong> 2006 survey, eight youth issues were listed, whereas in <strong>the</strong> <strong>2007</strong> survey 10issues were listed. This included all eight issues from <strong>the</strong> 2006 survey and twoadditional issues: bullying and cyber/text bullying.The results from <strong>the</strong> two surveys are <strong>the</strong>refore not directly compatible, as <strong>the</strong> 2006survey is more likely to record a greater percentage of <strong>the</strong> respondents indicatingthat a issue is important because multiple response were permitted. However, somecomparison can be made about <strong>the</strong> ranking of <strong>the</strong> issues from one survey to <strong>the</strong> next.35
upper hutt city council | youth survey <strong>2007</strong>10 | <strong>2007</strong> <strong>Survey</strong>36
upper hutt city council | youth survey <strong>2007</strong>37
Results from <strong>the</strong>2006 <strong>Youth</strong> <strong>Survey</strong> August 2006
www.uhcc.govt.nz