PDF 1.43 MB - Nepal SBI Bank Ltd.
PDF 1.43 MB - Nepal SBI Bank Ltd.
PDF 1.43 MB - Nepal SBI Bank Ltd.

You also want an ePaper? Increase the reach of your titles
YUMPU automatically turns print PDFs into web optimized ePapers that Google loves.
Over the last four years, we have grown larger and stronger - in terms of business, geography and resources.This was achieved by relying on the fundamentals. Our achievements were founded on basic bankingnorms - quality, consistency and transparency of capital base, sound liquidity, a robust risk managementframework coupled with the practice of good corporate governance and above all the tireless focus oncustomer satisfaction.Minimalism describes movements in various forms of art and design, where the work is stripped down to itsmost fundamental features. Focussing on the little things. The finest details. The bare essentials.Our approach. Our success. Our progress. We attribute to Minimalism.
Introduction<strong>Nepal</strong> <strong>SBI</strong> <strong>Bank</strong> was incorporated in <strong>Nepal</strong> on April 28, 1993,as a public limited company. It commenced operations on July7, 1993, and is principally engaged in the business of banking,as defined in the <strong>Bank</strong>s and Financial Institutions Act, 2006.The <strong>Bank</strong> is listed on <strong>Nepal</strong> Stock Exchange, Kathmandu.<strong>Nepal</strong> <strong>SBI</strong> <strong>Bank</strong> has since expanded into a network of 59banking and non-banking outlets including 50 full-fledgedcommercial banking branches, 6 extension counters and 3administrative offices. A network of 68 online ATMs coveringall major cities in <strong>Nepal</strong>, 24 hours Mobile <strong>Bank</strong>ing and Internet<strong>Bank</strong>ing services support the delivery for speedier customerservice. As on July 16, 2011, the <strong>Bank</strong> with a staff complementof 505 employees, had an equity of Rs. 2.1 billion andtotal assets of Rs. 46.1 billion, with more than 3,00,000banking customers.The <strong>Bank</strong> has been taking up diverse Community Service.Initiatives beyond the call of regular banking business, toestablish itself as a responsible corporate citizen of this greatnation. Its aim is to become “the banker to every <strong>Nepal</strong>i”Annual Report 2010-111
Our Aspiration“The <strong>Bank</strong>er to Every <strong>Nepal</strong>i”Our Commitment“First in Customer Satisfaction”2 Annual Report 2010-11
StrategicObjectivesThe key elements of our overall strategic goal are to build anopen and honest corporate culture and to engage activelyon mutual beneficial relationship with all our stakeholders tocreate value for them. We aim to achieve our strategic goal byachieving following six key objectives: providing suitable products and services Business Partners. benefit of the society at large.Annual Report 2010-113
Code of Ethics fairly and equitable without being unduly influenced by individual friendship and associationswith the customers. maintain confidentiality of customer information and transactions and even after vacating theoffice continue to maintain confidentiality or secrecy in regard to the copyright material orother correspondences, accounts and dealings of the <strong>Bank</strong> and its customers. However,providing any information relating to financial transactions to the third party as required by lawshall not be construed as breach of confidentiality. or indirectly in any activities which are against the interest of the <strong>Bank</strong> and not do anything, integrity of the staff. payment, promise to pay, or authorization to pay any money, gift, or anything valuable from or indirectly, to influence any business decision, any act or failure to act, any commission offraud, or opportunity for the commission of any fraud. interests on the matters relating to his services, exert or attempt to exert any political or otherundue influence upon any other employees. premises and use or allow unauthorized persons to use such asset without obtaining priorpermission from the authorized person of the bank.4 Annual Report 2010-11
Expression EconomizedAnnual Report 2010-115
Annual Report of <strong>Nepal</strong> <strong>SBI</strong> <strong>Bank</strong> <strong>Ltd</strong>. endedFY 2067-68(2010-11) with asubstantial growth in profit,encouraging improvement inefficiency and considerablestrengthening of its reach drivenby steady growth. All thesewere achieved in the context ofconsiderable challenges posedby the global and local bankingand economic scenario in anintensely competitivebanking environment.6 Annual Report 2010-11
The OperatingEnvironmentThe operating environment in <strong>Nepal</strong> has been challenging formany years and the present review year was no exception. Highinflation and low business confidence have made things difficult can largely be attributed to the mere 4.1 percent growth inAgricultural sector due to adverse weather conditions in thecountry. Industry and Manufacturing and Service sectors grewby only 1.4 and 3.6 percent respectively during the year, asagainst the growth of 3.9 percent and 6.3 percent respectivelyduring previous year.There have been some welcome developments too. The equivalent of 9.6 percent during the review period. Thanks tolowered increment of 5.4 percent in the prices of non-foodand services group. On the external front, owing to the increasein export and substantial decrease in import, the incrementrate of export overreached the import rate for the first timein the last decade. Consequently, the rate of Trade deficit hasdecreased significantly. However, in respect of country-wise past years. Foreign employment sector that was hit hard byglobal economic crisis showed signs of recovery as indicatedby increasing demand of <strong>Nepal</strong>i migrant workers in theinternational labor market and subsequent inflow of remittanceswhich grew by 9.4 percent during FY 2067-68 to reach to arecord level of Rs. 205 billion.The financial crisis that started in the Western economies afew years back is gradually engulfing the economies of bothdeveloped and developing countries, causing the global outputforecast to shrink. As part of global financial and economicsystem albeit less significantly, the <strong>Nepal</strong>ese economy couldfeel the impact of the global financial crisis through differentroutes like a slowing down in the rate of remittance growth,a recessionary tourism sector, decline in foreign aid, and ademand-deficient manufacturing sector. While a slowing ofthe first three components will affect poverty reduction anddevelopment initiatives, the decline in global demand for <strong>Nepal</strong>imanufacturedproducts will put direct downward pressure ongrowth rate. However, we can see some positive improvementsin the flow or remittances as well as amelioration of tourismsector during the later period of the review year.Annual Report 2010-117
The <strong>Bank</strong>ingIndustryThe banking industry continued to witness geographic and numeric expansion in terms of market. Branches of the commercial banks expanded to 1,111 at the end of review fiscal yearvis-à-vis 966 at the end of Ashadh 2067.The Regulators introduced stringent regulations relating to investment in real estate due to fearsof an asset bubble, but such regulations were relaxed a bit later on. 323.4 billion as on Ashadh 2068 compared to that of Rs. 376.8 billion on Ashadh 2067 dueto substantial decrease in NEPSE Index which was 362.2 points, its lower level in recent years.Liquidity continued to worry the industry especially during the first six months of the year whichresulted in higher short and medium term interest rates. Mobilizing deposits in a high inflationand tight liquidity environment has been a challenge. However, the later months of the fiscal yearshowed some signs of relief as the liquidity crunch softened and deposits began to flow into thebanking system.In 2067-68, the deposit of commercial banks increased by Rs. 57.3 billion as against 68.7billion during last financial year. Similarly, Loan and advances of commercial banks increased byRs. 56.9 billion as against Rs. 67.6 during the last financial year.The capital adequacy ratio of most of the banks exceeded both local and international regulatoryrequirements. The industry also witnessed significant progress in product innovation andservice delivery. performance indicators.8 Annual Report 2010-11
Other Factors ImpactingBusiness of <strong>Bank</strong> case of commercial banks in the Monetary Policy of 2010- in government securities, cash in vault of FIs, Cash ReserveRequirement and excess liquidity over CRR to be counted inSLR. Though this provision helps ensure solvency of the banksin general and strengthens liquidity position in particular, it impels thus restricts the expansion of credit. go for amalgamation. The Central <strong>Bank</strong>, through the mergerguidelines, has offered regulatory relaxations to prepare aground for mergers among BFIs. The central bank has relaxedprovisions on branch expansion, single obligor limit, deprivedsector lending, and expansion of operational area, upgradation,and capital adequacy ratio for a certain period, for BFIs goingfor merger.Annual Report 2010-119
Measuring Our Success improving overall performance during the year. It has continued to maintain its position as a premier bank in the country and is oneof the most profitable and financially robust banks.Financial PerformanceAmount in Rs. millionResults for the year Fiscal Year Growth2067-68 2066-67 Volume PercentageTotal Operating Income 1,421 1,106 315 28.46Operating Profit 674 570 104 18.23Net Profit 465 392 73 18.59 Amount in Rs. millionPosition at the year end Fiscal Year Growth2067-68 2066-67 Volume Percentage Total Investment 18,911 16,306 2,605 15.98Total Assets 46,088 38,048 8,040 21.13Information per share (Rs.) Fiscal Year Growth2067-68 2066-67 Volume PercentageEarnings 24.85 23.69 1.16 4.90 Market Value at the year end 565 741 -176 -23.75Book Value at the year end 153.51 147.61 5.90 4.00Financial Ratios Fiscal Year Growth2067-68 2066-67 Change Capital Fund Ratio (%)Fiscal Year2067-68 2066-67Adequacy of Capital Fund on Risk Weighted Assets- Core Capital 10.32 10.89- Supplementary Capital 1.20 1.36- Total Capital 11.52 12.25 10 Annual Report 2010-11
Corporate CitizenshipCODE OF ETHICS on maintaining good corporate governance in the <strong>Bank</strong>. All themembers of the Board as well as the employees of the <strong>Bank</strong>are in full compliance with the code of ethics prescribed byNRB. Similarly, the <strong>Bank</strong> has also devised and implemented at all levels.INTERNAL CONTROL SYSTEMSAdequate internal control systems have been put in place by Internal Auditor, who directly reports to the Audit Committee andis also responsible for monitoring compliance with various NRBdirectives and guidelines. The Audit Committee of the <strong>Bank</strong>under chairmanship of a non-executive director reviews thefinancial position of the <strong>Bank</strong>, adequacy of its internal controlsystems and issues appropriate guidelines to the <strong>Bank</strong> based onthe feedback received from the internal audit reports.RISK MANAGEMENTFully recognizing the risk management functions as fundamentalto the business of banking, more emphasis has been placed onrisk assessment considering the turbulent economic environmentin which the <strong>Bank</strong> operates. The bank has adopted a holisticapproach and has been engaged in extensive and detailedevaluation and assessment of its risk management frameworkin all areas of banking activity. The <strong>Bank</strong> is compliant withcomprehensive Internal Capital Adequacy Assessment Process Risk and Operational Risk Management. In accordance withthese policies, four Risk Management Committees—ICAAPReview Committee, Credit Risk Management Committee,Market Risk Management Committee and Operational RiskManagement Committee—have been constituted. Primarygoal of the Risk Management Framework is to ensurethat outcomes of risk-taking activities are predictable and that there is an appropriate balance between risk and return inorder to maximize shareholder rewards.SOCIAL RESPONSIBILITY INITIATIVESWe have continued our approach towards taking socialresponsibility initiatives as an essential characteristic of ourbusiness and as a partner in progress of the community thatwe serve. The <strong>Bank</strong> is not only conscious about maximizing itsbusiness and profitability, but also equally conscious about itsresponsibility towards the society where it carries out businessand generates income. The <strong>Bank</strong> has always been showingits readiness to lend a supporting hand in every walk of life tothe best extent, especially to the weak and underprivileged. with other organizations, various individuals, groups orinstitutions in the wider area of social life including Health,Education, Sports, Environment Conservation etc.Annual Report 2010-1111
All the statutory requirements on disclosure of information have been embodied as annexure to this report.Further Information following this report provides detailed review of Operatingand Financial Performance of the <strong>Bank</strong> during FY 2067-68. Management and useful information for Shareholders can befound in their respective sections. Financial Statements includingBalance Sheet, Profit and Loss Account and Cash FlowStatement followed by the schedules prepared as prescribed by<strong>Nepal</strong> Rastra <strong>Bank</strong> and notes to accounts thereto can be foundin the complete annual report.14 Annual Report 2010-11
Path Ahead ourselves firmly in the <strong>Nepal</strong>i <strong>Bank</strong>ing arena. We have beenperforming better than the industry average under most ofthe key business indicators in the last couple of years and itwill be our endeavour to take this drive further. As we haveexpanded our network of banking officies from 20 in 2008 to56 in 2011 , we need to consolidate our position and grow.Towards this, we have set up two Regional Offices in Biratnagarand <strong>Nepal</strong>gunj. interest rate being provided on fixed deposits, it is observed thatsavings bank and current account deposits have declined whichis further going to increase cost of funds for banks.After the end of last financial year, the liquidity situation in themarket has improved but due to lack of viable banking projects,deployment of funds in profitable assets is going to be anotherchallenge. This situation may affect the profitability of the banksin the coming quarters.The Asian economy has been growing faster than the rest of theworld and due to this the demand for <strong>Nepal</strong>i migrant labour maycontinue to remain high which will ensure higher inflow of inwardremittances in the country. In order to encash this opportunitywe have launched our own web based remittances productin the Middle East countries which will be launched graduallyin other countries also where large number of <strong>Nepal</strong>i migrantworkers are located.Capital requirement of the banks is likely to go up in the light ofproposed introduction of Basel III by 2015 globally. In order todiscourage demand for new licenses, <strong>Nepal</strong> Rastra <strong>Bank</strong> mayalso increase the minimum capital requirement for the banks.Considering the low key performance of the Capital Marketin <strong>Nepal</strong> , raising capital from the primary market is likely toremain challenging particularly when many banks may requireto do this.Issuing operating instructions, introduction and disseminationof knowledge on new services and educating on corporateconcerns to the large number of employees spread throughoutthe country is no less challenging a job. In this direction, we havestarted two new training centers at Biratnagar and <strong>Nepal</strong>gunjin addition to the earlier two at Kathmandu and Pokhara.Establishing all these training centers are aimed at impartingnecessary skills to employees to update their job knowledge.<strong>Bank</strong> will look forward to build a still larger customer base andprovide services at affordable rate in order to continue its growth image as a prudent, affordable and reliable financial institutionwith strong brand value.Annual Report 2010-1115
AcknowledgementFinally, we would like to express our sincere appreciation to <strong>Nepal</strong>Rastra <strong>Bank</strong>, other regulatory bodies and State <strong>Bank</strong> of India fortheir guidance and support; to the shareholders and customers ofthe <strong>Bank</strong> for their patronage and business; to our business serviceproviders for their continuous support and last but not the least tothe dedicated employees of the <strong>Bank</strong> for their sincerity and hardwork, which has given us these consistently excellent results. Asalways, we welcome your thoughts and suggestions.Thank you !16 Annual Report 2010-11
Elegance ExemplifiedAnnual Report 2010-1117
Organisation Structure Credit Committee Audit Committee Chief Credit OfficerChief Financial OfficerChief Operating OfficerCompany Secretary Regional OfficesWestern Regional OfficeEasten Regional Office18 Annual Report 2010-11
Management TeamFrom Left to RightShri Arjun <strong>Nepal</strong> Shri Tulasi Ram Gautam Shri N. K. Chari Shri Madhukar Anand Shri Binod K. Mishra Shri Dev Raj Adhikari Annual Report 2010-1119
Management Review And Analysis As on Ashadh end2067-68 2066-67Value AddedIncome from banking services 3,517,101,949 2,550,521,349Cost of Services 2,383,448,640 1,592,741,243Value added by <strong>Bank</strong>ing Services 1,133,653,309 957,780,106 Total Value Added 1,131,908,452 917,337,730Value Allocated ToEmployees 320,777,167 184,172,772Salaries, allowances and other benefits 320,777,167 184,172,772Providers of Capital 353,155,957 394,218,140 Bonus Shares 233,662,907 207,700,362Interest on debenture and interbank borrowings 26,027,887 103,437,633Government 188,903,825 146,620,243Income Tax 188,903,825 146,620,243Expansion and Growth 269,071,503 192,326,575 Retained in Business 137,436,929 100,961,612Total Value Allocated 1,131,908,452 917,337,730Annual Report 2010-1123
Management Review And AnalysisTotal Tax PaidRs. 207.8 mincluding Rs. 19.77 million paid on behalf of employees. Customer Base308,644an increase of 109,680 number of retail customer duringthe year.Return on Net Fixed Assetsimproved return on net fixed assets. Human CapitalRs. 9,19,931 the yearNetworkincrement in physical representation with 7 branches, 18ATMs and 2 non-banking offices added since last Fiscal Year.As on Ashadh EndOperating Profit Earning Per Share 674.2 570.3 442.3206824.9 23.7 36.2 17.5 17.5 42.12067 2066 2068 2067 206620682067 2066Annual Report 2010-1125
Horizontal andVertical AnalysisBalance SheetFigures are in Horizontal Analysis Vertical AnalysisRs. millionsFinancial Position as on Ashadh End Variance Composition2068 to 2067 to2068 2067 2067 2066 In 2068 In 2067CAPITAL & LIABILITIES Total Capital and Liabilities 46088.2 38047.7 21.1% 26.1% 100.0% 100.0%ASSETS Total Assets 46088.2 38047.7 21.1% 26.1% 100.0% 100.0%26 Annual Report 2010-11
Management Review And AnalysisProfit and Loss StatementFigures are in Horizontal Analysis Vertical AnalysisRs. millionsFinancial Position at Ashadh End Variance Composition2068 to 2067 to2068 2067 2067 2066 In 2068 In 2067 NET INTEREST INCOME 1008.2 826.0 22.1% 29.9% 32.5% 36.4% TOTAL OPERATING INCOME 1421.1 1106.8 28.4% 33.6% 45.8% 48.8% OPERATING PROFIT BEFORE PROVISION 720.6 632.6 13.9% 31.1% 23.2% 27.9% OPERATING PROFIT 674.3 570.3 18.2% 28.9% 21.7% 25.1% PROFIT FROM REGULAR ACTIVITIES 856.5 629.5 36.1% -2.2% 27.6% 27.7% NET PROFIT AFTER CONSIDERING ALL ACTIVITIES 718.8 592.2 21.4% 21.5% 23.2% 26.1% NET PROFIT 464.6 391.7 18.6% 23.8% 15.0% 17.3%Annual Report 2010-1127
Products andBusiness PerformanceThrough a widespread branch network in almost all major cities, towns and sub-urban areas coupled with alternative deliverychannels, we aim to provide our customers with a wide array of offerings catering to all their banking needs.Deposit and AccountSaral Bachat Khata: It is one of the most popular depositaccounts of the bank which has attracted more than 150,000retail customers since its launch in year 2009. This accountwas targeted towards mid to low income group of people withlowered minimum balance requirement.Ujjwal Bhavisya Bachat Yojana: This is a flexiblerecurring account which allows customers to deposit a sumof money periodically up to a desirable term. This product isespecially useful for promoting savings and to use the fundreceived at maturity to fulfill personal needs that call for significantfinancial commitment.Varistha Nagarik Bachat: Targeted at individuals above49 years of age, this product provides customers with addedbenefits including higher rate of interest.Karmachari Bachat Khata: This account service waslaunched with special focus on groups of salaried employees a group of individuals can open Saving Account and enjoy anarray of concessional benefits on various services.Shareholders’ Account: Respecting the interests of theshareholders, the bank has offered to all its public shareholders,accounts with no minimum balance requirement. They can alsoreceive the dividends and other payments by the bank on thesame account.Loans and AdvancesCorporate and Business Loans: The bank offers loansto large corporate and institutional customers including publicsector entities and service them with offerings ranging fromloans to meet operational funding requirements to servicerelated to strategic expansions, syndications, project finance etc.Convenient Loan: This is tailor-made loan productdevised with special focus on the needs of Small and MediumSized Enterprises to meet their financing need in a veryconvenient manner.Mortgage and Mortgage Plus: Both Mortgage as well asMortgage Plus loans are personal credit given to individualspurely on the basis of their income level.Other Retail Loans: Retail loans largely comprise of autofinance, home loan and credit for consumer durables. Creditcard is not on offer yet.Remittance<strong>Nepal</strong> <strong>SBI</strong> Remit: This is a newly launched online internationalremittance service which offers a formal channel for the <strong>Nepal</strong>icommunity residing all around the world to send moneyto <strong>Nepal</strong>.Domestic Remittance Service: The bank started domesticremittance service in partnership with Prabhu Money Transfer.This product allows customers to send and receive money toand from any part of the country.28 Annual Report 2010-11
Management Review And Analysis<strong>SBI</strong> <strong>Nepal</strong> Express Remit: This is a unique remittanceproduct- the only one of its kind in <strong>Nepal</strong>. <strong>Nepal</strong>i migrant workersresiding and working in India can remit money at minimal chargesfrom more than 14,000 branches of State <strong>Bank</strong> of India locatedin various parts of India. We are now receiving 600 remittance inaverages per day through the service channel.Indo-<strong>Nepal</strong> Remit: This is another remittance-from-Indiaproduct launched by Reserve <strong>Bank</strong> of India which has chosen<strong>Nepal</strong> <strong>SBI</strong> bank to disburse the remittance money to thebeneficiaries in <strong>Nepal</strong>.WUMT’s/PMT’s Remittance: Customers can also receiveremittance money send from abroad via remittance channels Transfer at the branches of <strong>Nepal</strong> <strong>SBI</strong> <strong>Bank</strong>.Card<strong>Nepal</strong> <strong>SBI</strong> Card: be used at 68 ATM terminals of the bank as well as more than24,000 ATMs of State <strong>Bank</strong> of India. Presently, there aremore than 200,000 users of <strong>Nepal</strong> <strong>SBI</strong> Card which is risingvery rapidly.Bharat Yatra Card: Popularly known as BYC, this is a <strong>Nepal</strong>eseRupees denominated pre-paid card made for cash withdrawaland purchases while visiting India mainly for medical treatment,education, tours etc. <strong>Bank</strong> has already sold more than 14,000Bharat Yatra Cards since its launch in November 2008.Vishwa Yatra Card: denominated international prepaid card which the customers can usefor cash withdrawal in all the ATM terminals under VISA network inany part of the world and for purchases.Alternative Delivery ChannelsMobile Sakha: Mobile Sakha is mobile based banking servicedelivery channel which allows customers access various bankingservices like fund transfer, balance inquiry, bill payments, statementrequest, alert services etc.Internet <strong>Bank</strong>ing: This state-of-the-art online banking channelprovides customers with a PC and internet connection access tobanking services 24x7 from anywhere.Automated Teller Machine: <strong>Nepal</strong> <strong>SBI</strong> <strong>Bank</strong> has one of thelargest network of ATM terminals both locally and internationally.Presently, the bank has 67 ATM terminals around the country andhas access to more than 25,000 ATMs of State <strong>Bank</strong> of India group.Auxiliary ServicesUtility Bill Payment:Customers both accountholders and non-accountholders of the bankcan pay their telephone bills, insurance premium, school and college Safe Deposit Locker:This is one of the popular auxiliary services of the bank. Presentlycustomers can avail the service from 25 branches of the bank.Annual Report 2010-1129
NS EHUMLADARCHULABAITADIBAJHANG BAJURAMUGUDADELDHURADOTIKAILALIACHHAMKANCHANPURBARDIAKALIKOTDAILEKHSURKHETBANKEJUMLAJAJARKOTSALYANDANGRUKUMROLPAPYUTHANDOLPAMYAGDIMUSTANGDHADINGRASUWABAGLUNGGULMINUWAKOTBKTMSINDHUPALCHOKARGAKHACHIKAVREPALANCHOKPATANKAPILBASTUPALPAKASKISYANGJANAWALPARASIMANANGTANAHULAMJUNGCHITWANGORKHAMAKWANPURRAMECHHAPPARSABARASARLAHIKathmanduLalitpurSINDHULIBhaktapurPARBATDOLKHASOLUKHU<strong>MB</strong>U SANKHUWASABHATAPLEJUNGRUPANDEHIPANCHTHAROKHALDUNGAKHOTANGSIRAHAUDAYAPURSAPTARIBHOJPURSUNSARIDHANKUTAMORANGILAMRAUTAHATMAHOTTARIDHANUSATERATHUMJHAPARepresentation Eastern Central Western Mid-Western Far-Western TotalBranches 9 22 13 3 3 50Ext. Counters 1 4 1 - - 6ATMs 8 35 19 3 3 68Admin. Offices 1 1 - 1 - 3Total 19 62 33 7 6 127www.nepalsbi.com.np30 Annual Report 2010-11W
Adminstrative OfficesCorporate Office Eastern Regional Office Western Regional OfficeKathmandu Biratnagar <strong>Nepal</strong>gunjATM LocationsBranch LocationsInside Kathmandu Valley (27) Outside Kathmandu Valley (40) 28. Pokhara2. New Road29. PPO Pokhara3. Jawalakhel30. Sunauli4. Embassy of India31. <strong>Nepal</strong>gunj5. Bouddha 7. Maharajgunj34. Adarsha Nagar, Birgunj 35. Bhairahawa9. New Baneshwor36. Butwal10. Bhaktapur11. Hotel Sangrila,Lazimpat 13. Kalanki14. Chauni 16. Hattisar 18. NLIC City Center, Kamalpokhari19. BabarMahal20. Kuleshwor 22. Pepsicola, Purano SinaMangal23. Teku 26. Mangal Bazar*27. Putalisadak *37. Narayangarh38. Biratnagar39. Birtamod40. Janakpur41. Palpa 43. Surkhet44. Ilam45. Hetauda 47. Itahari48. Baglung 50. Waling51. Manipal Hospital, Pokhara52. Rampur, Birgunj53. Mahendranagar, Kanchanpur 59. Tikapur, Kailali60. Abu Khaireni,Tanahun61. Lakeside, Pokhara 65. Srijana Chowk, Pokhara66. Shishuwa, Pokhara* Inside Kathmandu Valley (17) New Road Teku Maharajgunj Boudha New Baneshwor Kalanki Jawalakhel Bhaktapur Commercial Branch, Lainchaur Kuleshwor Bhainsepati* Pepsicola*Outside Kathmandu Valley (33) Abukhaireni Baglung Bhairahawa Biratnagar Birgunj Birtamod Palpa Butwal Hetauda Itahari Ilam Janakpur Mahendranagar Narayangarh Pokhara <strong>Nepal</strong>gunj Rampur Shishuwa Srijana Chowk Surkhet Tikapur Waling Lahan* Myaglung* Parasi* Arghakhachi* Bargachi* Annual Report 2010-1131
32 Annual Report 2010-11Beauty Simplified
Human Resourcesand Industrial RelationsOur team of 505 employees share common values andculture that help us grow further. The enthusiasm, talentand commitment of our people are the source of thecompetitive strength of our bank which helps in seizing objectives with passionate management and developmentof our people.Recruitment and SelectionIn order to satisfy the growing human resource needs thatstem from the expansion of the branches and also fromincrease in volume of business, the <strong>Bank</strong> recruited andselected 60 new employees at various levels and deputed Equal Opportunity EmployerWe want to position ourselves as equal opportunityemployer and provide fair and equal opportunity foreveryone to be part of and work with <strong>Nepal</strong> <strong>SBI</strong> <strong>Bank</strong> as In <strong>Nepal</strong> <strong>SBI</strong> bank, employees are sourced from every partof the country.Human Resource DevelopmentThe <strong>Bank</strong> is committed at all times to ensure thatits people develop to their utmost potential andto equip them to face challenges and acquireopportunities present in the market effectively.Hence, to meet the training requirements ofthe staff, we have devised a quarterly trainingcalendar with an objective to give every individual a total of 1010 number of participants benefitedfrom 110 training programs organized internally aswell as externally.Workplace Health and Safety Issue Insurance Policy for all its employees. Additionally,we address any potentially arising health and safety events, illness and injuries that can be directed respect of the employees due to health issues.Annual Report 2010-1133
Social ResponsibilityInitiatives as an investment in society and its own future. As a responsiblecorporate citizen, we have undertaken Corporate SocialResponsibility as an integral part of the way we do business.We believe in giving back to the society by taking initiativeswith the intent to positively affect our stakeholders, whichinclude our customers, sponsors, partners, employees, as wellas our communities.Even in difficult economic conditions, we have shown anunwavering commitment to our role as a good corporatecitizen. We invest in CSR related-programs and projects withinour three areas of activity: Social Service, Education and Sports,and Conservation of Natural Environment. a helping hand to those who are less fortunate and in needof assistance. We have distributed food and other supplies tovictims of natural calamities, contributed to raise awareness onvarious social issues like educating girls, drug abuse and itseffects, road traffic rules and management etc. Similarly, wehave helped organize several health camps in different parts ofthe country as well as donated for various such events.We also attempt to promote public interest by encouragingcommunity growth and development through sponsoringsporting events and supporting educational activities. Weprovide scholarships to deserving students from poor familiesto pursue education at different levels. We also sponsor variousinternational, national and regional level sporting events and alsoencourage our employees to participate in such communityevents wherever possible.The <strong>Bank</strong> believes in the cause of a better environment andcontinually sponsors tree plantations, flower festivals as well asother beautification projects for a greener and cleaner country.34 Annual Report 2010-11
Annual Report 2010-1135
The <strong>Bank</strong> uses the term “corporate governance” to refer to the governance structure oforganizational and operational practices of its leadership and management. Compliance withall applicable legislation, regulations, standards and codes is an essential characteristic of making body and has ultimate responsibility for governance.36 Annual Report 2010-11
Statement of Responsibilities and Accounts for the fiscal year 2067-68, which includesbusiness performance review, risk management and internal of this Annual Report, financial Statements, SignificantAccounting Policies used and the Notes to Accounts of the<strong>Bank</strong> and the additional disclosures in the Annual Reportdesignated as audited, comply with requirements of the <strong>Nepal</strong>Accounting Standards and all other statutory and regulatoryrequirements. These Financial Statements and Notes thereto position as at 32 Ashadh, 2068 and its performance for theyear ended on that date.Risk management function has been accepted as an ongoingprocess which is in place to identify, measure, monitor and review this process through Risk Management Committee andspecific steps has been taken by the <strong>Bank</strong> in managing bothbanking and non-banking risks are detailed in the section on“Risk Management” of this Report. implementation of an effective and comprehensive system ofinternal controls covering financial operations and compliancecontrol required to carry on the business of banking in anorderly manner, safeguard its assets and secure as far aspossible the accuracy and reliability of the records. The internal controls over financial reporting during the yearunder review and up to the date of approval of theAnnual report and the Financial Statements to ensurethe soundness in financial reporting process. Chartered Accountants, who were appointed in accordance have expressed their opinion on presentation of financialstatements and governance of corporate matters and are part do not have any other relationship with the <strong>Bank</strong>. The Auditorsdo not have any interest in contracts with the <strong>Bank</strong>. functions detailed in the Memorandum of Associationand Articles of Association of the <strong>Bank</strong> and there were nosignificant changes in the nature of principal activities of the<strong>Bank</strong> during the financial year under review. There has notbeen any material event that occurred subsequently to thedate of the Balance Sheet that required adjustments to thefinancial statements. regulatory institutions and related to the employees have beenmade in time. plans and is satisfied that the <strong>Bank</strong> has adequate resources tocontinue its operations in the foreseeable future. Accordingly,the Financial Statements of the bank are prepared based ongoing concern concept. Annual Report 2010-1137
Ms. Hasana SharmaChairperson Mr. Hemant G. ContractorRepresenting State <strong>Bank</strong> of IndiaMr. Rajiv Pal SinghRepresenting State <strong>Bank</strong> of IndiaMr. S. K. BhattacharyyaRepresenting State <strong>Bank</strong> of IndiaMr. Manoj Kumar AgrawalRepresenting Public ShareholdersMr. Niranjan Kumar TibrewalaRepresenting Public ShareholdersMr. Mohan Raj JoshiIndependent Professional ExpertMr. N. K. Chari Representing State <strong>Bank</strong> of India38 Annual Report 2010-11
The Boardand Management for bringing independent judgment and scrutiny to decisions taken by the Board. In addition accountabilities. The Board determines the strategic objectives and policies of the <strong>Bank</strong> to deliverlong-term value, providing overall strategic direction within an appropriate framework of rewards,incentives and controls.The Board delegates the responsibility for the day-to-day management of the bank to the is operating effectively. The Chief Executive chairs the Central Management Committee, whichsupports him in this role. The Central Management Committee is supported by a number ofmanagement committees, including the Market Risk Management Committee, the Credit RiskManagement Committee, the Operational Risk Management Committee, the NPA and the NBAManagement Committee.The Audit CommitteeA four member Audit Committee, which includes Internal Auditor of the <strong>Bank</strong> as membersecretary, under chairmanship of a non-executive director has been established.The Charter of the Audit Committee, which is periodically reviewed and revised by the board,clearly defines the terms of reference of the Audit Committee. The main objective of the Audit responsibilities relating to financial and other compliance affairs of the <strong>Bank</strong>. matters connected with the internal control, systems and procedures and other aspects as Annual Report 2010-1139
ADDITIONAL INFORMATION REQUIRED TO BE FURNISHED AS PER SECTION 109 (4)OF THE COMPANIES ACT, 2063(i)(ii)(iii)(iv)(v)(vi)No shares have been forfeited by the <strong>Bank</strong> during the year.Main transactions carried out by the <strong>Bank</strong> during the financial year 2067/68, and any important changein the business of the <strong>Bank</strong> during the period: significant change in the nature of the business performed by the <strong>Bank</strong> during the year.No information has been received by the <strong>Bank</strong> from its basic shareholders as per the provisions of theCompanies Act, 2063.No shares were taken up by the Directors and key office-bearers of the <strong>Bank</strong> during the year nor werethey found to have engaged in the share transactions of the <strong>Bank</strong>’s shares in contravention of theprevailing laws.No information was received from any Director or any of his/her close relatives about his/her personalinterest in any agreement connected with the <strong>Bank</strong> signed during the financial year 2067/68.The <strong>Bank</strong> has not so far purchased any of its own shares.(vii)Particulars of the Total Management expenses of the financial yearS. N. Particulars Amount (in Rupees) (viii) The <strong>Bank</strong> has an Audit Committee comprising of the following membersS.N. Name of the MembersPosition Held ROLE PLAYED BY THE AUDIT COMMITTEE Review of financial position of the bank in comparison to other banks. Finalization of Internal Audit Program. Reviewing the implementation of recommendations made by the Statutory Auditors and NRB Inspection Team. Reviewing reconciliation status of Nostro Accounts.40 Annual Report 2010-11
(ix)(x)(xi)No Payment is due to the <strong>Bank</strong> from any Director, Managing Director, Executive Chief or the basicshareholders of the <strong>Bank</strong> or any of their close relatives, or from any firm, company or corporate body inwhich he is involved.The under noted amounts were paid as remunerations, allowances and facilities to the Directors, theManaging Director and other office bearers. A total of Rs. 1,588,000.00 was paid to the Board members as the Board Meeting fee for the different meetings medical expenses etc. Their salary and allowances are paid by <strong>SBI</strong>. allowances and facilities.Dividends yet to be collected by the shareholders Financial YearAmount (Rs.) Grand Total 11,573,868.43(xii) No property was purchased or sold by the <strong>Bank</strong> during the year as stipulated under Section 141 of theCompanies Act, 2063.(xiii) No transaction was held between the <strong>Bank</strong> and its associate companies during the year as stipulatedunder Section 175 of the Companies Act, 2006.Progress Report for the current year:The financial results for the 1st quarter of the current fiscal year have not been finalized as on the date of report writing. So wecouldnot cover the progress of the 1st quarter of the current fiscal year. Readers are requested to refer to the financial results for Mrs. Hasana SharmaChairperson Place: Kathmandu, <strong>Nepal</strong>Annual Report 2010-1141
Three Columns Format (Tin-Mahale) of the Amendments in the Memorandum ofAssociation of <strong>Nepal</strong> <strong>SBI</strong> <strong>Bank</strong> <strong>Ltd</strong>. Existing Provision Proposed Provision Reason forClause Clause the Amendment5.1 Hundred Sixty Nine Million Three Hundred Three Hundred Sixty Nine Million Three Hundred Three 5.1 capital to meet its business requirements as directed by NRB. To issue bonus shares. One Hundred Two Million Nine Hundred Sixty One Hundred Two Million Nine Hundred Sixty DISCLOSURE RELATED TO SUB RULE (1) OF RULE 22 OF SECURITIES REGISTRATION ANDISSUANCE REGULATION, 20651. Report of Board of Directors: Included in the Annual Report2. Report of the Auditors: Included in the Annual Report3. Audited financial Details: Included in the Annual Report4. Details relating to Legal Action 5. Analysis of share transaction and progress of Organized Institution:a. Management view on share transactions of the <strong>Bank</strong> on <strong>Nepal</strong> Stock Exchange:As the <strong>Nepal</strong> Stock Exchange is operating under the supervision of Securities Board of <strong>Nepal</strong>, management has nocomment on the same.b. Maximum, minimum and closing share price of organized institution including total transacted number of shares andtransacted days during the Year 2067-68:Quarter Maximum Minimum Closing Total Transacted Total Number of(Months) Share Price Share Price Share Price No. of Shares Trading DaysFirst Quarter Second Quarter Third Quarter Fourth Quarter 42 Annual Report 2010-11
6. Problems and Challengesa. Problems and Challenges Faced: ii. External: Competitive banking market.Liquidity Crunch.b. Strategy followed by the management in solving such problems and challenges:Branch expansion drive initiated with a view to target low cost deposits and business growth through large network.Targeting good quality loan customers.Regular In-House training to enhance work performance. 7. Corporate Governance 8. Declaration of Chairman/Chief Executive on truthfulness, correctness:I, as at the date, personally take responsibility on the truthfulness of the information and description presented in this report.Further, I declare that as far as I know and understand, the descriptions in this report are true, fair and complete and have notconcealed any necessary particulars, notices and information to the investors to take informed decision. Annual Report 2010-1143
A. Disclosure under clause 8(b) of <strong>Nepal</strong> Rastra <strong>Bank</strong>’s Unified Directive No. 6, 2068S. No. Name of Name of the debtor Nature of Name of the creditor Type of Amount (Rs) Tenure of Remarksthe Director (Individual/Firm/ Involvement (Financial Institution) Credit Facility the Loan/PeriodCompany) of facility Chairperson Merchant <strong>Bank</strong>er <strong>Ltd</strong>,Putalisadak, Kathmandu Hyat Enterprises Proprietor <strong>Nepal</strong> <strong>SBI</strong> <strong>Bank</strong> <strong>Ltd</strong>. Adhoc TR Outstanding -4,167,200.004. Mr. Mohan Raj Joshi, 44 Annual Report 2010-11
Risk ManagementPrimary goal of our risk management framework is to ensurethat outcomes of risk taking activities are predictable and and that there is an appropriate balance between risk and returnin order to maximize return to shareholders. We take a holisticapproach and have been engaged in extensive and detailedevaluation and assessment of its risk management framework inall areas of banking activities.Credit risk is the risk of financial loss the <strong>Bank</strong> may face as aresult of a borrower or a counterparty not meeting its obligations assets is in the form of loans and advances, management ofcredit risk has therefore become the most crucial task. TheCredit Risk Management Committee, thus, mainly focuses onmonitoring of Credit Risk on a <strong>Bank</strong> wide basis and ensuring Strategy approved by the Board and ensures incorporation regard to Credit Risk.Market Risk as defined by Market Risk Management policy ofthe bank is the risk of probable loss due to adverse changes in Risk Management Committee has the overall responsibility <strong>Bank</strong> through Market Risk limits, stop loss limits, etc., at amore granular level. It is involved in identification, assessment,monitoring, reporting and analysis of Market risks profileassociated with Treasury Operations.Operational risk can be defined as a risk arising from the people, systems and processes through which a companyoperates. It also includes other categories such as fraud risks,legal risks, physical or environmental risks. The Operational RiskManagement Committee reviews the risk profile, anticipateschanges and threats and concurs on areas of highest priorityand related mitigation strategies and ensures that adequateresources are being assigned to mitigate risks as needed.Interest Rate Risk of the overall balance sheet is measuredthrough the use of re-pricing gap analysis and duration analysis.We prepare interest rate risk reports on a periodic basis whichare submitted to <strong>Nepal</strong> Rastra <strong>Bank</strong>. Interest rate risk is furthermonitored through interest rate risk limits approved by the Asset Liquidity Risk We maintain diverse sources of liquidity tofacilitate flexibility in meeting funding requirements. Incrementaloperations in the domestic market are principally funded byaccepting deposits from retail and corporate depositors.46 Annual Report 2010-11
LessAnnual Report 2010-1147
Information Two Institutional promoters hold 70 percent of total shares in the <strong>Bank</strong> and rest is distributed among nearly 18,187 general shareholders. State Name Position No. of Shares Note: Apart from these, no other member of the Board and the Management team holds shares of the <strong>Bank</strong>.48 Annual Report 2010-11
By No. of SharesOver -10,000By No. of Shareholders5,001-10,0001001-5000501-1000101-500 Market Price Movement900800700Year 2010-11NSBL‘s Share PriceNepse Index6005004003002001000JulAugSep Oct Nov Jan Feb Mar Apr May Jun Jul Aug Sep OctAnnual Report 2010-1149
Financial Highlightsin Rs. LakhsAshadh End fy-05/06 fy-06/07 fy -07/08 fy-08/09 fy - 09/10 fy-10/112062/63 2063/64 2064/65 2065/66 2066/67 2067/68ProfitabilityInterest Income 7,087.19 8,311.17 9,705.13 14,604.46 22,697.04 31,042.32Interest Expenditure 3,347.70 4,122.62 4,549.18 8,247.00 14,436.94 20,960.38Fee, Commission andExchange income 838.14 1,020.55 1,029.07 1,401.31 2,020.20 3,176.97Other income 71.37 126.01 195.57 527.90 787.97 951.73Operating Expenses 992.14 1,201.12 1,523.80 2,239.66 3,438.50 4,450.73Operating Profit 1,684.89 3,007.90 3,533.25 4,423.66 5,702.90 6,742.52Profit Before tax 1,997.64 3,445.90 3,480.34 4,430.32 5,383.62 6,534.69Profit After tax 1,170.02 2,549.09 2,477.71 3,163.73 3,917.42 4,645.65Shareholders FundTotal Shareholders funds 9,823.74 11,632.91 14,146.45 17,126.07 24,505.54 28,792.93Share Capital 6,402.36 6,477.98 8,745.28 12,243.39 18,613.24 21,029.66Reserves 3,421.38 5,154.92 5,401.17 4,882.68 5,892.30 7,763.27Liabilities Bills Payable 462.39 488.56 751.15 629.47 723.68 806.85Other liabilities 8,051.86 10,437.68 17,622.91 2,336.64 4,283.33 5,128.12AssetsAdvances 76,267.36 94,604.51 121,136.98 151,317.48 174,805.48 213,657.71Investments 36,107.75 26,594.53 30,888.87 132,861.82 163,056.33 189,110.22Liquid Assets 14,813.58 14,726.90 16,469.73 11,764.40 34,412.61 48,778.26Net Fixed Assets 667.12 972.19 1,202.22 2,535.81 4,182.45 4,170.03Other Assets 2,502.57 2,113.88 2,176.65 3,184.89 4,019.92 5,166.13Total Assets 130,358.39 139,012.01 171,874.46 301,664.40 380,476.79 460,882.3450 Annual Report 2010-11
Business Ratioand InformationAshadh End fy - 09/10 fy-10/112066/67 2067/68Ratios Profit per employees Rs. 842,456.17 Rs. 919,930.69 Share informationEarnings Per Share Rs. 23.69 Rs. 24.85Number of Ordinary Shares 16,536,239 18,693,033 Book Value Per Share Rs. 147.61 Rs. 153.51Other informationNumber of Employees 465 505Number of Branches 43 50Number of ATMs 50 687 Branches and 6 ATMs were added after Ashadh end 2068.Annual Report 2010-1151
52 Annual Report 2010-11Is More
FinancialStatementsAnnual Report 2010-1153
BALANCE SHEET S.No. Capital & Liabilities Schedule Current Year Rs. Previous Year Rs.1. Share Capital 1 2,102,966,165 1,861,324,2392. Reserves and Funds 2 776,326,985 589,229,831 4. Borrowings 4 - - 6. Bills Payable 6 80,685,337 72,368,229 8. Income Tax Liabilities - -9. Other Liabilities 7 419,347,031 345,252,820Total Capital and Liabilities 46,088,233,975 38,047,679,465S.No. Assets Schedule Current Year Rs. Previous Year Rs.1. Cash Balance 8 1,007,688,499 815,679,6242. Balance with <strong>Nepal</strong> Rastra <strong>Bank</strong> 9 2,330,927,217 1,842,802,2393. 10 1,539,210,142 782,779,6144. Money at Call and Short Notice 11 - -5. Investment 12 18,911,021,520 16,305,632,8156. Loans, Advances and Bills Purchase 13 21,365,771,129 17,480,548,1947. Fixed Assets 14 417,002,530 418,244,7608. Non <strong>Bank</strong>ing Assets 15 - -9. Other Assets 16 516,612,938 401,992,219Total Assets 46,088,233,975 38,047,679,465Contingent Liabilities Schedule 17 Principal Indicators Schedule 31Principal Accounting Policies Schedule 32Notes to Accounts Schedule 33Schedules 1 to 17 form integral part of the Balance Sheet.____________________ Chief Operating Officer____________________ ____________________ Chairperson____________________ ____________________ ____________________ ____________________ ____________________ As per our attached report of even date____________________ ________________________ Chartered Accountants54 Annual Report 2010-11
S.No. Particulars Schedule Current Year Rs. Previous Year Rs.1. Interest Income 18 3,104,231,807 2,269,704,2912. Interest Expenses 19 2,096,038,379 1,443,693,573Net Interest Income 1,008,193,428 826,010,718 4. Other Operating Incomes 21 95,172,658 78,796,6625. Exchange Fluctuation Income 22 70,532,720 70,328,247Total Operating Income. 1,421,063,570 1,106,827,7766. Staff Expenses 23 255,430,285 130,336,5367. Other Operating Expenses 24 445,072,722 343,850,2668. Exchange Fluctuation Loss 22 - -Operating Profit beforeprovision for possible loss 720,560,563 632,640,9749. Provision for Possible Losses 25 46,308,152 62,350,544Operating Profit 674,252,411 570,290,430 11. Provision for Possible Loss Written Back 27 179,122,158 56,621,276Profit from Regular Operations 856,488,334 629,464,598 Net profit after considering all activities 718,815,706 592,198,59813. Provision for Staff Bonus 65,346,882 53,836,23614. Provision for Income Tax 188,903,825 146,620,243 Net Profit/Loss 464,564,999 391,742,119Schedule No. 18 to 28 form are integral part of the Profit and Loss Account.____________________ Chief Operating Officer____________________ ____________________ Chairperson____________________ ____________________ ____________________ ____________________ ____________________ As per our attached report of even date____________________ ________________________ Chartered AccountantsAnnual Report 2010-1155
S.No. Particulars Schedule This Year Rs. Previous Year Rs.INCOME1. Accumulated Profit up to Last Year 4,249,307 3,848,810 3. Exchange Fluctuation Reserve4. Capital Adjustment Reserve up to Previous Year 50,000,000 65,000,000Total 518,814,306 460,590,929EXPENSES1. Accumulated Loss up to Last Year - - 4. Contingent Reserve - - 7. Staff Related Reserve - - 9. Proposed issue of Bonus Shares 233,662,907 207,700,36210. Special Reserve - -11. Exchange Fluctuation Reserve Fund 79,009 -12. Capital Redemption Reserve Fund - -13. Capital Adjustment Reserve 30,000,000 50,000,00014. Investment Adjustment Reserve 24,572,100 641,720 Total 515,962,774 456,341,62217. Accumulated Profit/(Loss) 2,851,532 4,249,307____________________ Chief Operating Officer____________________ ____________________ Chairperson____________________ ____________________ ____________________ ____________________ ____________________ As per our attached report of even date____________________ ________________________ Chartered Accountants56 Annual Report 2010-11
Particulars Share Capital Accumulated General Capital Share Investment Proposed Exchange Deferred Tax Other Total AmountProfit/Loss Reserve Adjustment Premium Adjustment Bonus Equilisation Reserves Reserve AdjustmentReserve Reserve Shares Fund and FundsRs Rs Rs Rs Rs Rs Rs Rs Rs Rs RsOpening Balance at Shrawan 2067 1,653,623,877 4,249,307 382,868,285 50,000,000 - 641,720 207,700,362 10,200,116 26,984,687 114,285,716 2,450,554,070 Adjustments: Proposed BonusShare of previous year treated as Restated Balance as onShrawan 2067 1,861,324,239 4,249,307 382,868,285 50,000,000 - 641,720 - 10,200,116 26,984,687 114,285,716 2,450,554,070AdjustmentsNet profit for the period - 464,564,999 - - - - - 464,564,999 Share Premium 49,660,225 49,660,225 Capital Redemption Reserve - - - - - - -Bonus Share Issued - - - - - - - Right Share issue 7,979,019 7,979,019Closing Balance at Asadh 2068 1,869,303,258 2,851,532 475,781,285 30,000,000 49,660,225 25,213,820 233,662,907 10,279,125 39,683,853 142,857,145 2,879,293,150______________________ Chief Operating Officer______________________ ______________________ Chairperson______________________ ______________________ ______________________ ______________________ ______________________ ______________________ _____________________________ Co. Chartered AccountantsAs per our attached report of even dateAnnual Report 2010-1157
CASH FLOW STATEMENT S.No. Particulars This Year Rs. Previous Year Rs.(a) Cash Flow from Operating Activities 1,506,835,670 1,884,344,9261. Cash Received 3,472,163,522 2,533,379,0861.1 Interest Income 3,055,222,675 2,242,447,613 1.3 Income from Foreign Exchange transaction 70,216,686 73,029,5931.4 Recovery of loan written off - 7,082,0001.5 Other Incomes 99,559,397 79,127,7312. Cash Payment 2,877,318,098 2,019,645,9492.1 Interest Expenses 2,082,963,604 1,438,901,7982.2 Staff Expenses 207,930,584 120,367,4102.3 Office Overhead Expenses 344,587,674 258,751,0562.4 Income Tax Paid 188,000,000 157,322,5262.5 Other Expenses 53,836,236 44,303,159Cash Flow before changes in Working Capital 594,845,424 513,733,137(Increase) /Decrease of Current Assets (6,546,251,810) (5,457,606,767) Increase /(Decrease) of Current Liabilities 7,458,242,056 6,828,218,556 (b) Cash Flow from Investment Activities (128,226,567) (253,807,204) 3. Interest income from Long term Investment - - 5. Others -(c) Cash Flow from Financing Activities 57,639,244 636,985,263 (d) Income/Loss from change in exchange rate inCash & bank balances 316,034 (2,701,346)(e) Current Year’s Cash Flow from All Activities 1,436,564,381 2,264,821,639(f) Opening Balance of Cash and <strong>Bank</strong> Balances 3,441,261,477 1,176,439,838(g) Closing Balance of Cash and <strong>Bank</strong> Balances 4,877,825,858 3,441,261,477______________________ Chief Operating Officer______________________ _____________________ ______________________ Chairperson______________________ ______________________ ______________________ ______________________ ______________________ ______________________ As per our attached report of even date58 Annual Report 2010-11
Schedule 1S.No. ParticularsThis Year Rs. Previous Year Rs.1. Share Capital1.1 Authorized Capital 2,000,000,000 2,000,000,000 1.2 Issued Capital 1,869,303,258 1,661,602,896 1.3 Paid Up Capital 1,869,303,258 1,653,623,877 1.4 Proposed Bonus Share 233,662,907 207,700,3621.5 Calls in Advance - -1.6 Total Amount (1.3+1.4+1.5) 2,102,966,165 1,861,324,239 fraction figures. In the absence of clear legal provisions permitting issuance of Share Certificate for such fraction entitlements of the shareholders, of the shareholders is also accounted under share capital.Share Ownership Details This Year Previous Year Rs.% Share Capital % Share Capital1. Domestic Ownership 44.95% 840,315,132 44.72% 739,457,877 1.2 “A” Class Licensed Institutions - - - -1.3 Other Licensed Institutions - - - - 1.6 Others - - - -2. Foreign Ownership 55.05% 1,028,988,126 55.28% 914,166,000Total 100.00% 1,869,303,258 100.00% 1,653,623,877Note :- Annual Report 2010-1159
Schedule 2Particulars This Year Rs. Previous Year Rs. 2. Capital Reserve3. Capital Redemption Reserve - -4. Capital Adjustment Reserve 30,000,000 50,000,0005. Other Reserves and Funds 257,415,043 141,912,1235.1 Contingent Reserve - - 5.4 Special Reserve - -5.5 Assets Revaluation Reserve - - 5.7 Other Free Reserves - -5.8 Investment Adjustment Reserve 25,213,820 641,720 5.9 Share Premium Account 49,660,225 7. Exchange Equalization Fund 10,279,125 10,200,116Total 776,326,985 589,229,831 Schedule 3Particulars This Year Rs. Previous Year Rs. Issued on 16.07.2006 and maturingon 15.07.2013 - - Total 200,000,000 200,000,000 Schedule 4Particulars This Year Rs. Previous Year Rs.A. Local - - 2. <strong>Nepal</strong> Rastra <strong>Bank</strong> - -3. Repo Obligations - -4. Inter <strong>Bank</strong> and Financial institutions - -5. Other Organised Institutions - -6. Others - -Total - -B. Foreign - -1. <strong>Bank</strong>s - -2. Others - -Total - -Total (A+B) - -60 Annual Report 2010-11
Schedule 5Particulars This Year Rs. Previous Year Rs.1. Non-Interest bearing accountsA. Current Deposits 4,259,415,723 2,861,877,9581. Local Currency 4,156,210,911 2,520,409,399 1.2 “A” Class Licensed Institutions 52,579 30,3841.3 Other Licensed Institutions 15,208,398 12,618,4131.4 Other Organized Institutions 4,027,893,352 1,381,994,8491.5 Individuals 98,586,847 1,125,238,3631.6 Others - -2. Foreign Currency 103,204,811 341,468,559 2.2 “A” Class Licensed Institutions2.3 Other Licensed Institutions - -2.4 Other Organized Institutions 103,204,811 341,468,5592.5 Individuals - -2.6 Others - -B. Margin Deposits 146,158,747 123,087,392 3. Margin on Letter of Credit 98,694,303 93,582,177C. Others - -1. Local Currency - -1.1 Financial Institutions - -1.2 Other Organized Institutions - -1.3 Individual - -2. Foreign Currency - -2.1 Financial Institutions - -2.2 Other Organized Institutions - -2.3 Individual - -Total of Non-Interest Bearing Accounts 4,405,574,469 2,984,965,350Annual Report 2010-1161
Schedule 5AParticulars This Year Rs. Previous Year Rs.2. Interest Bearing AccountsA. Saving Deposits 8,079,243,659 7,348,969,8071. Local Currency 7,961,340,989 7,259,969,0751.1 Organized Institutions 109,198,972 147,410,2681.2 Individual 7,852,142,017 7,112,558,8071.3 Others - -2. Foreign Currency 117,902,670 89,000,7322.1 Organized Institutions 94,728,586 79,988,1382.2 Individual 23,174,084 9,012,5942.3 Others - -B. Fixed Deposits 28,013,550,392 22,148,948,3291. Local Currency 14,780,482,661 10,408,484,1311.1 Organized Institutions 9,141,818,577 5,190,040,7461.2 Individual 5,638,664,084 5,218,443,3851.3 Others - -2. Foreign Currency 13,233,067,731 11,740,464,1982.1 Organized Institutions 13,233,067,731 11,740,464,1982.2 Individual2.3 Others - -C. Call Deposits 1,917,074,774 2,413,540,7151. Local Currency 1,860,003,849 2,386,366,2891.1 “A” Class Licensed Institutions - 218,3911.2 Other Licensed Institutions 47,897,493 161,117,7001.3 Other Organized Institutions 624,589,093 979,287,4661.4 Individual 1,187,517,263 1,245,742,7321.5 Others - -2. Foreign Currency 57,070,925 27,174,4262.1 “A” Class Licensed Institutions - -2.2 Other Licensed Institutions - -2.3 Other Organized Institutions 57,070,925 27,174,4262.4 Individual2.5 Others - -D. Certificate of Deposit - -1. Organized Institutions - -2. Individual - -3. Others - -Total of Interest Bearing Accounts 38,009,868,825 31,911,458,851Total Deposit (1+2) 42,415,443,294 34,896,424,201BILLS PAYABLE Schedule 6Particulars This Year Rs. Previous Year Rs.1. Local Currency 62,624,968 54,331,6272. Foreign Currency 18,060,369 18,036,602Total 80,685,337 72,368,22962 Annual Report 2010-11
OTHER LIABILITIES Schedule 7Particulars This Year Rs. Previous Year Rs. 2. Employee Provident Fund - -3. Employees Welfare Fund - -4. Provision for Staff Bonus 65,346,882 53,836,236 8. Sundry Creditors 32,032,747 99,643,6359. Branch Account - - 12. Others 171,977,352 102,721,205 Total 419,347,031 345,252,820CASH BALANCE Schedule 8Particulars This Year Rs. Previous Year Rs. 2. Foreign Currency 29,221,862 18,804,627Total 1,007,688,499 815,679,624BALANCE WITH NEPAL RASTRA BANK Schedule 9Particulars Local Currency Foreign Currency This Year Rs. Previous Year Rs.INR Convertible Total1. <strong>Nepal</strong> Rastra <strong>Bank</strong> 2,318,372,878 - 12,554,339 12,554,339 2,330,927,217 1,842,802,239a. Current Account 2,318,372,878 - 12,554,339 12,554,339 2,330,927,217 1,842,802,239b. Other Account - - - - - -Annual Report 2010-1163
Schedule 10Particulars Local Currency Foreign Currency This Year Rs. Previous Year Rs.IRS. Convertible FCY Total1. Local Licensed Institutions 55,257,129 - 4,437,260 4,437,260 59,694,389 56,919,797a. Current Account 55,257,129 - 4,437,260 4,437,260 59,694,389 56,919,797b. Other Account - - - - - -2. Foreign <strong>Bank</strong>s - 1,315,678,442 163,837,311 1,479,515,753 1,479,515,753 725,859,817a. Current Account - 1,315,678,442 163,837,311 1,479,515,753 1,479,515,753 725,859,817b. Other Account - - - - - -Total 55,257,129 1,315,678,442 168,274,571 1,483,953,013 1,539,210,142 782,779,614Note: Total balance for which the confirmations are received from respective licensed institutions Rs. 2,426,661,555 Schedule 11Particulars This Year Rs. Previous Year Rs.1. Local Currency - -2. Foreign Currency - -TOTAL - -64 Annual Report 2010-11
INVESTMENTS Schedule 12Particulars Purpose This Year Rs. Previous Year Rs.Trading Other 4. <strong>Nepal</strong> Rastra <strong>Bank</strong> Bonds - - - -5. Foreign Securities - - - -6. Local Licensed Institutions - - - 50,500,0007. Foreign <strong>Bank</strong>s - 13,296,532,500 13,296,532,500 11,904,794,0008. Corporate Shares - 39,646,500 39,646,500 37,021,500 10. Other Investments - - - -Total Investment - 18,911,021,520 18,911,021,520 16,305,632,815Provision - - - -Net Investment - 18,911,021,520 18,911,021,520 16,305,632,815Annual Report 2010-1165
Particulalrs Cost Price Rs. Market Price Rs. Provision Amount Rs. This Year Rs. Previous Year Rs.1. Investment in Shares 39,646,500 - - 39,646,500 37,021,500 51,950 Ordinary Shares of Rs. 100 fully paid up 5,195,000 - - 5,195,000 5,195,000137,000 Right Shares of Rs. 100 fully paid up 13,700,000 - - 13,700,000 13,700,000 30,000 Ordinary Shares of Rs. 100 fully paid up 3,000,000 - - 3,000,000 3,000,0005,000 Shares of Rs. 100 Additional Investment 500,000 - 500,000 500,00026,250 Shares of Rs. 100 Additional Investment 2,625,000 - 2,625,0001.3 Alliance Insurance Co. <strong>Ltd</strong>.7,480 Ordinary Shares of Rs. 100 fully paid up 748,000 882,640 - 748,000 748,0001496 Bonus Shares - 176,528 - - 89,430 Ordinary Shares of Rs. 100 fully paid up 8,943,000 8,943,000 - 8,943,000 8,943,0001.5 Credit Information Center <strong>Ltd</strong>. - -3,530 Ordinary Shares of Rs. 100 fully paid up 353,000 - 353,000 353,0008825 Right Shares of Rs 100 fully paid up 882,500 - - 882,500 882,50013061 Bonus Shares - - - -1.6 <strong>Nepal</strong> Clearing House 2,500,000 - 2,500,000 2,500,0001.7 National <strong>Bank</strong>ing Training Institute - -12000 Shares of Rs. 100 fully paid up 1,200,000 1,200,000 1,200,0002. Investment in Debentures and Bonds - - - Total Investment 39,646,500 - - 39,646,500 37,021,5003. Provision for Loss - - - Total Provision - - -Net Investment 39,646,500 - 39,646,500 37,021,500Note: 66 Annual Report 2010-11
Schedule 12.1Particulars Cost Price Previous Market Current Market This Year. Previous Year RemarksRs. Price(a) Rs. Price (b) Rs. Profit /Loss (b-a) Rs Profit /Loss Rs. 4. <strong>Nepal</strong> Rastra <strong>Bank</strong> Bonds - - - - -5. Foreign Securities - - - - - 10. Interbank Lending - - - - -11. Other Investments - - - - -Total Investment - - - - - Particulars Cost Price(a Impairment Impairment This Year. Previous Year RemarksRs. Till Date(b) Rs. This Year (c) Rs. Profit /Loss (a-b-c) Rs Profit /Loss Rs. 4. <strong>Nepal</strong> Rastra <strong>Bank</strong> Bonds - - - - -5. Foreign Securities - - - - - Total Investment 18,871,375,020.00 - - - -Schedule 12 .2Annual Report 2010-1167
Cost Price Previous Current This Year. Previous Year RemarksParticulars Rs. Market Price(a) Rs. Market Price (b) Rs. Investment Adjustment Profit /Loss Rs.Reserve (b-a) Rs. 4. <strong>Nepal</strong> Rastra <strong>Bank</strong> Bonds - - - - -5. Foreign Securities - - - - - Listed 9,691,000.00 10,226,568.00 10,002,168.00 - - *Not Listed 29,955,500.00 - - ** 10. Interbank Lending - - - - -11. Other Investments - - - - -Total Investment 39,646,500.00 10,226,568.00 10,002,168.00 - -Schedule 12 .3Note:* Even though the current market price is higher than the cost price we have not marked these securities to market because the volume of transaction on these securities is very low. National <strong>Bank</strong>ing Training Institute.68 Annual Report 2010-11
Schedule 13Loans & Advances Bills Purchased/DiscountParticulars Domestic Foreign Total Domestic Foreign Total This Year Rs. Previous Year Rs.Priority Sector OtherInsured Uninsured1. Performing Loan 133,530,958 651,723,013 20,632,534,027 - 21,417,787,998 56,207,684 5,495,863 61,703,547 21,479,491,545 17,471,059,1891.1 Pass 133,530,958 651,723,013 20,632,534,027 - 21,417,787,998 56,207,684 5,495,863 61,703,547 21,479,491,545 17,471,059,1892. Non-Performing Loan 6,479,127 3,726,177 229,093,882 - 239,299,186 - - - 239,299,186 492,581,9902 a Restructured 497,744 139,446,836 - 139,944,580 - - - 139,944,580 227,448,2412.1 Sub-Standard 425,828 1,970,259 - 2,396,087 - - - 2,396,087 12,975,351 2.3 Loss 4,478,490 3,726,177 86,953,904 - 95,158,571 - - - 95,158,571 251,044,459A. Total Loan 140,010,085 655,449,190 20,861,627,909 - 21,657,087,184 56,207,684 5,495,863 61,703,547 21,718,790,731 17,963,641,1793. Loan Loss Provision3.1 Pass 333,827 6,517,230 206,325,340 - 213,176,397 562,077 54,959 617,035 213,793,432 173,583,5373.2 Restructured 54,377 - 46,356,837 - 46,411,214 - - - 46,411,214 60,345,7743.3 Sub-Standard 26,614 - 492,565 - 519,179 - - - 519,179 3,189,722 3.5 Loss 1,119,622 3,726,177 86,953,904 - 91,799,703 - - - 91,799,703 245,754,799B. Total Provisioning 1,669,073 10,243,407 340,490,087 - 352,402,567 562,077 54,959 617,035 353,019,602 483,092,9854. Provisioning up to previous year4.1 Pass 375,685 3,851,399 168,170,412 - 172,397,496 2,150 1,183,891 1,186,041 173,583,537 149,466,5414.2 Restructured 136,252 - 60,209,522 - 60,345,774 - - - 60,345,774 39,071,4964.3 Sub-Standard 18,038 - 3,171,684 - 3,189,722 - - - 3,189,722 2,740,744 4.5 Loss 1,763,220 5,275,067 238,716,512 - 245,754,799 - - - 245,754,799 285,338,247C. Total previous year’s provision 2,405,801 9,126,466 470,374,677 - 481,906,944 2,150 1,183,891 1,186,041 483,092,985 480,302,467D. Written Back fromPrevious Year’s 428,292 206,301 175,548,815 - 176,183,408 - - - 176,183,408 56,621,276E. Additional Provision ofCurrent Year (308,436) 1,323,242 45,664,225 - 46,679,031 559,927 (1,128,932) (569,006) 46,110,025 59,411,794F. Changes this year (736,728) 1,116,941 (129,884,590) - (129,504,377) 559,927 (1,128,932) (569,006) (130,073,383) 2,790,518Net Loan (A-B) 138,341,012 645,205,783 20,521,137,822 - 17,480,548,194 55,645,607 5,440,904 61,086,512 21,365,771,129 17,480,548,194 Annual Report 2010-1169
Particulars This Year Rs. Previous Year Rs.A. Secured 21,718,790,731 17,963,641,179 10. Other Securities 1,037,719,899 953,272,554B. Unsecured - -Total 21,718,790,731 17,963,641,17970 Annual Report 2010-11
Schedule 14Particulars ASSETS This Year Previous YearBuildings Vehicles Machinery Office Equipment Others Rs. Rs.1. Cost Pricea. Previous Year balance - 105,608,078 190,435,709 255,333,167 78,239,772 629,616,726 404,070,587b. Addition during the year - 16,278,617 35,497,037 62,025,001 21,157,170 134,957,825 257,766,185 d. Sold during the year - - -e. Written off during the year - 10,925 3,073,199.69 6,658,809 1,347,346.52 11,090,280 32,220,046 2. Depreciation - - b. For this year - 19,103,990 45,369,855 55,138,340 12,022,388 131,634,573 91,364,966 3. Book Value (WDV*) (1-2) - 72,157,018 99,196,754 180,971,840 64,676,917 417,002,530 418,244,7604. Land - - - - - - -5. Capital Construction (Pending Capitalization) - - - - - - -6. Leasehold Assets - - - - - - -Total (3+4+5+6) - 72,157,018 99,196,754 180,971,840 64,676,917 417,002,530 418,244,760Annual Report 2010-1171
Schedule 15 Name & Address of Date of assuming Total Amount Loss Provision Net Non “PreviousNon <strong>Bank</strong>ing of Non <strong>Bank</strong>ing <strong>Bank</strong>ing Year Rs.Borrower or Party Assets Assets In % In Amount Assets (Rs) (Net NBA)”-Total - - - - -OTHER ASSETS Schedule 16Particulars This Year Rs. Previous Year Rs.1. Stock of Stationery 4,148,587 4,362,3962. Income receivable on Investment 163,407,655 114,398,5233. Accrued Interest on Loan 140,411,150 283,256,183 4. Commission Receivable - - 7. Pre Payments 35,123,315 11,626,6298. Cash in Transit - - 11. Expenses not written off 8,363,205 9,448,67712. Branch Account - - 14. Others 56,548,350 85,866,118 Total 516,612,938 401,992,219 Particulars This Year Rs. PreviousUp to 1Year 1 to 3 years Above 3years Total Year Rs.1. Accrued Interest on Loan 35,563,917 27,501,977 77,345,256 140,411,150 283,256,183 3. Branch Account - - - - - Total 35,563,917 27,501,977 109,345,256 172,411,150 315,256,183 provided for the balance of Rs 2.23 crore, net of aforesaid provision is disclosed in schedule 1672 Annual Report 2010-11
Schedule 17Particulars This Year Rs. Previous Year Rs.1. Claims on institution not accepted by the Institution - - a. Less than 6 months maturity 1,448,994,775 1,933,140,934b. More than 6 months maturity - -3. Rediscounted Bills - - a. Bid Bonds 115,022,312 60,861,123b. Performance Bonds 498,434,612 433,164,050 6. Forward Exchange Contract Liabilities7. Bills under Collection 33,993,511 56,448,012 10. Irrevocable Loan Commitment 2,492,998,420 2,065,436,420 Internationally Rated <strong>Bank</strong>s” 890,850,650 825,308,855 14. Contingent Liabilities on Income Tax - -15. Others - -Total 6,883,583,667 6,482,784,570Annual Report 2010-1173
INTEREST INCOMEFrom 1st Shrawan 2067 to 32nd Asadh 2068Schedule 18Particulars This Year Rs. Previous Year Rs.A. On Loans, Advances and Overdraft 2,441,993,586 1,760,201,809 2. Overdraft 454,531,330 333,931,031B. On Investment 397,295,514 209,922,727 a. Treasury Bills 311,820,527 170,154,994 c. National Saving Certificates - -2. Foreign Securities - -3. <strong>Nepal</strong> Rastra <strong>Bank</strong> Bonds - - b. Other Organizations - -5. Interest on Inter - <strong>Bank</strong> Lending 22,781,786 3,596,442C. On Agency Balances - -1. Local <strong>Bank</strong>s - -2. Foreign <strong>Bank</strong>sD. On Money at Call and Short Notice - - 2. Foreign <strong>Bank</strong>sE. On Others 264,942,707 299,579,755 2. Inter-<strong>Bank</strong> Loan - -3. Placement with Foreign <strong>Bank</strong>s 257,351,461 293,911,3204. Others 7,591,246 5,668,435Total 3,104,231,807 2,269,704,29174 Annual Report 2010-11
INTEREST EXPENSESFrom 1st Shrawan 2067 to 32nd Asadh 2068Schedule 19Particulars This Year Rs. Previous Year Rs.A. ON DEPOSIT LIABILITIES 2,070,010,492 1,340,255,9401. Fixed Deposits 1,665,036,117 980,473,9611.1 Local Currency 1,435,173,171 703,879,5721.2 Foreign Currency 229,862,946 276,594,3892. Saving Deposits 248,283,754 204,145,5232.1 Local Currency 247,726,636 203,598,0472.2 Foreign Currency 557,118 547,4763. Call Deposits 156,690,621 155,636,4563.1 Local Currency 156,480,283 155,232,1873.2 Foreign Currency 210,338 404,2694. Certificate of Deposits - -B. ON BORROWINGS 26,027,887 103,437,633 2. Loan from <strong>Nepal</strong> Rastra <strong>Bank</strong> - - 4. Other Corporate Body - - C. ON OTHERS - -Total 2,096,038,379 1,443,693,573Annual Report 2010-1175
From 1st Shrawan 2067 to 32nd Ashadh 2068Schedule 20Particulars This Year Rs. Previous Year Rs.A. Bills Purchase & Discount 986,715 1,563,4111. Local 142,529 601,1692. Foreign 844,186 962,242B. Commission 89,546,099 74,077,6351. Letters of Credit 22,304,824 21,389,282 3. Collection Fees 4,120,247 3,775,5574. Remittance Fees 34,246,799 28,491,4945. Credit Card - - 8. Agency Commission - -9. Exchange Fee - 7,239C. Others 156,631,950 56,051,103Total 247,164,764 131,692,149OTHER INCOMEFrom 1st Shrawan 2067 to 32nd Ashadh 2068Schedule 21Particulars This Year Rs. Previous Year Rs. 5. Service Charges 39,081,276 35,874,7816. Renewal Fees 8,691,020 5,181,892 Total 95,172,658 78,796,66276 Annual Report 2010-11
From 1st Shrawan 2067 to 32nd Ashadh 2068Schedule 22Particulars This Year Rs. Previous Year Rs. Total Income (Loss) 70,532,720 70,328,247 From 1st Shrawan 2067 to 32nd Ashadh 2068Schedule 23Particulars This Year Rs. Previous Year Rs.1. Salary 95,070,779 51,091,7442. Allowances 71,664,907 44,489,6723. Contribution to Provident Fund 7,436,695 4,418,5354. Training Expenses 1,810,768 2,559,034 6. Medical 5,689,056 3,949,3437. Insurance 12,779,727 2,919,262 Total 255,430,285 130,336,536Annual Report 2010-1177
From 1st Shrawan 2067 to 32nd Ashadh 2068Schedule 24Particulars This Year Rs. Previous Year Rs.1. House Rent 60,747,291 45,924,035 b. Vehicles 2,022,972 1,310,829 4. Insurance 7,817,020 7,728,027 6. Office Equipment, Furniture and Repair 1,485,278 1,285,842 10. Advertisements 12,061,346 11,155,18111. Legal Expenses 1,647,527 1,553,161 a. Meeting Fees 1,684,000 1,656,000b. Other Expenses 1,961,743 2,363,994 15. Expenses relating to Audit 689,818 841,646a. Audit Fees 226,000 169,500b. Other Expenses 463,818 672,14616. Commission on Remittances - - 18. Amortization of Preliminary Expenses - -19. Share Issue expenses - 1,442,28720. Technical Services Fee 12,213,181 12,868,00121. Entertainment 465,706 401,32922. Written Off Expenses 4,324,072 1,820,03323. Security Expenses 28,772,563 21,962,841 26. Others 96,309,695 68,426,004 Total 445,072,722 343,850,26678 Annual Report 2010-11
PROVISION FOR POSSIBLE LOSSFrom 1st Shrawan 2067 to 32nd Ashadh 2068Schedule 25Particulars This Year Rs. Previous Year Rs.1. Increase in Loan Loss Provision 46,110,025 59,411,7942. Increase in Provision for Loss on Investment - -3. Provision Against Non-<strong>Bank</strong>ing Assets - 2,938,7504. Provision Against Other Assets 198,127 -Total 46,308,152 62,350,544 From 1st Shrawan 2067 to 32nd Ashadh 2068Schedule 26Particulars This Year Rs. Previous Year Rs. 4. Subsidies received from <strong>Nepal</strong> Rastra <strong>Bank</strong> - -a. Reimbursement of losses of specified branches - -b. Interest Subsidy - -c. Exchange Counter - -5. Others 375,628 331,069Total Non-Operating Income (Loss) 3,113,765 2,552,892LOSS PROVISIONS WRITTEN BACK Schedule 27Particulars This Year Rs. Previous Year Rs.1. Loan Loss Provision Written Back 176,183,408 56,621,2762. Provision against Non <strong>Bank</strong>ing Assets Written Back 2,938,7503. Investment Provision Written Back4. Provision against other Assets Written BackTotal 179,122,158 56,621,276Schedule 28 Particulars This Year Rs. Previous Year Rs.1. Recovery of Write off Loan 4,651,9632. Voluntary Retirement Scheme Expenses Total (137,672,628) (37,266,000)Annual Report 2010-1179
STATEMENT OF LOAN WRITTEN-OFF S.No. Types of Loan Written off Type of Basis of Loan Initiations made Remarksamount Rs. Security valuation of Approved by for recoverycollateral Name/Designation DRT has given Building , Personal Valuation <strong>Bank</strong> verdict in 3 Fixed Capital Loan - - - -4 Personal Loan - - - -5 Other Loan - - - -Total Loan 138,172,62880 Annual Report 2010-11
Schedule 29Name of Promoter/Director/ Outstanding up to Last Year Recovered in Current Year Additional Lending Outstanding as of Asadh end 2068Chief Executive Principal Interest Principal Interest in this year Principal Interest B. Chief Executive - - - - - - - C. Promoters - - - - - - - E. Shareholders - - - - - - - Total - - - - - - -Annual Report 2010-1181
1.1 RISK WEIGHTED ASSETS Ashadh End 2068 Ashadh End 2067a Credit Risk 25,267,759,682 20,580,286,049b Operational Risk 1,196,119,880 1,196,119,882c Market Risk 724,922,310 322,956,646Total Risk Weighted Assets (a+b+c) 27,188,801,872 22,099,362,574 Total Risk Weighted Exposures (After <strong>Bank</strong>’s Adjustment of Pillar II) 27,460,689,891 22,320,356,2001.2 CAPITAL Ashadh End 2068 Ashadh End 2067Core Capital (Tier 1) 2,834,109,205 2,430,021,234a Paid up Capital 1,869,303,258 1,653,623,877b Irredeemable Non-cumulative preference sharesc Share Premium 49,660,225d Proposed Bonus Shares 233,662,907 207,700,362 h Capital Redemption Adjustment Fund -I Capital Adjustment Fund 30,000,000 50,000,000 l Other Free Reserve - b Miscellaneous Assets Not Written Off - -c Share Investment in Licensed Institution - -d Investment in financial interested company - -e Investment exceeding the limit - -f Investments arising out of underwriting commitments -9,691,000 -9,691,000g Reciprocal crossholdings - -h OthersSupplementary Capital (Tier 2) 329,286,377 304,425,373 c Hybrid Capital Instruments - -d Pass Loan Loss Provision 213,793,432 173,583,537e Exchange Equalization Fund 10,279,125 10,200,116f Investment Adjustment Fund 25,213,820 641,720g Assets Revaluation Fund -h Other Funds - -Total Capital Fund (Tier I and Tier II) 3,163,395,582 2,734,446,6071.3 CAPITAL FUND RATIOS Ashadh End 2068 Ashadh End 2067 82 Annual Report 2010-11
A. Balance Sheet Exposures Book Value Specific Eligible CRM Net Value Risk Weight Risk Weighted Previous Yeara Provision b c d=a-b-c e Exposures Net Value Risk Weightedf=d*e Exposure “Claims On BIS, IMF, ECB, EC and on Multilateral Claims on domestic banks that meet capital Claims on domestic banks that do not meet Annual Report 2010-1183
84 Annual Report 2010-11 Claims on foreign bank incorporated in SAARC Claims Fulfilling all criterion of regulatory retail Investments in equity and other capital instruments Investments in equity and other capital instruments Other Assets-Investment in equity or regulatoryCapital Instrument issued by securities firms - - -Fictitious Assets not deducted from Tier I - - - TOTAL 47,129,754,322 839,536,539 873,590,582 45,416,627,201 22,552,593,618 37,230,290,090 18,139,346,915
B. Off Balance Sheet Exposures Gross Book Value Specific Eligible CRM Net Value Risk Weight Risk Weighted Previous Yeara Provision b c d=a-b-c e Exposures Net Value Risk Weightedf=d*e Exposure LC Commitments With Original Maturity Over Bid Bond, Performance Bond and Counter TOTAL 6,883,583,667 - 620,086,746 6,263,496,921 2,715,166,064 6,000,972,064 2,440,939,134 Annual Report 2010-1185
Credit Exposures Deposits Deposits Gold Govt.& NRB G’tee of Sec/G’tee of G’tee of G’tee Sec/G’teewith <strong>Bank</strong> with other Securities Govt. of other domestic of MDBs of Foreign Totalbanks/FI <strong>Nepal</strong> Sovereigns banks <strong>Bank</strong>s(a) (b) (c) (d) (e) (f) (g) (h) (I)Balance Sheet Exposures Claims on Other Multilateral Claims on domestic banks that meetcapital adequacy requirements - - - - -Claims on domestic banks that do notmeet capital adequacy requirements - Claims on foreign bank incorporatedin SAARC region operating with a buffer capital requirement - 86 Annual Report 2010-11
Claims Fulfilling all criterion of regulatoryretail except granularity -Claims secured by residential properties -Claims not fully secured by residentialproperties -Claims secured by residential properties Claims secured by Commercial real estate - High Risk Claims 367,035,181 - 3,745 367,038,926Investments in equity and other capitalinstruments of institutions listed inthe stock exchange -Investments in equity and other capitalinstruments of institutions not listed inthe stock exchange - Other Assets - Investments in equity orregulatory capital instruments issued bysecurities firms -Fictitious Assets not deducted from Tier I - Off Balance Sheet Exposures -Forward Foreign Exchange Contract -LC Commitments With Original Maturity ECA Rating 0-1 -ECA Rating 2 -ECA Rating 3-6 -Annual Report 2010-1187
88 Annual Report 2010-11ECA Rating 7 -LC Commitments With Original Maturity ECA Rating 0-1 -ECA Rating 2 -ECA Rating 3-6 -ECA Rating 7 -Bid Bond, Performance Bond and Counter ECA Rating 0-1 -ECA Rating 2 -ECA Rating 3-6 -ECA Rating 7 - Securities as collateral -Repurchase Agreements, Assets sale with Acceptances and Endorsements 24,006,780 24,006,780 and Securities -Irrevocable Credit commitments Irrevocable Credit commitments Other Contingent Liabilities -Total 1,034,679,110 - - 251,803,745 - - 23,253,135 - 183,941,338 1,493,677,328
Particulars Year 1 (2064/65) Year 2 (2065/66) Year 3 (2066/67) 2067 Ashadh EndNet Interest Income 515,594,968 635,745,411 826,010,718 Other Operating Income 19,557,259 52,790,137 78,796,662Exchange Fluctuation Income 51,989,275 61,294,299 70,328,247 Gross income (a) 682,986,691 617,055,007 1,092,198,065Alfa (b) 15% 15% 15%Fixed Percentage of Gross Income [c=(a×b)] 102,448,004 92,558,251 163,829,710Capital Requirement for operational risk (d) (average of c) 119,611,988 119,611,988Risk Weight (reciprocal of capital requirement of 10%) in times (e) 10 10Equivalent Risk Weight Exposure [f=(d×e)] 1,196,119,880 1,196,119,882Annual Report 2010-1189
S.No. Currency Open Position (FCY) Rate Open Position (NPR) Relevant Open Position “Relevant Open Position(2067 Ashadh End)” 3 CNY - - - - 20,9764 CHF 40 87.73 3,509 3,509 - 8 INR 854,886,376 1.60075 1,368,459,366 1,368,459,366 583,124,3589 JPY 4,459,456 0.895 3,991,213 3,991,213 4,547,905 Total Open Position (a) 1,449,844,626 645,913,292Fixed Percentage (b) 5% 5%Capital Charge for Market Risk [c=(a×b)] 72,492,231 32,295,665Risk Weight (reciprocal of capital requirement of 10%) in times (d) 10 10Equivalent Risk Weight Exposure [e=(c×d)] 724,922,310 322,956,65090 Annual Report 2010-11
Schedule 31Particulars Indicators F. Y. F. Y. F. Y. F. Y. F. Y.2063/2064 2064/2065 2065/2066 2066/2067 2067/2068 2. Earnings Per Share Rs. 39.35 28.33 36.18 23.69 24.853. Market Value per Share Rs. 1,176.00 1,511.00 1,900.00 741.00 565.00 16. Adequacy of Capital Fund on Risk Weightage Assets 20. Book Net worth Rs. 1,153,313,329 1,404,264,131 1,702,571,354 2,440,863,070 2,869,602,15021. Total Shares No. 6,477,984 8,745,278 8,745,278 16,536,239 18,693,03322. Total Staff No. 189 249 323 465 505 24. Book Value Per Share Rs. 178.04 160.57 194.68 147.61 153.51 Annual Report 2010-1191
PRINCIPAL ACCOUNTING POLICIESFOR THE YEAR ENDED 32nd ASHADH 2068(16th JULY 2011)Schedule 32i) General Information<strong>Nepal</strong> <strong>SBI</strong> <strong>Bank</strong> Limited is a limited liability public quoted company domiciled in <strong>Nepal</strong>. The registered office of the <strong>Bank</strong> is situated at Hattisar,Kathmandu, <strong>Nepal</strong>.<strong>Nepal</strong> <strong>SBI</strong> <strong>Bank</strong> Limited has become a foreign subsidiary of State <strong>Bank</strong> of India with effect from 14.06.2009.The principal activities of the <strong>Bank</strong> consist of the business of commercial banking and other financial services in <strong>Nepal</strong>. held on October 13, 2011.ii) Statement of Compliance conformity with the Companies Act 2063.iii)iv)These policies have been consistently applied to all the years presented except otherwise stated.Basis of PreparationThe Financial Statements are prepared on the historical cost basis except for foreign currency items and applied consistently with no adjustmentsbeing made for inflationary factors affecting the Financial Statements. They are presented in <strong>Nepal</strong>ese Rupees and have been rounded to thenearest Rupee.Use of Estimates, Assumptions & JudgementsThe preparation of Financial Statements requires management to make judgements, estimates and assumptions that affect the application ofpolicies and reported amount of assets and liabilities, income and expenses. Management believes that estimates used in the preparation offinancial statements are prudent and reasonable.Estimates and assumptions are reviewed on an ongoing basis. Revisions to accounting estimates are recognised in the period in which theestimate is revised and in any future period affected.v) Interest Income vi)vii)Interest income from Investments and other assets is recognised on an accrual basis.Commission and Fee IncomeCommission and fee income mainly comprises fees receivable from customers for guarantees, letter of credit and other services provided by the<strong>Bank</strong>. Such income is recognised as revenue on a cash basis at the time the services are provided.Dividend Income viii) Foreign Exchange TransactionsForeign currency assets and liabilities are translated into <strong>Nepal</strong>ese Rupees at the prevailing middle rate ruling on the Balance Sheet date.ix)Income arising from the difference between buying and selling rates of Foreign Exchange transactions are recorded on a daily basis and shown Appropriation Account.Interest ExpenseInterest payable on deposit liabilities, debenture bonds borrowings and other liabilities are accounted for on accrual basis.92 Annual Report 2010-11
x) Loans and Advances including Bills PurchasedLoans and advances including bills purchased are stated in the Balance Sheet net of provisions for loan losses. These loans and advances including bills xi)xii)Staff LoansLoans and advances granted to staff in accordance with the staff loan scheme of the <strong>Bank</strong> are shown under Other Assets.Loan Loss Provision xiii) Investments<strong>Bank</strong> has segregated its investment portfolio into following three categories:a. Held for Trading:An investment that is made for the purpose of generating a profit from short term fluctuations in price is classified under this category. An asset is classifiedas held for trading even if it is a part of a portfolio of similar assets for which there is a pattern of trading for the purpose of generating a profit from short termfluctuations in price. These investments are marked to market and differences reflected in the profit and loss account.b. Held to Maturity:The investments made with positive intent and ability of the bank to hold till maturity are classified as held to maturity investments. <strong>Bank</strong> does not have thepositive intent to hold an investment to maturity, if any of the following conditions are met:1. <strong>Bank</strong> has the intent and the ability to hold the asset for only an undefined period; or changes in market interest rates or risks, liquidity needs, changes in the availability of and the yield on alternative investments, changes in financing sourcesand terms, or changes in foreign currency risk. and loss accounts for the period.c. Available for Sale:All other investments that are neither “held for trading” nor “held to maturity” are classified under this category. These investments are marked to market on a xiv) Fixed Assets and Depreciationa. Fixed assets are stated at cost less accumulated depreciation.b. Assets with a value less than Rs 5,000 are charged off as a revenue expense in the year of purchase irrespective of their useful life.c. Fixed assets and cost on improvements and renovation of leasehold properties are depreciated at rates based upon their expected useful lives, using thestraight-line method. The estimated useful lives and depreciation rates of fixed assets are as follows:Nature of Assets Useful Life (years) Depreciation RateFurniture 5-10 20-10%Equipments 3-4 33.33-25%Vehicles 5 20%Computers 4 25%Leasehold premises 7 15%xv) Intangible Assetsa. Basis of RecognitionAn intangible asset is recognised if it is probable that the future economic benefits that are attributable to the assets will flow to the bank and the cost of theAnnual Report 2010-1193
assets can be measured reliably.b. MeasurementSoftware: Software represents the value of computer application software licensed for use of the <strong>Bank</strong>, other than software applied to the operation softwaresystem of computers. These intangible assets are carried at its cost, less accumulated amortisation and any impairment losses. These assets are included under xvi) Non-<strong>Bank</strong>ing Assets (NBAs)Non-<strong>Bank</strong>ing Assets represent properties that are acquired in full or partial satisfaction of debts.The <strong>Bank</strong> has adopted a policy of acquiring properties that are placed as collateral in full or partial satisfaction of debts as per prevailing laws and guidelines. Non-<strong>Bank</strong>ing Assets are stated net of provision for losses in the Balance Sheet.xvii) Employee BenefitsShort Term Employee BenefitThe undiscounted amount of short-term employee benefits, such as salaries, medical benefit, staff bonus etc. which are expected to be paid in exchange forthe service rendered by employees is recognised during the period when the employee renders the service.The bank offers leave encashment facility to its confirmed employees which may be encashed during the service period as per the Staff Service Rule ofthe <strong>Bank</strong> and unused leave is accumulated and paid at the time of separation from service. Provision for leave is made on accrual basis determined by themanagement as per Staff Service Rules of the <strong>Bank</strong>.Defined Contribution Plan expense when employee has rendered service to bank.<strong>Bank</strong> pays insurance premium of its permanent employee as per Staff Service Rules of the <strong>Bank</strong>. Insurance policy is in the name of a specified plan participantand bank has no legal liability to cover any loss on the policy and insurer has sole responsibility for paying the benefit. The amount of insurance premium paidis charged as expense for the period.Defined Benefit PlanPermanent employee of bank is eligible for gratuity payment on their separation from service as per Staff Service Rule of the <strong>Bank</strong>. Provision for gratuity ismade on accrual basis determined by the management as per Staff Service Rule of the <strong>Bank</strong> taking the proportion of service period served by permanent xviii) Stationery StockStationery purchased is stated at cost and charged to revenue at the time of consumption.xix) Provision for TaxationProvision for taxation has been made on the basis of the Income Tax Act 2058 and amendments thereto.xx)Deferred Tax to taxable income in the years in which those temporary differences are expected to be recovered or settled based on the laws that have been enacted orsubsequently enacted on the reporting date. xxi) Cash & Cash Equivalents 94 Annual Report 2010-11
NOTES TO ACCOUNTSFOR THE YEAR ENDED 32nd ASHADH 2068(16th JULY 2011)Schedule 331. Provision for Staff BonusProvision for staff bonus has been computed and for loan loss, non banking assets, investments andstaff bonus.2. Staff Housing FundAs the <strong>Bank</strong> has a provision for extending housing loansto the eligible staff, a separate staff housing fund has notbeen created as prescribed by the Labour Act, 2048.3. General ReserveAs required under the <strong>Bank</strong>s and Financial Institutions 4. Interest IncomeAs mentioned in our Accounting Policy, interest incomefrom loans and advances is recognized as per the <strong>Nepal</strong> option to recognize outstanding interest due on AshadhEnd 2068 collected in the month of Shrawan 2068 as Rs 7,790,128.32 due on Ashadh End 2068 butcollected in Shrawan 2068 as interest income for FY aforesaid circular.5. Exchange Fluctuation ReserveRevaluation gain arising out of exchange fluctuationduring the year is Rs 316,034. Twenty five percentof such gain amounting to Rs 79,009 has beentransferred to Exchange Fluctuation Reserve as required 6. Investment Adjustment Reserve additional investment amount under Investment Availablefor Sale category amounting to Rs 24,572,100has been transferred to Investment AdjustmentReserve. Total balance of Investment AdjustmentReserve after such transfer is Rs 25,213,820.7. Capital Adjustment ReserveThe Opening Capital Adjustment Reserve of Rs. 5 Account for the purpose of 12.5 bonus share Rs.3 crores has been transferred to Capital AdjustmentReserve from the Profit and Loss AppropriationAccount this year.8. Provision for Gratuity 23,592,647.50 on account of gratuity. A sum ofRs 493,000.00 was paid as gratuity during theyear out of the accumulated provision.9. Provision for Leave Encashment 26,447,664.75 for accrued leave encashment.10. Tax Settlement Outstanding<strong>Bank</strong> has settled the corporate tax liability up to FY2063-064 and has also received advance paymentcertificate from LTPO for excess tax paymentmade up to the end of the FY 2063-064. Forthe FY 2064-065, 2065-066 and 2066-67self assessments have been submitted toLarge Tax Payer Office for which final assessment isyet to be done.11. Income Tax and Deferred TaxProvision for income tax has been made as per theIncome Tax Laws. Accounting Standard 9- Income Taxes”.Annual Report 2010-1195
Particulars / Items Carrying Amount Tax Base Deductible Temp Diff Taxable Tem. Diff. Deferred Tax Asset Deferred Tax LiabilityFixed Assets 417,002,530 477,442,231 60,439,701 18,131,910 Provision for NBA - - - - Interest Income Treasury Bills 43,988,205 - 43,988,205 13,196,461579,593,985 491,393,401 176,267,711 43,988,205 52,880,314 13,196,461Opening Balances 26,984,687 0 Particulars Debit Credit Total 12,699,166 12,699,166 Particulars Debit Credit Total 39,683,853 39,683,85396 Annual Report 2010-11
12. Fraudulent Draft Case for recovery of Rs. 32,000,000 on account of lossincurred by the <strong>Bank</strong> due to the negligence of collecting Appellate Court was not in favor of the <strong>Bank</strong>, we have13. Reconciliation Status of Agency Accounts Outstanding as on 16.07.2011filed a leave petition with the Supreme Court. Hearing on the received Rs 9,640,625 from insurance company and banks of Rs 22,359,375 against possible loss on this account.BRANCH TOTAL < 3 MONTHS >3< 9 MONTHS 9 MONTHSEntry Net Amt Entry Net Amt Entry Net Amt Entry Net Amt The un-reconciled entries represent unpaid credit entries, net of un-reconciled debit entries outstanding. All the un-reconciledentries are identified and being followed up with the correspondent banks. They will be adjusted in due course of business.14. Summary of Loans and Advances disbursed, recovered and Principal & Interest Written-off ParticularsAmount Loans Recovered 80,624,921.90Loans Written Off 138,173.63Interest Written Off 145,842.20 15. Summary of Changes in deposit & liabilities Particulars Current Year Previous Year Changes Total 42,415,444 34,896,424 7,519,02016. Weighted Average Interest SpreadParticulars Rate %Average Rate of Return on Interest Earning Assets Average Cost on Fund Net Spread 2.8617. Particulars of Expenses yet to be Expensed-off Rs. in ‘000 Annual Report 2010-1197
18. Summary of Concentration Exposure Particulars Loans, Advances Deposits & Contingent& Bills Purchased Borrowing Liabilities Highest exposure to a single unit 275,595 13,243,490 263,465 19. None of the bank’s borrowings is against the collateral of its own assets.20. Related Party Information and Transactions20.1 Related Party Information 20.2 Related parties transactionsExpense of Rs 12,213,183.00 during the financial year has been made for the technical support provided by holding Total meeting fee paid to directors of bank for the fiscal year is Rs 1,588,000.00.20.3 Outstanding Assets with related partyTotal outstanding balances with related party as on Ashadh End 2068 is as followSN Particulars Holding Company Group Company(Excluding Holding Company)1 Outstanding Placement 12,869,032.50 427,500.002 Outstanding Agency Balance 1,578,125.59 50,066.463 Interest recognized as incomeduring the year 246,774.39 8,200.2798 Annual Report 2010-11
21. . Classification of Assets and Liabilities based on Maturity. Rs. in LacsS.N. Particulars 1-7 8-30 31-90 91-180 181-270 271-365 More than Totaldays days days days days days 1 yearAssets1 Cash Balance 10077 10077 3 Investment in Foreign <strong>Bank</strong>s 24938 1974 2138 12859 86213 4845 1329654 Call Money 0 6 <strong>Nepal</strong> Rastra <strong>Bank</strong> Bonds 8927 8927 9 Interest Receivable 8 96 418 723 583 30 1180 303810 Reverse Repo 011 Acceptance Receivable 0 13 Others 3760 1762 5521Total (A) 116223 27185 91878 56623 122131 53015 64679 531735Liabilities 18 Borrowings 0 0 0 0 0 0 0 0 Refinance 0Others 019 Other Liabilities and Provisions 5310 0 653 0 0 0 1103 7066Sundry Creditors 2,062 2062Bills Payable 807 807Interest Payable 260 260Provisions 2065 0 653 1103 3821Others 116 11620 Acceptance Liabilities 9903 990321 Irrevocable Loan Commitment 2493 6232 16204 24930 23 Repo 024 Payable under s.no.11 025 Others 0Total (B) 100516 22452 64404 36259 122270 35190 120625 501716Net Financial Assets (A-B) 15707 4733 27474 20364 -138 17825 -55945 30019Cumulative Net Financial Assets 15707 20440 47914 68278 68140 85964 30019 0 Annual Report 2010-1199
DISCLOSURE UNDER Capital Adequacy Framework 2007 (Updated July 2008)At the end of Ashadh 20681. CAPITAL STRUCTURE & CAPITAL ADEQUACY Particulars Amount Amount B Proposed Bonus Equity Share 2,336.63 E Share Premium 496.60 Total Core Capital (Tier I) 28,341.09 ParticularsAmount C Exchange Equalization Reserve 102.79 Total Supplementary Capital (Tier II) 3,292.86 Particulars Amount 6% <strong>Nepal</strong> <strong>SBI</strong> Debentures 2070 of Rs. 1,000/- eachissued on 16.07.2006 and maturing o 15.07.2013- Outstanding Amount 2,000.00- Fixed Maturity Period of 7 Years from 16.07.2006- Interest Payment - Half Yearly- At the time of liquidation, right of claims will beonly after depositors- Redeemable and Non-Convertible- Outstanding Balance of Redemption Reserve 1,428.57- Amount raised during the year Nil- Amount Eligible to be reckoned as Capital Fund 800.00100 Annual Report 2010-11
ParticularsAmountA Fictitious AssetsNilB Investment arising out of underwriting commitments 96.91 Total Qualifying Capital 31,633.95vii. Capital Adequacy Ratio future activitiesA comprehensive ICAAP document is in place in this regard. Fixed Maturity Period of 7 years Interest payment half yearly At the time of liquidation, right of claims will be only after depositors Redeemable and non convertible2. RISK EXPOSUREi. Risk Weighted Exposure for Credit Risk, Market Risk and Operational RiskParticularsAmountA Risk Weighted Exposure for Credit Risk 252,677.60B Risk Weighted Exposure for Operational Ris 11,961.20C Risk Weighted Exposure for Market Risk 7,249.22Total Risk Weighter Exposure (A+B+C) 271,888.02 Total Risk Weighted Exposures (After <strong>Bank</strong>’s Adjustment of Pillar II) 274,606.90Annual Report 2010-11101
ii.Risk Weighted Exposure under each 11 Categories of Credit RiskS.No. Categories Amount 2 Claims on Other Official Entities 1,620.983 Claims on <strong>Bank</strong>s 31,117.014 Claims on Corporate and Securities Entities 122,401.385 Claims on Regulatory Retail Portfolio 30,038.376 Claims Secured by Residential Properties 16,239.537 Claims Secured by Commercial Real Estate 3,130.62 9 High Risk Claims 10,160.0110 Other Assets 8,907.9411 Off Balance Sheet Items 27,151.66Total 252,677.60 Particulars Gross Amount Provision Net AmountA Restructured 1,399.45 464.11 935.34B Sub-standard 23.96 5.19 18.77 Total 2,393.00 1,392.26 1,000.74 NPA Ratios Percentage (%) - Net NPA to Net Advances 0.47v. Movement of Non Performing AssetsS.No. Particulars Opening Balance Closing Balance Movement(Ashadh End 2067) (Ashadh End 2068)Non Performing Loan vi Write off of loans and interest Suspense 102 Annual Report 2010-11
vii. Movement Of Loan Loss Provision and Interest SuspenseLoan Loss ProvisionS.No. Particulars Opening Balance Closing Balance Movement(Ashadh End 2067) (Ashadh End 2068)1 Pass 1,735.84 2,137.93 402.09 Total Loan Loss Provision 4,830.94 3,530.19 (1,300.75)Interest SuspenseS.No. Particulars Opening Balance Closing Balance Movement(Ashadh End 2067) (Ashadh End 2068) S.No. Particulars Ashadh End 20681 Pass 402.09 Total (1,300.75) other categories are as follows:Annual Report 2010-11103
A. Investment Held to MaturityCost Price (a) Impairment Impairment This Year Previous RemarksS.No. Particulars Rs. Till Date (b) Rs. (c) Rs. Profit /Loss Year Profit /(a-b-c) Rs. Loss Rs. Total Investment 188,713.76 - - - -B. Investment Available for SaleCost Price (a) Impairment Impairment This Year Previous RemarksS.No. Particulars Rs. Till Date (b) Rs. (c) Rs. Profit /Loss Year Profit /(a-b-c) Rs. Loss Rs.1 Listed 96.91 102.27 100.02 - - *Not Listed 299.56 - - - - **Total Investment 396.47 102.27 100.02 - -Note:* Even though the current market price is higher than the cost price we have not marked these securities to market because the volume of transaction on these securities is very low. National <strong>Bank</strong>ing Training Institute104 Annual Report 2010-11
3. RISK MANAGEMENT FUNCTIONi. Strategies and PoliciesCredit risk process is a joint effort between its marketing and credit areas. Credit officers are a facility that simultaneously accommodates the financing needs, while assuring seniority, ii.The Structure and Organization of the Relevant Risk Management Function to approval discretions. Further policy manuals on credit, risk management and operations arealso available to guide the staff on day to day business. reviews and at meetings at various levels.v. Eligible CRMParticularsEligible CRM Total 14,936.77Annual Report 2010-11105
Schedule 34S.No Name of the Promoter/Promoter Shares Held by Promoters Particulars Of the Loan RemarksGroup ShareholdersTotal Number Percentage Of Name of theOf Shares the Total Paid Lending <strong>Bank</strong>/ Loan Amount Number Of SharesUp Capital Financial Institution Pledged 106 Annual Report 2010-11
Corporate Office, Hattisar, Kathmandu Schedule 35S. N. Particulars As per Unaudited As per Audited Variance Reason forFinancial Statement Financial Statement Varianceas on 16.07.2011 as on 16.07.2011 In Amount In %A B C=B-A D=C/A% 1.4 Borrowings - - - 1.6 Income Tax Liability - - - 2.2 Money at Call and Short Notice - - - 3 Profit and Loss Account - Annual Report 2010-11107
This Quarter Ending Previous Quarter Corresponding PreviousS. N. Particulars as on 32.03.2068 Ending as on as on Year Quarter Ending as on(16.07.2011) 30.12.2067 32.03.2067 (16.07.2010)Unaudited (13.04.2011) AuditedUnaudited 1.2 Reserve and surplus 1,103,455 955,844 589,230 1.4 Borrowings - 370,965 - b. Foreign Currency 13,511,246 12,963,246 12,206,4661.6 Income Tax Liability - - -1.7 Other Liablities 500,032 768,943 500,701 2.1 Cash and <strong>Bank</strong> Balance 4,877,826 4,632,087 3,441,2612.2 Money at Call and Short Notice - 360,000 -2.3 Investments 18,911,022 17,579,756 16,305,633 a. Real Estate Loan 1,733,730 1,701,478 1,428,777 3. Income generating Commercial Complex Loan - - - b. Personal Home Loan of Rs. 80 Lacs or Less 2,108,451 2,121,468 1,982,987c. Margin Type Loan 2,074 6,116 14,798d. Term Loan 1,059,183 964,058 908,772 f. Others 4,240,928 4,250,328 3,725,069 2.7 Other Assets 516,613 618,382 401,992108 Annual Report 2010-11
This Quarter Previous Quarter Corresponding PreviousEnding as on Ending as on as on Year Quarter Ending as on3 Profit and Loss Account 32.03.2068 30.12.2067 32.03.2067 3.1 Interest Income 3,104,232 2,193,717 2,269,7043.2 Interest Expenses 2,096,038 1,512,381 1,443,694 3.4 Other Operating Income 95,173 69,638 78,797 3.6 Staff Expenses 255,430 169,782 130,3373.7 Other Operating Expenses 445,073 305,594 343,850 3.8 Provision for Possible Losses 46,308 43,605 62,351 3.10 Write Back of Provision for Possible Loss* 179,122 169,003 56,621 3.12 Provision for Staff Bonus 65,347 45,221 53,8363.13 Provision for Tax 188,904 130,735 146,620 4 Ratios At the End of this At the End of At the End ofQuarter Previous Quarter Corresponding PreviousYear Quarter Additional Information Annual Report 2010-11109
110 Annual Report 2010-11
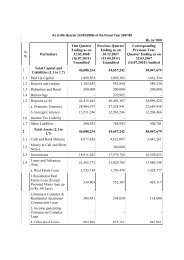

![g]kfn P;lacfO{a}+s ln= sf] k|a Gwkq - Nepal SBI Bank Ltd.](https://img.yumpu.com/49519372/1/158x260/gkfn-placfoa-s-ln-sf-k-a-gwkq-nepal-sbi-bank-ltd.jpg?quality=85)