OUTLOOK - Grow Wellington
OUTLOOK - Grow Wellington
OUTLOOK - Grow Wellington

Create successful ePaper yourself
Turn your PDF publications into a flip-book with our unique Google optimized e-Paper software.
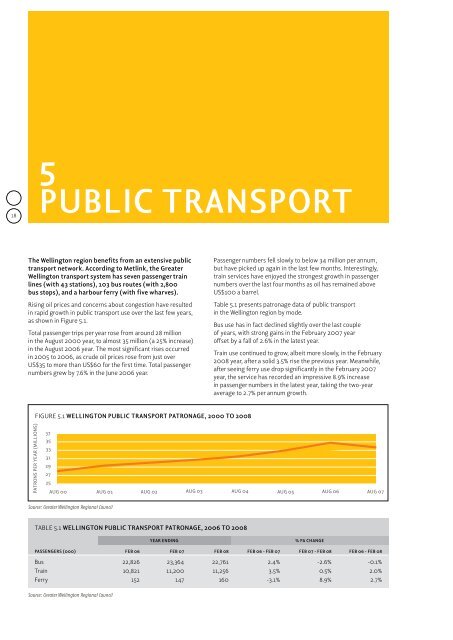
185Public transportThe <strong>Wellington</strong> region benefits from an extensive publictransport network. According to Metlink, the Greater<strong>Wellington</strong> transport system has seven passenger trainlines (with 43 stations), 103 bus routes (with 2,800bus stops), and a harbour ferry (with five wharves).Rising oil prices and concerns about congestion have resultedin rapid growth in public transport use over the last few years,as shown in Figure 5.1.Total passenger trips per year rose from around 28 millionin the August 2000 year, to almost 35 million (a 25% increase)in the August 2006 year. The most significant rises occurredin 2005 to 2006, as crude oil prices rose from just overUS$35 to more than US$60 for the first time. Total passengernumbers grew by 7.6% in the June 2006 year.Passenger numbers fell slowly to below 34 million per annum,but have picked up again in the last few months. Interestingly,train services have enjoyed the strongest growth in passengernumbers over the last four months as oil has remained aboveUS$100 a barrel.Table 5.1 presents patronage data of public transportin the <strong>Wellington</strong> region by mode.Bus use has in fact declined slightly over the last coupleof years, with strong gains in the February 2007 yearoffset by a fall of 2.6% in the latest year.Train use continued to grow, albeit more slowly, in the February2008 year, after a solid 3.5% rise the previous year. Meanwhile,after seeing ferry use drop significantly in the February 2007year, the service has recorded an impressive 8.9% increasein passenger numbers in the latest year, taking the two-yearaverage to 2.7% per annum growth.Figure 5.1 <strong>Wellington</strong> public transport patronage, 2000 to 2008PATRONS PER YEAR (MILLIONS)37353331292725AUG 00 AUG 01 AUG 02 AUG 03 AUG 04 AUG 05 AUG 06AUG 07Source: Greater <strong>Wellington</strong> Regional CouncilTable 5.1 <strong>Wellington</strong> public transport patronage, 2006 to 2008Year ending% pa changePassengers (000)Feb 06 Feb 07 Feb 08 Feb 06 - Feb 07 Feb 07 - Feb 08 Feb 06 - Feb 08Bus 22,826 23,364 22,761 2.4% -2.6% -0.1%Train 10,821 11,200 11,256 3.5% 0.5% 2.0%Ferry 152 147 160 -3.1% 8.9% 2.7%Source: Greater <strong>Wellington</strong> Regional Council