Fact Sheet for the month of Sep-08 - HDFC Mutual Fund
Fact Sheet for the month of Sep-08 - HDFC Mutual Fund
Fact Sheet for the month of Sep-08 - HDFC Mutual Fund
- No tags were found...
Create successful ePaper yourself
Turn your PDF publications into a flip-book with our unique Google optimized e-Paper software.
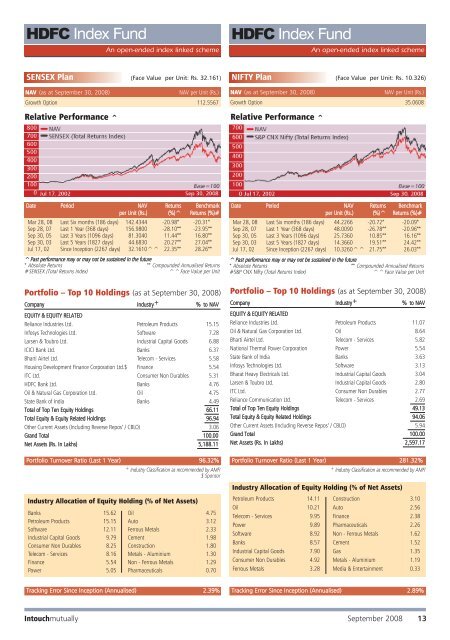
hdfc-eq-r.qxd 10/8/20<strong>08</strong> 4:18 PM Page 4<strong>HDFC</strong> Index <strong>Fund</strong>An open-ended index linked scheme<strong>HDFC</strong> Index <strong>Fund</strong>An open-ended index linked schemeSENSEX Plan (Face Value per Unit: Rs. 32.161)NAV (as at <strong>Sep</strong>tember 30, 20<strong>08</strong>)NAV per Unit (Rs.)Growth Option 112.5567Relative Per<strong>for</strong>mance ^NIFTY Plan (Face Value per Unit: Rs. 10.326)NAV (as at <strong>Sep</strong>tember 30, 20<strong>08</strong>)NAV per Unit (Rs.)Growth Option 35.06<strong>08</strong>Relative Per<strong>for</strong>mance ^Date Period NAV Returns Benchmarkper Unit (Rs.) (%)^ Returns (%)#Mar 28, <strong>08</strong> Last Six <strong>month</strong>s (186 days) 142.4344 -20.98* -20.31*<strong>Sep</strong> 28, 07 Last 1 Year (368 days) 156.9800 -28.10** -23.95**<strong>Sep</strong> 30, 05 Last 3 Years (1096 days) 81.3040 11.44** 16.80**<strong>Sep</strong> 30, 03 Last 5 Years (1827 days) 44.6830 20.27** 27.04**Jul 17, 02 Since Inception (2267 days) 32.1610^^ 22.35** 28.26**^Past per<strong>for</strong>mance may or may not be sustained in <strong>the</strong> future* Absolute Returns ** Compounded Annualised Returns#SENSEX (Total Returns Index)^^Face Value per UnitPortfolio – Top 10 Holdings (as at <strong>Sep</strong>tember 30, 20<strong>08</strong>)Company Industry + % to NAVEQUITY & EQUITY RELATEDReliance Industries Ltd. Petroleum Products 15.15Infosys Technologies Ltd. S<strong>of</strong>tware 7.28Larsen & Toubro Ltd. Industrial Capital Goods 6.88ICICI Bank Ltd. Banks 6.37Bharti Airtel Ltd. Telecom - Services 5.58Housing Development Finance Corporation Ltd.$ Finance 5.54ITC Ltd. Consumer Non Durables 5.31<strong>HDFC</strong> Bank Ltd. Banks 4.76Oil & Natural Gas Corporation Ltd. Oil 4.75State Bank <strong>of</strong> India Banks 4.49Total <strong>of</strong> Top Ten Equity Holdings 66.11Total Equity & Equity Related Holdings 96.94O<strong>the</strong>r Current Assets (Including Reverse Repos’ / CBLO) 3.06Grand Total 100.00Net Assets (Rs. In Lakhs) 5,188.11Date Period NAV Returns Benchmarkper Unit (Rs.) (%)^ Returns (%)#Mar 28, <strong>08</strong> Last Six <strong>month</strong>s (186 days) 44.2266 -20.72* -20.09*<strong>Sep</strong> 28, 07 Last 1 Year (368 days) 48.0090 -26.78** -20.96**<strong>Sep</strong> 30, 05 Last 3 Years (1096 days) 25.7360 10.85** 16.16**<strong>Sep</strong> 30, 03 Last 5 Years (1827 days) 14.3660 19.51** 24.42**Jul 17, 02 Since Inception (2267 days) 10.3260^^ 21.75** 26.03**^Past per<strong>for</strong>mance may or may not be sustained in <strong>the</strong> future* Absolute Returns ** Compounded Annualised Returns#S&P CNX Nifty (Total Returns Index)^^Face Value per UnitPortfolio – Top 10 Holdings (as at <strong>Sep</strong>tember 30, 20<strong>08</strong>)Company Industry + % to NAVEQUITY & EQUITY RELATEDReliance Industries Ltd. Petroleum Products 11.07Oil & Natural Gas Corporation Ltd. Oil 8.64Bharti Airtel Ltd. Telecom - Services 5.82National Thermal Power Corporation Power 5.54State Bank <strong>of</strong> India Banks 3.63Infosys Technologies Ltd. S<strong>of</strong>tware 3.13Bharat Heavy Electricals Ltd. Industrial Capital Goods 3.04Larsen & Toubro Ltd. Industrial Capital Goods 2.80ITC Ltd. Consumer Non Durables 2.77Reliance Communication Ltd. Telecom - Services 2.69Total <strong>of</strong> Top Ten Equity Holdings 49.13Total Equity & Equity Related Holdings 94.06O<strong>the</strong>r Current Assets (Including Reverse Repos’ / CBLO) 5.94Grand Total 100.00Net Assets (Rs. In Lakhs) 2,597.17Portfolio Turnover Ratio (Last 1 Year) 96.32%+ Industry Classification as recommended by AMFI$ SponsorPortfolio Turnover Ratio (Last 1 Year) 281.32%+ Industry Classification as recommended by AMFIIndustry Allocation <strong>of</strong> Equity Holding (% <strong>of</strong> Net Assets)Industry Allocation <strong>of</strong> Equity Holding (% <strong>of</strong> Net Assets) Petroleum Products 14.11 Construction 3.10Oil 10.21 Auto 2.56Banks 15.62 Oil 4.75Telecom - Services 9.95 Finance 2.38Petroleum Products 15.15 Auto 3.12Power 9.89 Pharmaceuticals 2.26S<strong>of</strong>tware 12.11 Ferrous Metals 2.33S<strong>of</strong>tware 8.92 Non - Ferrous Metals 1.62Industrial Capital Goods 9.79 Cement 1.98Banks 8.57 Cement 1.52Consumer Non Durables 8.25 Construction 1.80Telecom - Services 8.16 Metals - Aluminium 1.30Industrial Capital Goods 7.90 Gas 1.35Finance 5.54 Non - Ferrous Metals 1.29 Consumer Non Durables 4.92 Metals - Aluminium 1.19Power 5.05 Pharmaceuticals 0.70 Ferrous Metals 3.28 Media & Entertainment 0.33Tracking Error Since Inception (Annualised) 2.39% Tracking Error Since Inception (Annualised) 2.89%Intouchmutually<strong>Sep</strong>tember 20<strong>08</strong> 13


