Fact Sheet for the month of Sep-08 - HDFC Mutual Fund
Fact Sheet for the month of Sep-08 - HDFC Mutual Fund
Fact Sheet for the month of Sep-08 - HDFC Mutual Fund
- No tags were found...

Create successful ePaper yourself
Turn your PDF publications into a flip-book with our unique Google optimized e-Paper software.
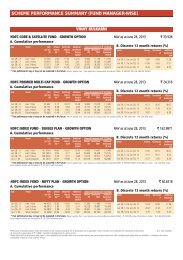
hdfc-eq-r.qxd 10/8/20<strong>08</strong> 4:18 PM Page 6<strong>HDFC</strong> Balanced <strong>Fund</strong>An open-ended balanced schemeNAV (as at <strong>Sep</strong>tember 30, 20<strong>08</strong>)NAV per Unit (Rs.)Growth Plan 31.826Dividend Plan 16.022Relative Per<strong>for</strong>mance ^ (Growth Plan)<strong>HDFC</strong>Prudence <strong>Fund</strong>NAV (as at <strong>Sep</strong>tember 30, 20<strong>08</strong>)An open-ended balanced schemeNAV per Unit (Rs.)Growth Plan 114.111Dividend Plan 23.049Relative Per<strong>for</strong>mance ^ (Growth Plan)IN HYBRID EQUITY - ORIENTED CATEGORY(27 schemes) <strong>for</strong> 3 and 5 yearperiods ending <strong>Sep</strong>tember 30, 20<strong>08</strong>Date Period NAV Returns Benchmarkper Unit (Rs.) (%)^ Returns (%)#Mar 28, <strong>08</strong> Last Six Months (186 days) 34.823 -8.61* -13.42*<strong>Sep</strong> 28, 07 Last 1 Year (368 days) 35.006 -9.01** -12.37**<strong>Sep</strong> 30, 05 Last 3 Years (1096 days) 24.196 9.56** 11.16**<strong>Sep</strong> 30, 03 Last 5 Years (1827 days) 14.167 17.55** 15.60**<strong>Sep</strong> 11, 00 Since Inception (2941 days) 10.000 15.45** N.A.^Past per<strong>for</strong>mance may or may not be sustained in <strong>the</strong> futurePer<strong>for</strong>mance <strong>of</strong> <strong>the</strong> Dividend Plan <strong>for</strong> <strong>the</strong> investor would be net <strong>of</strong> Distribution Tax as applicable* Absolute Returns ** Compounded Annualised ReturnsN.A. Not Available#CRISIL Balanced <strong>Fund</strong> IndexPortfolio – Top Holdings (as at <strong>Sep</strong>tember 30, 20<strong>08</strong>)Company / Issuer Industry + / Rating % to NAVEQUITY & EQUITY RELATEDReliance Industries Ltd. Petroleum Products 5.99Coromandel Fertilisers Ltd. Fertilisers 5.46Sun Pharmaceutical Industries Ltd. Pharmaceuticals 4.41The Federal Bank Ltd. Banks 4.07ITC Ltd. Consumer Non Durables 3.45Balkrishna Industries Ltd. Auto Ancillaries 3.22Larsen & Toubro Ltd. Industrial Capital Goods 3.13Crompton Greaves Ltd. Industrial Capital Goods 3.00ICICI Bank Ltd. Banks 2.92Mo<strong>the</strong>rson Sumi Systems Ltd. Auto Ancillaries 2.91Total <strong>of</strong> Top Ten Equity Holdings 38.56Total Equity & Equity Related Holdings 66.83Debt / Money Market InstrumentPower Finance Corporation Ltd. AAA 4.94L & T Finance Ltd. AA+ 4.91Housing Development Finance Corporation Ltd.$ AAA 4.65Loan Securitisation Trust (Grasim Industries Ltd.) AAA(SO) 4.49Credit Asset Trust XVII (Shriram Transport Finance) AA(SO) 3.91Loan Securitisation Trust (Bajaj Auto Ltd.) AAA(SO) 3.66State Bank <strong>of</strong> India AAA 2.33Loan Securitisation Trust (Reliance Industries Ltd.) AAA(SO) 0.99Total Debt / Money Market Instrument(aggregated holdings in a single issuer) 29.88O<strong>the</strong>r Current Assets (Including Reverse Repos’ / CBLO) 3.29Grand Total 100.00Net Assets (Rs. In Lakhs) 10,092.64Portfolio Turnover Ratio (Last 1 Year) 47.83%+ Industry Classification as recommended by AMFI $ SponsorIndustry Allocation <strong>of</strong> Equity Holding (% <strong>of</strong> Net Assets)Industrial Capital Goods 10.44Banks 9.05Pharmaceuticals 8.99Auto Ancillaries 7.36Petroleum Products 5.99Fertilisers 5.46S<strong>of</strong>tware 4.75Consumer Non Durables 4.67Telecom - Services 2.33Power 2.25Construction 1.97Consumer Durables 1.87Chemicals 1.70Date Period NAV Returns Benchmarkper Unit (Rs.) (%)$$^ Returns (%)#Mar 28, <strong>08</strong> Last Six Months (186 days) 129.872 -12.14* -13.42*<strong>Sep</strong> 28, 07 Last 1 Year (368 days) 136.239 -16.12** -12.37**<strong>Sep</strong> 30, 05 Last 3 Years (1096 days) 78.009 13.5** 11.16**<strong>Sep</strong> 30, 03 Last 5 Years (1827 days) 37.575 24.85** 15.6**<strong>Sep</strong> 30, 98 Last 10 Years (3653 days) 10.460 26.97** N.A.Feb 01, 94 Since Inception (5355 days) 10.000 20.13** N.A.^Past per<strong>for</strong>mance may or may not be sustained in <strong>the</strong> futurePer<strong>for</strong>mance <strong>of</strong> <strong>the</strong> Dividend Plan <strong>for</strong> <strong>the</strong> investor would be net <strong>of</strong> Distribution Tax as applicable* Absolute Returns ** Compounded Annualised Returns #CRISIL Balanced <strong>Fund</strong> Index$$ Adjusted <strong>for</strong> <strong>the</strong> dividends declared under <strong>the</strong> scheme prior to its splittng into <strong>the</strong> Dividendand Growth PlansN.A. Not AvailablePortfolio – Top 10 Holdings (as at <strong>Sep</strong>tember 30, 20<strong>08</strong>)Company / Issuer Industry + / Rating % to NAVEQUITY & EQUITY RELATEDICICI Bank Ltd. Banks 4.90Oil & Natural Gas Corporation Ltd. Oil 3.98AIA Engineering Ltd. Industrial Capital Goods 3.04Crompton Greaves Ltd. Industrial Capital Goods 2.86Punj Lloyd Ltd. Construction 2.77GlaxoSmithkline Consumer Healthcare Consumer Non Durables 2.62Apollo Tyres Ltd. Auto Ancillaries 2.53State Bank <strong>of</strong> India Banks 2.49Bank <strong>of</strong> Baroda Banks 2.46United Phosphorus Ltd. Pesticides 2.31Total <strong>of</strong> Top Ten Equity Holdings 29.96Total Equity & Equity Related Holdings 75.02Debt / Money Market Instrument / Government SecuritiesNational Bank <strong>for</strong> Agriculture & Rural Development AAA 3.86Housing Development Finance Corporation Ltd.$ AAA 3.71Indian Railways Finance Corporation Ltd. AAA 2.95State Bank <strong>of</strong> India AAA 2.37Government Securities SOV 2.33Power Finance Corporation Ltd. AAA 2.19Axis Bank Ltd. AAA(I) 1.25Infrastructure Dev. Fin. Corp. Ltd. AAA/AAA(I) 1.01Sundaram Finance Ltd. LAA+ 0.84Punjab National Bank AAA 0.77Total <strong>of</strong> Top Ten Debt / Money Market Instrument / Government Securities(aggregated holdings in a single issuer) 21.28Total Debt / Money Market Instrument / Government Securities 25.18O<strong>the</strong>r Current Assets (Including Reverse Repos’ / CBLO) (0.20)Grand Total 100.00Net Assets (Rs. In Lakhs) 237,975.52Portfolio Turnover Ratio (Last 1 Year) 66.37%+ Industry Classification as recommended by AMFI $ Sponsor✤ Past per<strong>for</strong>mance is no guarantee <strong>of</strong> future results.♓ Please refer to page no 31 <strong>for</strong> details on <strong>the</strong> Rating MethodologyIndustry Allocation <strong>of</strong> Equity Holding (% <strong>of</strong> Net Assets)Banks 14.20Industrial Capital Goods 9.13Consumer Non Durables 8.47Pharmaceuticals 7.95Media & Entertainment 5.57Construction 5.30Auto Ancillaries 4.40Oil 3.98Industrial Products 3.35Pesticides 2.31Petroleum Products 1.71Auto 1.47Power 1.42Textile Products 1.33Paper Products 1.07Chemicals 1.05Trading 1.05Textiles - Silk 0.50S<strong>of</strong>tware 0.28Ferrous Metals 0.20Finance 0.16Textiles - Syn<strong>the</strong>tic 0.12Intouchmutually<strong>Sep</strong>tember 20<strong>08</strong> 15