Fact Sheet for the month of Sep-08 - HDFC Mutual Fund
Fact Sheet for the month of Sep-08 - HDFC Mutual Fund
Fact Sheet for the month of Sep-08 - HDFC Mutual Fund
- No tags were found...
Create successful ePaper yourself
Turn your PDF publications into a flip-book with our unique Google optimized e-Paper software.
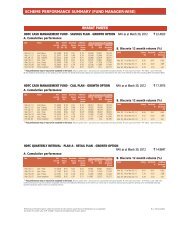
hdfc-dt.qxd 10/8/20<strong>08</strong> 4:16 PM Page 1<strong>HDFC</strong> MF MIP -Short Term PlanPortfolio – Top 10 Holdings (as at <strong>Sep</strong>tember 30, 20<strong>08</strong>)Company / Issuer Industry + / Rating % to NAVEQUITY & EQUITY RELATEDCrompton Greaves Ltd. Industrial Capital Goods 1.64Oil & Natural Gas Corporation Ltd. Oil 1.06ICICI Bank Ltd. Banks 1.04T. V. Today Network Ltd. Media & Entertainment 0.96ITC Ltd. Consumer Non Durables 0.96Jagran Prakashan Ltd. Media & Entertainment 0.91Amtek Auto Ltd. Auto Ancillaries 0.85Pidilite Industries Ltd. Consumer Non Durables 0.80Blue Star Ltd. Consumer Durables 0.74Procter & Gamble Hygiene & Healthcare Consumer Non Durables 0.71Total <strong>of</strong> Top Ten Equity Holdings 9.67Total Equity & Equity Related Holdings 13.25Debt / Money Market InstrumentHousing Development Finance Corporation Ltd.$ AAA 20.59Auto Securitisation Trust Mixed Pool A AAA(SO) 7.50Shriram Transport Finance Co. Ltd. AA(I) 6.66UBL Trust Series 61 P1+(SO) 6.18Credit Asset Trust XLIX F1+ (IND) (SO) 5.27Dr Reddy’s Holding Pvt Ltd. P1+ 5.15Indian Oil Corporation Ltd LAA+ 5.11Kotak Mahindra Prime Ltd. P1+ 5.04ILSS 1 Trust 2009 AAA(SO) 4.82Oriental Bank <strong>of</strong> Commerce P1+ 4.57Total <strong>of</strong> Top Ten Debt / Money Market Instrument(aggregated holdings in a single issuer) 70.89Total Debt/ Money Market Instrument 80.90O<strong>the</strong>r Current Assets (Including Reverse Repos’ / CBLO) 5.85Grand Total 100.00Net Assets (Rs. In Lakhs) 9,762.12Average Portfolio MaturityModified Duration (Debt Instruments)An open-ended income scheme. Monthly income is not assured and issubject to availability <strong>of</strong> distributable surplusNAV (as at <strong>Sep</strong>tember 30, 20<strong>08</strong>)NAV per Unit (Rs.)Growth Option 13.4556Monthly Dividend Option 9.8420Quarterly Dividend Option 10.0915Relative Per<strong>for</strong>mance^(Growth Option)Date Period NAV Returns Benchmarkper Unit (Rs.) (%)^ Returns (%)#Mar 28, <strong>08</strong> Last Six Months (186 days) 13.5938 -1.02* -3.<strong>08</strong>*<strong>Sep</strong> 28, 07 Last 1 Year (368 days) 13.4927 -0.27** 0.18**<strong>Sep</strong> 30, 05 Last 3 Years (1096 days) 11.9540 4.02** 6.19**Dec 26, 03 Since Inception (1740 days) 10.0000 6.42** 5.93**^Past Per<strong>for</strong>mance may or may not be sustained in <strong>the</strong> futurePer<strong>for</strong>mance <strong>of</strong> <strong>the</strong> Dividend Option <strong>for</strong> <strong>the</strong> investor would be net <strong>of</strong> Distribution Tax as applicable* Absolute Returns ** Compounded Annualised Returns #Crisil MIP Blended Index1.74 years (o<strong>the</strong>r than equity investments)280 days<strong>HDFC</strong> MF MIP -Long Term PlanNAV (as at <strong>Sep</strong>tember 30, 20<strong>08</strong>)NAV per Unit (Rs.)Growth Option 15.7371Monthly Dividend Option 10.5636Quarterly Dividend Option 10.7635Relative Per<strong>for</strong>mance^(Growth Option)Date Period NAV Returns Benchmarkper Unit (Rs.) (%)^ Returns (%)#Mar 28, <strong>08</strong> Last Six Months (186 days) 16.1950 -2.83* -3.<strong>08</strong>*<strong>Sep</strong> 28, 07 Last 1 Year (368 days) 16.1139 -2.32** 0.18**<strong>Sep</strong> 30, 05 Last 3 Years (1096 days) 12.5250 7.90** 6.19**Dec 26, 03 Since Inception (1740 days) 10.0000 9.98** 5.93**^Past Per<strong>for</strong>mance may or may not be sustained in <strong>the</strong> futurePer<strong>for</strong>mance <strong>of</strong> <strong>the</strong> Dividend Option <strong>for</strong> <strong>the</strong> investor would be net <strong>of</strong> Distribution Tax as applicable* Absolute Returns ** Compounded Annualised Returns #Crisil MIP Blended IndexPortfolio – Top 10 Holdings (as at <strong>Sep</strong>tember 30, 20<strong>08</strong>)Company / Issuer Industry + / Rating % to NAVEQUITY & EQUITY RELATEDState Bank <strong>of</strong> India Banks 1.94Oil & Natural Gas Corporation Ltd. Oil 1.83ICICI Bank Ltd. Banks 1.66The Federal Bank Ltd. Banks 1.27Punj Lloyd Ltd. Construction 1.27Britannia Industries Ltd. Consumer Non Durables 1.20Crompton Greaves Ltd. Industrial Capital Goods 1.17Page Industries Ltd. Textile Products 0.99United Phosphorus Ltd. Pesticides 0.83GlaxoSmithkline Consumer Healthcare Consumer Non Durables 0.83Total <strong>of</strong> Top Ten Equity Holdings 12.99Total Equity & Equity Related Holdings 24.10Debt / Money Market InstrumentTata Sons Ltd. AAA 7.17Power Finance Corporation Ltd. AAA 6.83Indian Railways Finance Corporation Ltd. AAA 4.88Sundaram Finance Ltd. AA+/LAA+ 4.00Rural Electrification Corporation Ltd. AAA 3.63National Bank <strong>for</strong> Agriculture & Rural Development AAA 3.06Tata Steel Ltd. AAA 2.97Infrastructure Dev. Fin. Corp. Ltd. AAA(I)/LAAA 2.71ICICI Bank Ltd. A1+/AAA 2.67Citicorp Maruti Finance Ltd. AAA 2.64Total <strong>of</strong> Top Ten Debt / Money Market Instrument(aggregated holdings in a single issuer) 40.56Total Debt / Money Market Instrument Instrument 73.47O<strong>the</strong>r Current Assets (Including Reverse Repos’ / CBLO) 2.43Grand Total 100.00Net Assets (Rs. In Lakhs) 112,915.29Average Portfolio MaturityModified Duration (Debt Instruments)An open-ended income scheme. Monthly income is not assured and issubject to availability <strong>of</strong> distributable surplus3.67 years (o<strong>the</strong>r than equity investments)2.41 years+ Industry Classification as recommended by AMFI,+ Industry Classification as recommended by AMFI$ SponsorIntouchmutually <strong>Sep</strong>tember 20<strong>08</strong> 21


