Transmission Network Performance Report 2005 - National Grid
Transmission Network Performance Report 2005 - National Grid
Transmission Network Performance Report 2005 - National Grid
- No tags were found...

Create successful ePaper yourself
Turn your PDF publications into a flip-book with our unique Google optimized e-Paper software.
<strong>National</strong> <strong>Grid</strong> <strong>Performance</strong> <strong>Report</strong>i
Northeast <strong>Transmission</strong><strong>Network</strong> <strong>Performance</strong> <strong>Report</strong>Fiscal Year <strong>2005</strong><strong>National</strong> <strong>Grid</strong> <strong>Performance</strong> <strong>Report</strong>iii
FY<strong>2005</strong>ContentsCONTENTS<strong>Transmission</strong> Reliability Page 4<strong>Transmission</strong> and Customers Page 16Developments Page 24HVDC Page 32Feedback and Additional Information Page 36
WelcomeFY<strong>2005</strong>FY<strong>2005</strong> <strong>Transmission</strong> Reliability <strong>Performance</strong> <strong>Report</strong>This report has been prepared for <strong>National</strong> <strong>Grid</strong>’s customers and other interestedparties. The intention of this report is to provide its recipients information on <strong>National</strong><strong>Grid</strong>’s transmission reliability performance for Fiscal Year <strong>2005</strong> (April 1, 2004 throughMarch 31, <strong>2005</strong>). <strong>Performance</strong> trends over the previous years have also beenprovided.<strong>National</strong> <strong>Grid</strong>, through its operating subsidiary companies, owns and operatestransmission assets in New England (in Massachusetts, Rhode Island and NewHampshire) and New York. In terms of this report, transmission is considered toconsist of <strong>National</strong> <strong>Grid</strong> assets, operating at 69,000V and above in New England and115,000V and above in New York, in these States only. This report providesinformation about the performance of <strong>National</strong> <strong>Grid</strong>’s transmission system.<strong>National</strong> <strong>Grid</strong> USA is a registered public utility holding company headquartered in Westborough,Massachusetts. <strong>National</strong> <strong>Grid</strong> USA does not directly own or operate any facilities for the transmissionor distribution of electricity; rather, such facilities are owned and/or operated directly by <strong>National</strong> <strong>Grid</strong>USA operating subsidiary companies. However, for ease of reference and for the convenience of thereader, the terms “<strong>National</strong> <strong>Grid</strong>” or “Company” shall be used in this document to refer to thetransmission facilities and assets owned and/or operated by one or more of the subsidiary companiesof <strong>National</strong> <strong>Grid</strong> USA.This document is made available with the expressed understanding that neither <strong>National</strong> <strong>Grid</strong> USAnor any of its affiliates, officers, directors, employees or agents assumes or makes any representationwith respect to the contents, accuracy or completeness of this document. No part of this documentmay be copied, reprinted or reproduced without the permission of <strong>National</strong> <strong>Grid</strong> USA.© Copyright <strong>National</strong> <strong>Grid</strong> <strong>2005</strong>2 <strong>National</strong> <strong>Grid</strong> <strong>Performance</strong> <strong>Report</strong>
FY<strong>2005</strong><strong>Transmission</strong> Reliability<strong>Transmission</strong> Reliability<strong>National</strong> <strong>Grid</strong> <strong>Performance</strong> <strong>Report</strong> 3
<strong>Transmission</strong> ReliabilityFY<strong>2005</strong>1 TRANSMISSION RELIABILITYThis report has been produced principally for <strong>National</strong> <strong>Grid</strong>’s transmissioncustomers following positive feedback on documents from prior years.1.1 DefinitionThe North American Electric Reliability Council (NERC) defines reliability as “thedegree to which the performance of the elements of the system result in powerbeing delivered to customers within accepted standards and in the amountdesired”. This definition contains the concepts of adequacy and security. UsingNERC definitions again, adequacy is “the ability of the system to supply theaggregate power and energy requirements of the consumers at all times” andsecurity is “the ability of the system to withstand sudden disturbances”.<strong>Transmission</strong> failures cause only a small percentage of power outages, yet, aresignificant in their impact on customers. This report provides information on thevarious metrics that we use to monitor and improve performance of ourtransmission system. These metrics measure reliability of the transmissionsystem and consequently, the impact on customers.1.2 Key MessageOverall, system performance in FY<strong>2005</strong> is similar to our 5year average. Although we have experienced a greaternumber of outages (compared to FY2004), generally theimpact of those outages on customers was less severe,reflecting better performance.This performance in FY<strong>2005</strong> includes above averagelightning activity which is a significant performancedriver.4 <strong>National</strong> <strong>Grid</strong> <strong>Performance</strong> <strong>Report</strong>
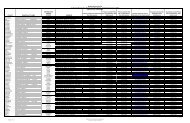
FY<strong>2005</strong><strong>Transmission</strong> Reliability1.3 <strong>Performance</strong> SummaryThe following table summarizes <strong>National</strong> <strong>Grid</strong> <strong>Transmission</strong> System reliabilityperformance in FY<strong>2005</strong> compared to FY2004 and the 5 year Average.Table 1-1: FY<strong>2005</strong> Reliability <strong>Performance</strong>Reliability CheckFY<strong>2005</strong> vs.FY2004FY<strong>2005</strong> vs. Five Yeartotal number of outages Up by 17% In Line with 5 year averagenumber of momentary outages Up by 24% In Line With 5 year averagenumber of sustained outages Up by 3% Worse than 5 year averagenumber of loss of supply incidents Down by 4% Better than 5 year averagenumber of loss of generation incidents Down by 19% Worse than 3 year averageaverage duration of sustained outages Down by 6% Better than 5 year averageindex of transmission reliability Better by 3% In line with 5 year averageThe information presented in the above table is discussed in further detail in thisreport.1.4 Selected <strong>Performance</strong> StatisticsTable 1-2: Reliability <strong>Performance</strong> for <strong>National</strong> <strong>Grid</strong> in FY<strong>2005</strong>% of circuits that experienced no disturbances 48%% of circuits that only experienced a single disturbance 23%% of circuits that experienced 2 disturbances 12%% of circuits that experienced 3 or more disturbances 18%Overall ITR 99.963%Overall Availability 98.613%Average <strong>Transmission</strong> Circuit Interruption Duration Index (TSAIDI)Average <strong>Transmission</strong> Circuit Interruption Frequency Index (TSAIFI) 1.177195 minutesMost customers will not have experienced loss of supply due to <strong>Transmission</strong>disturbances. 48% of our circuits had no disturbances at all and of those that did,most of those path interruptions did not result in a disturbance to customers.<strong>National</strong> <strong>Grid</strong> <strong>Performance</strong> <strong>Report</strong> 5
<strong>Transmission</strong> ReliabilityFY<strong>2005</strong>1.5 Number of Disturbances• The following figure compares transmission outages distributed throughthe year for both FY2004 and FY<strong>2005</strong>. The blue line shows the outagesfor FY2004 and the red line shows the outages for FY<strong>2005</strong>. Thesenumbers represent the total number of disturbances, which were eithermomentary or sustained in nature.Figure 1-1: Cumulative Number of Outages by Month7006005004003002001000Apr May Jun Jul Aug Sep Oct Nov Dec Jan Feb MarFY2004 FY<strong>2005</strong> 5 YR AVG• The number of disturbances in FY<strong>2005</strong> was higher than for FY2004.Although this represents a slight decrease in reliability performance overlast year, FY<strong>2005</strong> performance was mostly consistent with the 5 yearAverage. This performance must be considered taking into account thatthe lightning season in FY2004 was significantly better than the 5 yearaverage while that in FY<strong>2005</strong> was significantly worse.• The highest rate of incidence of outages occurred during warm weatherconditions with 58% of all outages occurring between May and August.Compared to FY2004, there was an increase of over 200% in lightninginitiated outages in FY<strong>2005</strong> (an increase of 33% over the 5 YearAverage).• The following figure indicates the weekly profile of events in FY<strong>2005</strong> inboth New England and New York. The green bars indicate the NewEngland events while the blue bars indicate New York events. Calloutsare used against weeks that had abnormally large number of outagesand identify the major causes for the performance. In FY<strong>2005</strong> Lightningstorms were responsible for all the major event weeks.6 <strong>National</strong> <strong>Grid</strong> <strong>Performance</strong> <strong>Report</strong>
FY<strong>2005</strong><strong>Transmission</strong> ReliabilityFigure 1-2: Weekly Number of Events in FY<strong>2005</strong>60Weekly Number of Incidents - FY<strong>2005</strong>50May 22-24,LightningNumber of Incidents403020Jul 2,LightningAug 20-21,LightningAug 29,Lightning100Wk1Wk3Wk5Wk7Wk9Wk11Wk13Wk15Wk17Wk19Wk21Wk23Wk25NEWk27Wk29Wk31Wk33NYWk35Wk37Wk39Wk41Wk43Wk45Wk47Wk49Wk51Wk53• TSAIFI is the average number of interruptions per circuit. It is calculated bydividing the total number of disturbances in a given period by the number ofcircuits. TSAIFI for FY<strong>2005</strong> was 1.77. This indicates that each circuit had,on average, 1.177 disturbances last Year (equals 631 disturbances intotal). Of these disturbances 433 were momentary outages and 198 weresustained outages.Figure 1-3: 5 Year Trend of TSAIFITSAIFI1.41.21.00.80.60.40.20.0FY2001 FY2002 FY2003 FY2004 FY<strong>2005</strong>• With the exception of FY2004 which experienced a quiet lightningseason, TSAIFI for FY<strong>2005</strong> is similar to performance in previous yearsand close to the 5 year average of 1.16.<strong>National</strong> <strong>Grid</strong> <strong>Performance</strong> <strong>Report</strong> 7
<strong>Transmission</strong> ReliabilityFY<strong>2005</strong>1.6 Momentary Disturbances• Momentary disturbances are measured through TMAIFI. TMAIFI iscalculated by dividing the total number of momentary disturbances in anygiven period by the number of circuits. A lower value of TMAIFIrepresents better reliability performance.• TMAIFI performance in FY<strong>2005</strong> was worse than in FY2004 reflecting anincrease in the number of momentary outages.• The highest incidence rate of momentary outages was in May andAugust contributing 40% of the total momentary outages for FY<strong>2005</strong>.Most of the outages in May and August were due to increased lightningexperienced in those months. Initiatives to understand and improveperformance with respect to lightning are ongoing. For more information onthe Lightning initiatives, please refer to Section 3.1Figure 1-4: 5 Year Trend of TMAIFITMAIFI1.00.90.80.70.60.50.40.30.20.10.0FY2001 FY2002 FY2003 FY2004 FY<strong>2005</strong>1.7 Sustained Disturbances• Sustained disturbances are measured through TSAIFI-S. TSAIFI-S iscomputed by dividing the total number of sustained outages by thenumber of circuits. A lower value of TSAIFI-S indicates better reliabilityperformance.• The final value of TSAIFI-S for FY<strong>2005</strong> was higher than FY2004,showing a slight reduction in performance in FY<strong>2005</strong>.8 <strong>National</strong> <strong>Grid</strong> <strong>Performance</strong> <strong>Report</strong>
FY<strong>2005</strong><strong>Transmission</strong> ReliabilityFigure 1-5: 5 Year Trend of TSAIFI-STSAIFI-S0.450.400.350.300.250.200.150.100.050.00FY2001 FY2002 FY2003 FY2004 FY<strong>2005</strong>1.8 <strong>Transmission</strong> Outage Duration• The average duration of each sustained outage is measured throughTSAIDI. TSAIDI is computed by dividing the total duration of outages bythe number of circuits. For TSAIDI, measured in minutes, a lower valuerepresents better reliability performance.• TSAIDI was better in FY<strong>2005</strong> than for FY2004.• The final value of TSAIDI for FY<strong>2005</strong> is 195 minutes, a slight decreasefrom last year.Figure 1-6: 5 Year Trend of TSAIDITSAIDI300250200150100500FY2001 FY2002 FY2003 FY2004 FY<strong>2005</strong><strong>National</strong> <strong>Grid</strong> <strong>Performance</strong> <strong>Report</strong> 9
<strong>Transmission</strong> ReliabilityFY<strong>2005</strong>1.9 Index of <strong>Transmission</strong> Reliability• <strong>National</strong> <strong>Grid</strong> uses an index of transmission reliability (ITR) as a measurefor assessing overall transmission reliability. It represents the percentageof time transmission circuits were available for the transmission ofelectricity from one terminal to another (or others).• Thus ITR is a measure of unplanned unavailability of our transmissionsystem. It is reduced by outage time due to unplanned outages(disturbances) on the system but it does not include outage time due toplanned outages.• As with other metrics we can categorize ITR by voltage classes and thefollowing figure shows three ITR curves for FY2004 for Load (69 kV and115 kV), Bulk (230 kV and 345 kV) and System (all circuits).Figure 1-7: Bulk, Load and System ITR for FY<strong>2005</strong>100.00%99.95%99.90%99.85%99.80%ITR %99.75%99.70%99.65%99.60%99.55%99.50%Apr May Jun Jul Aug Sep Oct Nov Dec Jan Feb MarLoad ITR Bulk ITR System ITR• Major reductions in both Load and Bulk Systems ITR have been mostlydue to lightning. There were several events throughout the warmweather months when lightning caused significant damage totransmission structures, poles or conductors.• Not all of these incidents impacted customers. In FY<strong>2005</strong>, 11% of alloutages on the transmission system directly impacted customers.10 <strong>National</strong> <strong>Grid</strong> <strong>Performance</strong> <strong>Report</strong>
FY<strong>2005</strong><strong>Transmission</strong> Reliability1.10 System Availability• Availability is calculated based on the total length of planned, unplanned,and disturbance durations and the total hours the system or circuitshould have been available in a given period. The availability of thesystem measures the increased reliability of the system and is importantin case of an 'unplanned' event. High availability provides feweropportunities and less compromising situations in the event of failurewhen back up (redundant circuits) are in service (available). Thepotential risk is higher for line and customer related outages when allcircuits are not available.• In order to maintain a high level of Availability, circuits are returned toservice as quickly as possible in the event of unplanned disturbances. Inthe case of planned outages which require work over several days,circuits are returned to service at the end of each work day.• The value of System Availability for FY<strong>2005</strong> 98.63 for New England and98.60 for New York. The following figure indicates the availability of theLoad, Bulk and the <strong>Transmission</strong> System in FY<strong>2005</strong>.Figure 1-8: Bulk, Load and System Availability for FY<strong>2005</strong>100.00%99.00%98.00%97.00%96.00%95.00%94.00%Apr May Jun Jul Aug Sep Oct Nov Dec Jan Feb MarLoad Bulk System System FYTD<strong>National</strong> <strong>Grid</strong> <strong>Performance</strong> <strong>Report</strong> 11
<strong>Transmission</strong> ReliabilityFY<strong>2005</strong>1.11 Outage CausesFor every outage seen on the transmission system outage causes are identifiedand recorded. These causes are analyzed to identify trends and similarities.These studies provide insight into what could be done to possibly prevent futureoccurrences.This section contains information about the causes of transmission outages.Causes of both momentary and sustained outages have been indicated.The numbers of outages attributed to the different outage causes for All Outages,Momentary Outages and Sustained Outages have been indicated in the followingfigures.Figure 1-9: Causes of All Outages in FY<strong>2005</strong>Substation Equipment + System ProtectionWeatherExternalLine EquipmentLightningAll Others• A significant number of outages (64%) were a result of Lightning andcauses falling under the category of ‘All Other’. The category of ‘AllOther’ includes vandalism, problems with trees and other vegetation, andsome for which the cause is unknown. In addition to line and substationissues, problems outside <strong>National</strong> <strong>Grid</strong>’s control, classified as cause‘External’ contributed to 26% of the outages.• The category ‘Unknown’ includes outages whose cause could not beidentified. These outages are mostly momentary in nature. Outages areclassified as unknown only after foot and helicopter patrols reveal novalid explanation for the operation.• The category ‘External’ is assigned to outages that arise due to factorsexternal to and outside the control of the system. These include foreignutilities, customer equipment, vehicles hitting equipment and generation.The number of outages initiated by ‘External’ causes saw an increase ofover 200% compared to FY2004.12 <strong>National</strong> <strong>Grid</strong> <strong>Performance</strong> <strong>Report</strong>
FY<strong>2005</strong><strong>Transmission</strong> Reliability1.11.1 Causes of Momentary OutagesFigure 1-10: Causes of Momentary Outages in FY<strong>2005</strong>Causes of Momentary Outages in FY<strong>2005</strong>Substation Equipment + System ProtectionWeatherExternalLine EquipmentLightningAll Others• The preceding figure shows the number of momentary outages attributedto the various causes in FY<strong>2005</strong>. 84% of momentary outages werecaused by Lightning, Weather or ‘Unknown causes’. Unknown causesform a part of the ‘All Other’ category.• Compared to FY2004, FY<strong>2005</strong> saw an increase of 261% in the numberof momentaries due to Lightning, a direct reflection of the increasedlightning seen in FY<strong>2005</strong>.<strong>National</strong> <strong>Grid</strong> <strong>Performance</strong> <strong>Report</strong> 13
<strong>Transmission</strong> ReliabilityFY<strong>2005</strong>1.11.2 Causes of Sustained OutagesIt is interesting to look at the breakdown of sustained outages by cause and tocompare these with the breakdown of momentary outages by cause.Figure 1-11: Causes of Sustained Outages in FY<strong>2005</strong>Causes of Sustained Outages in FY<strong>2005</strong>Substation Equipment + System ProtectionWeatherExternalLine EquipmentLightningAll Others• The distribution of sustained outages causes shows that in addition toLightning and ‘Other’ causes, line and substation issues are also majordrivers. 14% of the sustained outages were due to Substation and LineEquipment issues.• Compared to FY2004, the number of sustained outages in FY<strong>2005</strong> dueto ‘External’ factors has increased by 233%.14 <strong>National</strong> <strong>Grid</strong> <strong>Performance</strong> <strong>Report</strong>
FY<strong>2005</strong><strong>Transmission</strong> and Customers<strong>Transmission</strong> and Customers<strong>National</strong> <strong>Grid</strong> <strong>Performance</strong> <strong>Report</strong> 15
<strong>Transmission</strong> and CustomersFY<strong>2005</strong>2 TRANSMISSION AND CUSTOMERSThis section focuses on the impact of transmission performance on itscustomers. There are several types of transmission customers. Some may beaffected by momentary outages for a few seconds, while some may suffer aprolonged disturbance due to a sustained outage.Loss of generation events impact system reliability directly through transmissionimpact and also contingency effects; both serve to disrupt the wholesale market.When transmission or distribution customers lose supply due to a sustainedtransmission outage, it is considered a loss of supply event. Loss of Supply andLoss of generation events impact customers and are therefore given particularlyhigh priority. These events are analyzed closely and all possible efforts are takento minimize their occurrence.2.1 Loss of Generation• For FY<strong>2005</strong>, there were 20 Loss of Generation incidents, 10 in NewEngland and 10 in New York. Loss of Generation applies only if agenerator is online at the time of the outage. All loss of generation eventsare captured regardless of the size of generation lost. In FY<strong>2005</strong>, theLosses in Generation ranged from 3 MW upwards.• The following figure indicates the number of Loss of Generation events inFY<strong>2005</strong>. This trend is compared against that of FY2004. Theimprovement in FY<strong>2005</strong> over FY2004 is 23%.Figure 2-1: Cumulative LOG Incidents - FY<strong>2005</strong> vs. FY20043025Number of LOG Incidents20151050Apr May Jun Jul Aug Sep Oct Nov Dec Jan Feb MarFY2004FY<strong>2005</strong>16 <strong>National</strong> <strong>Grid</strong> <strong>Performance</strong> <strong>Report</strong>
FY<strong>2005</strong><strong>Transmission</strong> and Customers• The following figure provides information on the causes of the variousoutages that resulted in loss of generation. The biggest contributor is thecategory of ‘All Other’. This includes problems due to vegetation,animals, human error and other unknown reasons.Figure 2-2: Causes of LOG Incidents in FY<strong>2005</strong>Causes of LOG IncidentsSubstation Equipment + System ProtectionWeatherExternalLine EquipmentLightningAll Others<strong>National</strong> <strong>Grid</strong> <strong>Performance</strong> <strong>Report</strong> 17
<strong>Transmission</strong> and CustomersFY<strong>2005</strong>• Some of the Loss of Generation events in New England and New Yorkhave been indicated below. In each case, the generator connected to theline was generating at the time of the trip.Date Circuit Details Impact05/07/04333(Burriville, RI)Relay problem at ShermanRoad Station caused the lineand the connected generator totripLoss of 200MW.06/08/04Feura Bush-North Catskill #2(South ofAlbany, NY)The line tripped and reclosedwhen there were severethunderstorms in the area.Loss of approximately72 MW.08/11/0408/20/04and08/21/0409/02/0401/23/05Spier-Queensbury #5and #7(Glens Falls,NY)338(BetweenTewksbury andWoburn, MA)Spier Falls Bus(SaratogaCounty, North ofAlbany, NY)U6(BetweenSomerset andBridgewater,MA)The lines tripped and reclosedwhen there were severethunderstorms in the area<strong>National</strong> <strong>Grid</strong> experiencednumerous line operations due tosevere thunderstorms. Duringthe storm, the 338 line wasinterrupted.Breaker overhaul work at theSpier Falls Hydro plant,generator unit #9, caused the115 kV 99G bus at Spier Fallsstation to trip/reclose autoThe cause of the outage was astatic wire on the U6 / V5structure south of Taunton Riverin Dighton. An outage wasrequired for V5 line in order tomake repairs to U6 / V5 staticwire.Loss of 130 MW.The 338 Line trip causedthe loss of approximately1,000 MW of generationin the Boston Area. Thisresulted in ISO-NEimplementingEmergency OperatingProcedures, including a5% Voltage reduction inthe Boston AreaLoss of 133MW.Loss of 170MW.18 <strong>National</strong> <strong>Grid</strong> <strong>Performance</strong> <strong>Report</strong>
FY<strong>2005</strong><strong>Transmission</strong> and Customers2.2 Loss of Supply• For FY<strong>2005</strong>, there were 21 Loss of supply incidents in New England and32 Loss of Supply events in New York. On average, in FY<strong>2005</strong>, acustomer in New England would have lost supply for 9.2 minutes and acustomer in New York would have lost supply for 3.5 minutes as a resultof <strong>Transmission</strong> outages.• The following figure indicates the trend of LOS events in New Englandacross FY<strong>2005</strong> and compares it against that of FY2004.Figure 2-3: Cumulative LOS Incidents in New England2520Number of LOS Incidents151050Apr May Jun Jul Aug Sep Oct Nov Dec Jan Feb MarFY04FY05<strong>National</strong> <strong>Grid</strong> <strong>Performance</strong> <strong>Report</strong> 19
<strong>Transmission</strong> and CustomersFY<strong>2005</strong>• The following figure examines the causes of the various LOS Incidents inNew England. The number of events due to weather, ‘External’ and ‘AllOther’ causes all saw increases when compared to FY2004.Figure 2-4: Causes of LOS Incidents in New England in FY<strong>2005</strong>NE - Causes of LOS EventsSubstation Equipment + System ProtectionWeatherExternalLine EquipmentLightningAll Others• Some of the significant New England LOS events have been indicatedhere:Table 2-1: Significant New England Loss of Supply Events for FY<strong>2005</strong>Date Circuit Details Impact11/28/0412/27/0407/22/04Q169 and A179(Lynn, MA)M13 and L14(Between FallRiver, MA andPortsmouth, RI)E20, L1 and M1(Between EastBridgewater, MAandMiddleborough,MA)A downed Q169 Structure struck theguy wire on the A179 LineIcing on the M13 and L14 linescombined with strong winds createda “galloping” condition, causing thephases to come into contact witheach other. Approximately 12 to 15spans were observed galloping todifferent degrees.C phase of the L1 line downbetween structures #1 and #2. Thisaction also de-energized the feedinto Middleboro Municipal off the M1lineApproximately20,000 customerslost power for up toa maximum of 678minutes.A total of 65,412customers wereaffected for up to 55minutes.Approximately22,260 customerslost power for amaximum of 71minutes.20 <strong>National</strong> <strong>Grid</strong> <strong>Performance</strong> <strong>Report</strong>
FY<strong>2005</strong><strong>Transmission</strong> and Customers• The following figure illustrates the distribution of the New York Loss ofSupply events throughout FY<strong>2005</strong> compared against FY2004. Thenumber of events in FY<strong>2005</strong> decreased indicating performanceimprovement.Figure 2-5: Cumulative LOS Incidents in New York4035Number of LOS Incidents302520151050Apr May Jun Jul Aug Sep Oct Nov Dec Jan Feb MarFY2004FY<strong>2005</strong>• The following figure examines the various causes of New York Loss ofSupply Incidents in FY<strong>2005</strong>. While there was a decrease in the number ofevents due to equipment issues, those initiated by lightning, ‘External’ and‘All Other’ categories increased.Figure 2-6: Causes of LOS Incidents in New York in FY<strong>2005</strong>NY - Causes of LOS EventsSubstation Equipment + System ProtectionWeatherExternalLine EquipmentLightningAll Others<strong>National</strong> <strong>Grid</strong> <strong>Performance</strong> <strong>Report</strong> 21
<strong>Transmission</strong> and CustomersFY<strong>2005</strong>• Some of the significant New York LOS events have been indicated here:Table 2-2: Significant New York Loss of Supply Events for FY<strong>2005</strong>Date Circuit Details Customer Impact05/23/0401/24/0508/17/04Levitt-Rome #8(West of Utica,NY)ThousandIslands-Coffeen#4(Watertown, NY)Republic-Ticonderoga #2(Western shoreof LakeChamplain inNew York)The line tripped due to a lightningstrike and locked out due to a stuckrelay contactCoffeen station 115 kV CapacitorBank was removed from service andsubsequently the capacitor bankcircuit interrupter exploded. Severalbreakers opened and reclosedautomatically but one of them failedto reclose due to a burnt closing coil,causing a sustained outage to theThousand Islands-Coffeen #4 line.The trip was caused when a guywire broke and got up into theconductorApproximately 6000customers wereinterrupted for11hours and 15minutes.Approximately15,000 customerswere interruptedabout 1 hour.Approximately 4400customers lostpower for 131minutes. The eventalso caused loss ofgeneration of44MW.22 <strong>National</strong> <strong>Grid</strong> <strong>Performance</strong> <strong>Report</strong>
FY<strong>2005</strong>DevelopmentsDevelopments<strong>National</strong> <strong>Grid</strong> <strong>Performance</strong> <strong>Report</strong> 23
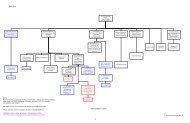
DevelopmentsFY<strong>2005</strong>3 DEVELOPMENTS3.1 Current and Future AssignmentsSeveral projects were implemented in order to improve transmission reliability aswell as service to customers. Some of them have been outlined here:3.1.1 Rehab ProjectsA wide range of Line Rehab projects were implemented in FY<strong>2005</strong>. Figure 3-1shows New England projects occurring in FY<strong>2005</strong>. The line numbers/ circuits are arelative indication of where the circuit is physically located and not necessarily thelocation of the construction. These construction projects include many aspects of linerehabilitation including reconfiguration, reconductoring switch installations andreplacements.Figure 3-1: Projects in New England in FY<strong>2005</strong>24 <strong>National</strong> <strong>Grid</strong> <strong>Performance</strong> <strong>Report</strong>
FY<strong>2005</strong>DevelopmentsFigure 3-2 shows New York projects occurring in FY<strong>2005</strong>. These constructionprojects focus on a variety of rehabilitation issues. Multiple line numbers are listed ina single ‘call-out’ instead of using multiple ‘call-outs’ to avoid cluttering the area map.The circuit numbers are cross-referenced below with the typical New York standardcircuit naming convention.Figure 3-2: Projects in New York in FY<strong>2005</strong>Circuit # Circuit Name Circuit NameT1280 Gardenville - Homer Hill #152 T2660 Teall - Carr Street #6T1310 Gardenville - Homer Hill #151 T2670 Teall - Oneida #2T1440 Huntley - Lockport #36 T3060 Black River - Taylorville #2T1450 Huntley - Lockport #37 T3080 Browns Falls - Taylorville #3T1500 Lockport - Batavia #108 T3130 Coffeen - West Adams #2T1530 Lockport - Mortimer #111 T3320 Taylorville - Boonville #5T1540 Lockport - Mortimer #113 T3330 Taylorville - Boonville #6T1550 Lockport - Mortimer #114 T3340 Taylorville - Moshier #7T1580 Mortimer - Golah #110 T4140 Oneida - Oneida Energy (Sterling) #4T1720 Niagara-Packard #62 T4210 Porter-Rotterdam #31T1810 Packard - Walck Road #129 T5010 Albany - Greenbush #1T1820 Packard - Huntley #130 T5020 Albany - Greenbush #2T1890 Southeast Batavia - Golah #119 T5060 Battenkill - North Troy #10T2000 Ash - Teall #7 T5450 New Scotland - Alps #2T2010 Ash - Teall #8 T5530 North Troy - Hoosick #5T2140 Curtis Street - Teall #13 T5630 Rotterdam-Bear Swamp E205T2200 Elbridge - Woodard #4 T5680 Rotterdam - New Scotland #13T2480 Oswego - Volney #12 T6020 Walck Road - Huntley #133T2580 South Oswego - Curtis St. #10 T6270 North Carthage - Taylorville #8<strong>National</strong> <strong>Grid</strong> <strong>Performance</strong> <strong>Report</strong> 25
DevelopmentsFY<strong>2005</strong>3.1.2 Lightning AnalysisAs indicated in the preceding figures and tables, lightning has a very significantimpact on the system performance. Recognizing this importance, a lightningimprovement initiative was established in late FY<strong>2005</strong>. There are two interrelatedaspects to this work:• Lightning Analysis• Lightning Mitigating SolutionsThe overall intention is to learn more on how lightning impacts operationalperformance. A systematic analysis of historical faults (over the past 5 years) isbeing performed to derive a list of circuits that are especially prone to and exhibitpoor performance with respect to lightning. The intent is then to developstrategies and projects to address this poor or undesirable performance. Inaddition, strike location information is being identified for lightning-caused faults,to facilitate targeting and identification of potential damage. This would facilitateshorter repair times as well as mitigate the potential for future outages caused bylightning.Historically, northeastern United States is an area with relatively lower long-termexposure to lightning when compared to many other areas of the country, butwith this lower exposure comes a much greater variability in the amount oflightning storms from season to season. In the ten years studied for the <strong>National</strong><strong>Grid</strong> USA service area average exposure densities (lightning density is thenumber of ground strokes/square kilometer/year) variances of ± 50 to 100% fromthe long-term average for a year are common, and some year-to-year changesare as high as 500%.26 <strong>National</strong> <strong>Grid</strong> <strong>Performance</strong> <strong>Report</strong>
FY<strong>2005</strong>DevelopmentsThe lightning density maps below illustrate the drastic nature of this year-to-yearvariability. Compare the density maps for CY2003 and CY2004. Hotter colorsindicate higher densities of lightning ground strikes.<strong>National</strong> <strong>Grid</strong> <strong>Performance</strong> <strong>Report</strong> 27
DevelopmentsFY<strong>2005</strong>This chart shows the last five fiscal years’ cumulative lightning exposure, brokeninto regions. Note that the average cumulative exposure for this period wasapproximately 320,000 strokes.Cumulative Lightning Exposure - fiscal Years 2001-<strong>2005</strong>800700600Strokes (Thousands)50040030020010002001 2002 2003 2004 <strong>2005</strong>NENYThe large variability in exposure to lighting from season to season presents asignificant challenge to the lightning analysis program in verifying whether or notthe mitigation strategies that are eventually implemented have been effective.Since the individual circuit or section of circuit that was improved may not bechallenged in that area again for some years, it may take as long to check thatthe improvement was correctly targeted. This places a premium on the carefulselection of circuits and circuit weakness areas in the various stages of theprogram.The details on the two major aspects of the Lightning Improvement program areoutlined below:3.1.2.1 Lightning Analysis StrategiesThe initial stages of the program would involve screening and selection ofcircuits. The Challenge/Fault ratio would be used to develop relative rankings ofcircuits according to their lightning performance, thereby identifying the poorestperformers in each region. Each succeeding stage following the initial screenswill take a great deal more time on each circuit, so by starting with a smallerpopulation of underperformers, the overall analysis time is reduced. The nextlogical step in the program would be to identify circuits that should exhibitreliability performance improvement if changes are made. At this point, a broaderanalysis of engineering efficacy, business need, and projected circuitperformance would be performed on the list of worst lightning performers tocome up with candidates for mitigation projects.28 <strong>National</strong> <strong>Grid</strong> <strong>Performance</strong> <strong>Report</strong>
FY<strong>2005</strong>DevelopmentsSome of the additional criteria that will be employed are:• The projected fault rate calculated using the expected long-term exposurefrom the regional lightning density and the circuit’s Challenge/Fault Ratio• Soil Resistivity/Grounding• Structure Types• Elevation/Geography3.1.2.2 Lightning Mitigating StrategiesThis stage will involve the engineering of mitigation strategies to be used as addonsto existing projects or for future projects.Some possible solutions that will be considered:• Improved Grounding• Counterpoise• Insulator Upgrades/Replacement• Shield Wire• Lightning ArrestorsAll circuits where mitigation projects are implemented will continue to bemonitored to track their lightning performance improvement.3.1.3 Vegetation Management Program<strong>National</strong> <strong>Grid</strong>’s <strong>Transmission</strong> Forestry Department implemented a plan to carryout a risk assessment study and develop a mitigation strategy on its NE (69 kV,230 kV and 345 kV) and NY (115 kV, 230 kV and 345 kV) transmission system.The risk assessment was focused on quantifying the size and characteristics ofthe utility forest outside the electric utility right-of-way, this being the primarysource of transmission system interruption/loss of supply across the system. Thegoal of the <strong>Transmission</strong> Forestry Department is to minimize this risk, balancedagainst financial resources, to improve overall system reliability as measured bythe number of tree caused incidents and loss of supply to customers. Within thisgoal, there is a particular focus on major transmission lines (230kV and 345 kV)where <strong>National</strong> <strong>Grid</strong> seeks a management regime that results in no tree-causedservice interruptions. The project was designed to provide the <strong>Transmission</strong>Forestry Department the data required to quantify the current level of tree risk.Risk of outages from the utility forest adjacent to cleared rights-of-way is primarilyrelated to three factors: cleared width (distance from conductor to tree line),conductor height above ground and tree height. The Optimal Width Calculatordeveloped by Ecological Solutions, Inc., a consulting firm contracted by <strong>National</strong><strong>Grid</strong>, is used to calculate a Risk Factor to quantify risk of a tree falling into<strong>National</strong> <strong>Grid</strong> <strong>Performance</strong> <strong>Report</strong> 29
DevelopmentsFY<strong>2005</strong>conductors based on the three factors. The Risk Factor is a relative risk rating –the numeric value has no direct meaning except in relation to other data.3.1.4 Asset Management ProcessThe objective of the <strong>Transmission</strong> Asset Management Business Model was tocreate a process based on an asset steward and a service provider modelthrough which the <strong>Transmission</strong> and Distribution Business segments will beresponsible for the stewardship of their respective allocated assets, whilereceiving services from organizations in other parts of the business.The <strong>Transmission</strong> <strong>Network</strong> Asset Management Process is moving from a basicapproach to a progressive approach in implementation of <strong>Network</strong> Review,Strategic Options, Work Program Development, and Work Program Delivery.The objective is to combine understanding of the current condition andperformance of all the network assets making up the <strong>National</strong> <strong>Grid</strong> USANortheast <strong>Transmission</strong> System. It is intended to collate data, information andknowledge from a number of sources across the transmission business in orderto provide a balanced view of the issues affecting equipment condition andperformance, and recommend remedial actions. The current status of theseassets would be identified, highlighting any risks or opportunities that thecondition or performance of the asset represents to meeting the businessobjectives, now and into the future.3.2 Business InitiativesThe <strong>National</strong> <strong>Grid</strong> Five Year Statement, <strong>2005</strong>-2009 provides insights intogeneration development and transmission system loadings and limitations acrossthe New York and New England region. It also explores options for thereinforcement of the transmission system, and indicates where new or expandinggeneration or load can best be accommodated. The Five Year Statement isavailable on request.30 <strong>National</strong> <strong>Grid</strong> <strong>Performance</strong> <strong>Report</strong>
FY<strong>2005</strong>HVDCHVDC<strong>National</strong> <strong>Grid</strong> <strong>Performance</strong> <strong>Report</strong> 31
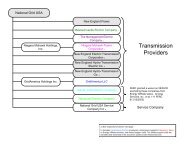
HVDCFY<strong>2005</strong>4 HVDCThis section contains information relating to the performance of the 450 kV DCfacility terminating at Sandy Pond. <strong>National</strong> <strong>Grid</strong> USA operates the New Englandportion of two interconnections know as Phase 1 and Phase 2, between NewEngland and Canada. Phase 1 consists of two converter stations (Des Cantonsin Quebec, and Monroe in NH), each rated 690 MW. Phase I was placed incommercial operation service in October 1, 1986. Phase 2 included threeadditional converter terminals (Radisson, Nicolet and Sandy Pond). Sandy Pondis a + 450 kV DC 2000 MW bipolar converter terminal located in Ayer, MA. Phase2 (Radisson and Sandy Pond only) began commercial operation on November 1,1990. In 1992 Nicolet, the third terminal on the multi-terminal HVDC system wasplaced in service. This terminal is rated 2138 MW and located in the Montrealarea. Phase I and Phase II share the same dc transmission lines. As a resultSandy Pond and Monroe may not operate simultaneously. Sandy Pond is thepreferred station of operation due to higher capacity rating (2000MW vs. 690MW)and it is located closer to larger load centers.Figure 8-1: HVDC Connection between James Bay and Sandy Pond32 <strong>National</strong> <strong>Grid</strong> <strong>Performance</strong> <strong>Report</strong>
FY<strong>2005</strong>HVDCMost HVDC transmissions are point to point transmissions using overhead lines.Most HVDC overhead line transmissions are bipolar, i.e. they use two conductorsof opposite polarity (one positive and one negative). A bipolar transmission is infact a double circuit transmission, since one pole can continue to transmit powerwhen the other pole is out of service. A multi-terminal HVDC transmission ismore complex than an ordinary point-to-point transmission. In particular, thecontrol system is more elaborate and the communication requirements betweenthe stations become larger.There is only one large-scale multi-terminal HVDC system in operation in theworld today. It is the 2000 MW Hydro Québec – Sandy Pond interconnection.The operating experience of this transmission has proved that from a technicalpoint of view there are no problems connecting several converter stations to thesame HVDC line.4.1 UtilizationPhase 1 is rarely used to allow the use of Phase 2.Phase 2 had a Firm Energy Contract that expired end of August 2001. This canbe seen in the reduction in Phase 2 utilization during FY2002. There were othercommercial issues ongoing at this same time that may have contributed to lowerutilization. Since that time utilization has been back up in the mild and warmmonths and generally decreased in the winter time period. Hydro Quebec’s peakis in the winter and energy is typically diverted to Nicolet when it is very coldrather than sending it south to New England. The following figure shows theutilization of Phase 2 for each month during FY<strong>2005</strong>.Figure 8-2: Sandy Pond Monthly Utilization in FY<strong>2005</strong>45%Sandy Pond (Phase 2) FY<strong>2005</strong> Utilization40%35%30%25%20%15%10%5%0%Apr May Jun Jul Aug Sep Oct Nov Dec Jan Feb Mar<strong>National</strong> <strong>Grid</strong> <strong>Performance</strong> <strong>Report</strong> 33
HVDCFY<strong>2005</strong>4.2 Phase 2 Operational IssuesThere is a large fire protection project underway at Sandy Pond. The VESDA(Very Early Smoke Detection and Alarming) System used as part of the ValveHall fire protection system is required. The present VESDA System’s smokedetectors no longer have direct replacements available. Initiatives on his projectand other asset strategies for Sandy Pond are managed by <strong>Transmission</strong> AssetStrategy Department.While HVDC technical personnel continue to support the facility, availability ofreplacement parts and expertise are important issues.34 <strong>National</strong> <strong>Grid</strong> <strong>Performance</strong> <strong>Report</strong>
FY<strong>2005</strong>Feedback andAdditional InformationFeedback and Additional Information<strong>National</strong> <strong>Grid</strong> <strong>Performance</strong> <strong>Report</strong> 35
Feedback and Additional InformationFY<strong>2005</strong>5 FEEDBACK AND ADDITIONAL INFORMATION5.1 System InformationTable 5-1: Asset Information for <strong>National</strong> <strong>Grid</strong># of circuits 536miles of transmission included for statistical reporting 8,767Number of circuits / miles at 69 kV 41 / 537Number of circuits / miles at 115 kV 415 / 6,070Number of circuits / miles at 230 kV 31 / 945Number of circuits / miles at 345 kV 49 / 1,2155.2 Definitions / AcronymsA number of commonly used terms are used in this report. These and otherdefinitions that the reader may be familiar with are described here.AvailabilityBulk<strong>Transmission</strong>CircuitCircuit MileCustomerDelivery PointDisturbancePercentage of time the entire transmission system (or a particular class orcircuit) is available for the transmission of electricity between two or moreterminals. It is calculated based on the total length of planned, unplanned,and disturbance durations and the total hours the system or circuit shouldhave been available in a given period. The highest attainable value would be100%.A voltage class under study and composed of 230 kV or higher voltagetransmission circuits (excludes HVDC).An electrical asset that is in place for the purpose of transmitting or deliveringelectrical energy between two or more terminals. A circuit is composed of abreaker-to-breaker or breaker to load segment of the transmission grid. Fortransmission, the circuit must be energized at a phase-to-phase voltage of 69kV or higher.The total length of a designated circuit in miles. This would be the sum of allthe span lengths (pole, tower, etc.), in a given circuit.The ultimate consumer of electricity supplied by the transmission system. Acustomer can be residential, commercial, industrial, or municipal. Currently,municipalities served by the transmission system are considered onecustomer each.A delivery point is the location where the transmission system deliverselectricity to the distribution system. The <strong>National</strong> <strong>Grid</strong> defined delivery pointis the low-side bushings of the transformer or metering point.An event that occurs to a circuit(s), which results in the automatic operation(open, open-close, open-close-open) of one or more terminals (circuitbreakers, sectionalizing devices) of that circuit. The voltage on the circuitDOES NOT need to drop to zero to be considered a disturbance. Customersmay or may not be interrupted by the disturbance. These events are forced,unplanned incidents, usually because of lightning, weather, substationtrouble, animal contact or other unanticipated influences.36 <strong>National</strong> <strong>Grid</strong> <strong>Performance</strong> <strong>Report</strong>
FY<strong>2005</strong>Feedback and Additional InformationDisturbanceDurationFaultHVDCInterconnectionInterruptionITRKPILCMLineLoad<strong>Transmission</strong>LOGLOSMomentaryDisturbanceOutageThe total time a circuit is not available for power flow to an interconnection,delivery point or between two or more terminals. The duration is measured inminutes and is the time difference from when a circuit is interrupted fromnormal power flow and when it is restored to normal power flow.A phase-to-phase or phase-to-ground condition on a circuit, which may resultin the operation of the protective devices of the circuit. A fault may betransitory and clear before the first re-close of a circuit, or result in a lock outcondition.High Voltage Direct Current. A method of transmitting electrical energy usingthe Direct Current (DC) method as opposed to the Alternating Current (AC)method. A terminal is in place at each end of the line for converting from ACto DC and vice versa. The HVDC line from James Bay to Sandy Pond allowsfor import or export of approximately 2 GW from either terminal.An interconnection is a point where transmission service from thetransmission provider is transferred to another entity (ex. <strong>National</strong> <strong>Grid</strong> toNStar). These are normally closed points of service to generators, nonaffiliatedutilities, wholesale customers, municipalities, etc.One or more openings of a protective device, resulting in zero voltage ordiscontinuity, occurring on a single circuit or on adjacent connected facilities.(Not consistent with IEEE definition by which an interruption is an outage thatcauses a customer to lose supply.)The Index of <strong>Transmission</strong> Reliability is the percentage of time the entiretransmission system (or a particular circuit) is available for the transmissionof electricity from one terminal to another or others.Key <strong>Performance</strong> Indicator. A metric that represents an important facet oftransmission system performance.Lost Customer Minutes is a product of the estimated number of customerswithout supply multiplied by the duration of the interruption. Where multiplefeeders are involved the LCM is the sum of the products of these calculationsfor each feeder.See Circuit. The two terms are used interchangeably.A voltage class under study and composed of 69 kV and 115 kVtransmission circuits.Loss of Generation. A disturbance on the transmission system, which resultsin the inability of a generation facility to produce and transfer energy. Thecause of this disturbance can be initiated by either a distribution ortransmission event, but not the generator itself.Loss of Supply. A sustained disturbance on the transmission system, whichresults in the loss of electrical service to one or more customers. The causeof this disturbance can be initiated either by a distribution or transmissionevent, with the cause being noted and tracked.A disturbance whose total duration is less than or equal to one minute forNew England and New York. Multiple operations of a protective devicefollowed by a successful re-close within the defined momentary durationabove would be considered one momentary disturbance.Interruption of a transmission circuit, either by a disturbance or planned orunplanned maintenance operation, which causes the circuit to becomeunavailable for normal power flow.<strong>National</strong> <strong>Grid</strong> <strong>Performance</strong> <strong>Report</strong> 37
Feedback and Additional InformationFY<strong>2005</strong>SustainedDisturbanceTCITerminalTMAIFITSAIDITSAIFITSAIFI-SVoltage ClassA disturbance whose total duration is greater than one minute for NewEngland and New York. Multiple operation of a protective device followed bya lock out would be considered one sustained disturbance.<strong>Transmission</strong> Customer Impact is a measure of loss of supply and/or loss ofservice events to customers (including generators). A score of 0 is the bestlevel of performance. It is derived from a simple count of events that cause aloss of supply / loss of access to the system. A disturbance that results inboth LOS and LOG counts as one TCI.A point where transmission line conductors terminate and they areconnected to one or more sectionalizing devices. The purpose of the terminalis to isolate the given circuit. Typically, a terminal would be in a substation orswitch station, where sectionalizing devices are also connected to a stationbus or transformer.<strong>Transmission</strong> Momentary Average Interruption Frequency Index. A value,which is calculated by dividing the total momentary disturbances in a givenperiod by the number of circuits in the system. Multiple operations of aprotective device followed by a successful re-close within a total duration of 1minute or less would be considered one momentary disturbance.<strong>Transmission</strong> System Average Interruption Duration Index. Total duration ofcircuit interruptions in a given period divided by the number of circuits in thesystem. Note: Does not conform explicitly to the IEEE SAIDI definition.<strong>Transmission</strong> System Average Interruption Frequency Index. The averageinterruptions per circuit. It is calculated by dividing the total number ofinterruptions by the number of circuits in the system. Note: Does not conformexplicitly to the IEEE SAIFI definition.<strong>Transmission</strong> System Average Interruption Frequency Index - Sustained. It iscomputed by dividing the total number of sustained (>60 seconds unlessotherwise stated) interruptions by the number of circuits in the system.A voltage level used for analysis purposes, by grouping together circuits witha common transmission voltage for transmission performance reporting. TheAC transmission voltages under analysis are 69 kV, 115 kV, 230 kV, 345 kV.Also DC transmission voltage of 450kV (not used in this report).5.3 Feedback InformationAs part of our effort to improve both reliability performance and customersatisfaction we welcome your feedback. We hope that this report has providedboth useful and interesting information about our performance and about ourcontinuing efforts to make improvements.Please contact your <strong>Transmission</strong> Account Manager to share your views andcomments.If you need additional information on this <strong>Report</strong>, please contact:Herb Schrayshuen<strong>Transmission</strong> Commercial Services<strong>National</strong> <strong>Grid</strong> USA300 Erie Boulevard WestSyracuse, NY 13202Email herbert.schrayshuen@us.ngrid.com38 <strong>National</strong> <strong>Grid</strong> <strong>Performance</strong> <strong>Report</strong>
Feedback and Additional InformationFY<strong>2005</strong>