Transmission Network Performance Report 2005 - National Grid
Transmission Network Performance Report 2005 - National Grid
Transmission Network Performance Report 2005 - National Grid
- No tags were found...

You also want an ePaper? Increase the reach of your titles
YUMPU automatically turns print PDFs into web optimized ePapers that Google loves.
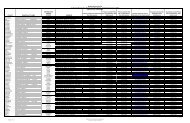
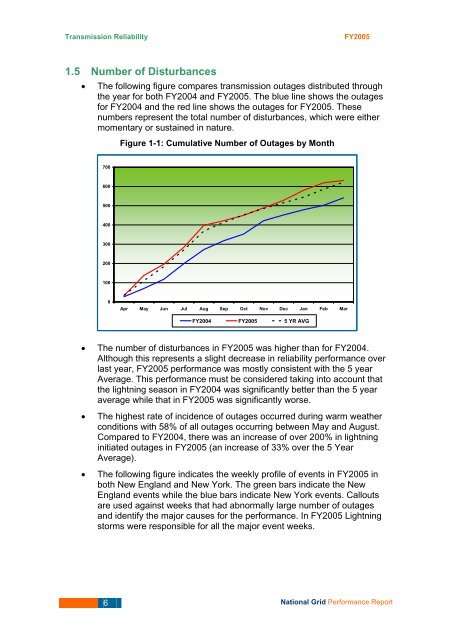
<strong>Transmission</strong> ReliabilityFY<strong>2005</strong>1.5 Number of Disturbances• The following figure compares transmission outages distributed throughthe year for both FY2004 and FY<strong>2005</strong>. The blue line shows the outagesfor FY2004 and the red line shows the outages for FY<strong>2005</strong>. Thesenumbers represent the total number of disturbances, which were eithermomentary or sustained in nature.Figure 1-1: Cumulative Number of Outages by Month7006005004003002001000Apr May Jun Jul Aug Sep Oct Nov Dec Jan Feb MarFY2004 FY<strong>2005</strong> 5 YR AVG• The number of disturbances in FY<strong>2005</strong> was higher than for FY2004.Although this represents a slight decrease in reliability performance overlast year, FY<strong>2005</strong> performance was mostly consistent with the 5 yearAverage. This performance must be considered taking into account thatthe lightning season in FY2004 was significantly better than the 5 yearaverage while that in FY<strong>2005</strong> was significantly worse.• The highest rate of incidence of outages occurred during warm weatherconditions with 58% of all outages occurring between May and August.Compared to FY2004, there was an increase of over 200% in lightninginitiated outages in FY<strong>2005</strong> (an increase of 33% over the 5 YearAverage).• The following figure indicates the weekly profile of events in FY<strong>2005</strong> inboth New England and New York. The green bars indicate the NewEngland events while the blue bars indicate New York events. Calloutsare used against weeks that had abnormally large number of outagesand identify the major causes for the performance. In FY<strong>2005</strong> Lightningstorms were responsible for all the major event weeks.6 <strong>National</strong> <strong>Grid</strong> <strong>Performance</strong> <strong>Report</strong>