Transmission Network Performance Report 2005 - National Grid
Transmission Network Performance Report 2005 - National Grid
Transmission Network Performance Report 2005 - National Grid
- No tags were found...

You also want an ePaper? Increase the reach of your titles
YUMPU automatically turns print PDFs into web optimized ePapers that Google loves.
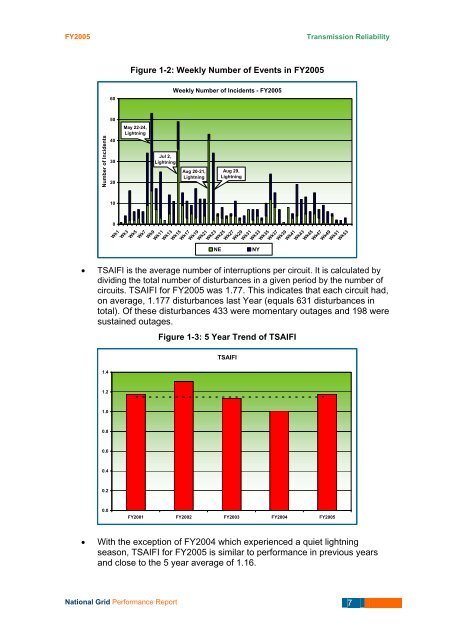
FY<strong>2005</strong><strong>Transmission</strong> ReliabilityFigure 1-2: Weekly Number of Events in FY<strong>2005</strong>60Weekly Number of Incidents - FY<strong>2005</strong>50May 22-24,LightningNumber of Incidents403020Jul 2,LightningAug 20-21,LightningAug 29,Lightning100Wk1Wk3Wk5Wk7Wk9Wk11Wk13Wk15Wk17Wk19Wk21Wk23Wk25NEWk27Wk29Wk31Wk33NYWk35Wk37Wk39Wk41Wk43Wk45Wk47Wk49Wk51Wk53• TSAIFI is the average number of interruptions per circuit. It is calculated bydividing the total number of disturbances in a given period by the number ofcircuits. TSAIFI for FY<strong>2005</strong> was 1.77. This indicates that each circuit had,on average, 1.177 disturbances last Year (equals 631 disturbances intotal). Of these disturbances 433 were momentary outages and 198 weresustained outages.Figure 1-3: 5 Year Trend of TSAIFITSAIFI1.41.21.00.80.60.40.20.0FY2001 FY2002 FY2003 FY2004 FY<strong>2005</strong>• With the exception of FY2004 which experienced a quiet lightningseason, TSAIFI for FY<strong>2005</strong> is similar to performance in previous yearsand close to the 5 year average of 1.16.<strong>National</strong> <strong>Grid</strong> <strong>Performance</strong> <strong>Report</strong> 7