GEOPHYSICS LETTERS
GEOPHYSICS LETTERS
GEOPHYSICS LETTERS
- No tags were found...

Create successful ePaper yourself
Turn your PDF publications into a flip-book with our unique Google optimized e-Paper software.
<strong>GEOPHYSICS</strong> <strong>LETTERS</strong>
<strong>GEOPHYSICS</strong> <strong>LETTERS</strong>L£~?0.iEditor-In-ChiefProf. Dr. Mohamed G, Abd-ElwahedEditorial BoardProf. Dr. .,Abdel-Fattah Z. HaikalProf.Dt. ~agi A. IbrahimProf. Dr. Fikry M. Abu EI-EnainVolume (1) December 2008, Published ByThe Scientific Research And Studies CenterFax: (055)2308213-Tel : (055)2303252Email: abdelwah.ed49@hotmail.comISSN 1110 - 1555'..,-
<strong>GEOPHYSICS</strong> <strong>LETTERS</strong>REVIEWERSProf. Dr. Mohamed A. Yehia (Ain Shams Univ.)Prof. Dr. Laila A. Fayed ( Cairo Univ. )Prof. Dr. Aziz M. Kafafy (Tanta Univ»Prof. Dr. Mahdy M. Kortam(Ain Shams Univ.)Prof. Dr. Ahmed S. Abou EI-Ata (Ain Shams Univ.)Prof. Dr. Samir R. Saleh (Assiut Univ. )Prof. Dr. Abdel-Mokteder A. EI-Sayed (Ain Shams Univ.)Prof. Dr. Ahmed M. Sabry(Ain Shams Univ.),/
<strong>GEOPHYSICS</strong><strong>LETTERS</strong>CONTENTSPage-Delineation of the structural pattern and sedimentarybasins of the Southern part of the Nile Delta, Egypt, usinggravity data.Abeer Abd EI-Rehim EI-Kenawy 1-Petrophysical studies for recognizing reef reservoirs inOil prospection in ras Gharib, and Shoab Gharib Oilfields, Gulf of Suez, EgyptGhalib, M.; Nadia, M. and Farrag, Kh. 21-Seismic study to recognize reef reservoirs in Ras Gharib,Shoab Gharib and Ras Fanar Oil fields, Gulf .ofSuez,EgyptGhalib, M.; Nadia, F., and Farrag Kh. 53./
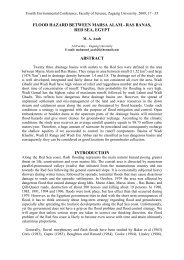
Geophys. Lett., 1 (2008)1-20DELINEATION OF THE STRUCTURAL PATTERNAND SEDIMENTARY BASINS OF THE SOUTHERNPART OF THE NILE DELTA, EGYPT, USINGGRAVITY DATA.Abeer Abd EI-Rehim EI-KenawyGeologyDepartment, Faculty of Science, Zagazig University.ABSTRACTThe study area lies between Latitudes 30°00' and 30°30 'N and Longitudes 30° 44 'and 31" 28 'E. It takes theform of a triangle enclosed between the two Nile branches,Damietta and Rosetta.The purpose of this study is to delineate the structuralframework and the sedimentary basins. The Bouguergravity map was treated to separate anomalies due todifferent sources by different analytical methods such astrend analysis, Griffin, second vertical derivative and leastsquaremethods. In addition, the depth estimation methodsas 2-D modeling, spectral analysis and Eulerdeconvolution were used. Finally, the Euler deconvolution(gridepth solutions) map was constructed using 2-D Eulerdeconvolution.The main tectonic trends revealed in the area are(Nl5"-25"E), (N45"-65"E), (N35"-45"W), (E- W), (N65"W)and (N-S). The depth to the basement ranges between 1 to5km. The analysis of different maps shows that the centralpart is characterized by a big graben (basin) bound~d bytwo uplifted areas.INTRODUCTIONThe area of study occupies the southern part of the Nile Deltaregion, Egypt. It is located between Latitudes 30°00' and 30° 30 'N andLongitudes 30° 44' and 31° 28 'R/ It takes the form of a triangleenclosed between the two Nile branches, Damietta to the East andRosetta to the West together with some parts in Eastern and WesternDesert in Egypt (Fig. 1).
2 Delineation of the structural patternThe Nile Delta covers about 22,000km2 of the cultivated land of theNile Valley. It occupies a great morphotectonic depression, which isbounded on the eastern and western sides largely by gravelly plains. Theland surface level varies from 13m above the sea level in the South toabout the mean sea level in the North. .The Nile Delta can be divided into three structural provinces (Shataand EI-Fayoumi, 1969). The southern portion (graben like structure) isbounded on the northern side by NE fault. The second province is thecentral and is bounded on the northern side by a major thrust faultoriented in a NE direction, while the third one is the northern provincewhich is characterized by a major fold (Fig. 2).The Quaternary section of the northern Nile Delta is classified byRizzini et aI., (1978) into two rock units: Mit Ghamr Formation at thebottom (Pleistocene age) which is composed of sand, gravels with someclay intercalations. At the top is Balqas Formation (Holocene age) whichis thin and is composed of clayey sand, silt and riverine soil.The purpose of this work is to investigate the subsurface geologiccharacteristics of the area, using gravity data. The Bouguer gravity mapof the area (Fig. 3) compiled with a scale of 1: 100,000 and 1 mgalcontour interval by the General Petroleum Company (1985). Thefollowing steps were carried out:1) Qualitative interpretation of the gravity anomalies, to inft;jr thegeologic characteristics of the area.2) Trend analysis of the Bouguer map, to definesubsurface fault trends that affected the area.the surface and3) Separation of the anomalies, to identify the residual (local) featuresfrom those of regional nature using different techniques of separationsuch as (Griffin, Second vertical derivative and least-squares methods).4) Two-dimensional modeling of ten profiles were selected fordelineating the shape of the basement surface. In addition, the spectralanalysis and Euler deconvolution for the same profiles to determine thedepth to the basement.5) Two-dimensional Euler deconvolution to construct the gridepthsolutions for locations and depths of the area.QUALITATIVE INTERPRETATION.The Bouguer gravity map of the area (Fig. 3)'jscharacterlzed by thepresence of linear, oval and semicircular anomalies as well as areas ofgravity lows and highs. High gravity values are found in the westernpart
Abeer Abd El-Rehim El-Kenawy 3with the maximum value of 4 mgal and trending NE-SW direction.This may be due to limited thickness of the sedimentary cover or thepresence of dense rock sequence in [lis part compared to thesurrounding.On the other hand, some areas of low gravity are found inthe northern, central and.easternparts with the minimumvalues of - 25mgal.Generally, the Bouguer anomaly map shows three different trends.The first trend occupies the northwestern part and has nearly NE-SWdirection. It is represented by linear anomaly which may be associatedwith fault planes. The second trend is located nearly the central part withN-S. direction and is represented by oval shape anomaly of -25 mgal.The third trend is located at the western and eastern parts with NNE-SSW, direction and consists of two anomalies of semicircular shapeswith gravity values ranging between -6 and +4 mgal.QUANTITATIVE INTERPRETATIONThe quantitative interpretation is carried out using trend analysis,Griffin technique, second vertical derivative, least squares, modeling,spectral analysis, Euler deconvoluation, and construction of Gridepthsolutions using 2-D Euler deconvoluation.1- Trend analysisThe Bouguer anomaly map was analyzed and statistically studiesto determine the tectonic elements probably present in the area. The firsthorizontal gradient CVxz)is calculated along 56 profiles. From the resultof these calculations the first horizontal gradient map was constructed(Fig. 4). The deduced fault sites along all profiles are transferred andconnected together to give the structural pattern of the area (Fig. 5).The application of trend analysis reflects the main tectonic trendsaffecting the area and arranged according to their commulative lengthpercentage in 'the following six categories; Aqaba (Nl5" -25°E), Syrian(N45°-65°E), Suez (N35°-45°W), Mediterranean (E-W), Najd (N65°W)and East Africa (N-S) trends.The statistical study of the trend analysis revealed that 81 fault linesaffect the area. The results showed that the main azimuth distribution offractures is the Aqaba (N15°-25-:;E) which includes all lineamentsstriking from N15°E to N 30"E. The Aqaba trend belongs to the lateTertiary and Holocene orogeny (Tealeb, 1979b). The second important
4Delineation of the structural patterntrencf is Qattara (Syrian arc) trend N600E which includes alllineaments striking from N45°E to N65°E. This trend is considered as aPre-Cambrian trend reactivated dunng the Hercynian and LaramideOrogenies with some additional growth taking place in Late Tertiary andRecent time (Halsey and Gardner, 1975). The Suez trend (N35°W)includes all the lineaments striking from N35°W to N45"W. It isoriginated as a right lateral shear along which some strike- slip faults ofsmall displacements took place, and belongs to the Pre-Cambrian andwas rejuvenated during Hercynian(Pre-Carboniferous), Laramide (Late-Cretaceous) and Alpine (Late Tertiary) orogenies (Meshref et al., 1976and Bayoumi and Boctor, 1980).Tethyan or Mediterranean trend, which has a mean strike ofN85°Eand N85°W represents the Fourth order. This trend was interpreted as aresult of the northern compressive force affecting North Africa andrejuvenated during several orogenies, especially those related to the LateTertiary (Meshref et al., 1980). It is probably a common subsurfacecross trend in the Gulf of Suez and Red Sea fault blocks (Youssef, 1968;Meshref and El-Sheikh, 1973).Clysmic trend (Najed) includes all the lineaments striking betweenN500W and N70oW. It is one of the most profound fault systemsaffecting the Pre-Cambrian basement rocks and acting in the overlyingsediments in the Gulf of Suez and Red Sea region (Abd EI-Gawad,1969). This trend was developed as a shear and drag fold directionduring Jurassic Cretaceous time as a result of regional left lateral shearin the Tethyan region (Halsey and Gardner, 1975).East African trend (N-S) has the mean strike ofN5°E and NIOOW.Itis considered as a transitional trend that resulted dynamically from theLate Tertiary and possibly the Hercynian compressional stress folding.This trend is important throughout north and east Africa (Moody, 1973).2- Regional-Residual Separationa- Griffin's techniqueThe structural features affecting the study area can be enhanced byseparation the residual anomalies from the regional ones. One of thesimplest and accurate methods is Griffin's technique (1949). Thismethod has been applied in this' study using a regular grid of lkmspacing and eight points. The drilled wells indicate that the basementdepth ranges between 1.8km (Khatatba No. 1) in the,limit of the .'
A beer Abd El-Reltim El-Kenawy 5investigated area and more than 4km (Natrun) outside the area.Griffin's method was applied with radii of2, 3 and 4km in calculation ofthe three residual and regional maps.The regional and residual maps of 2km were chosen, which aremore convenient for the- basement depth in the area. The regionalanomalies map (Fig. 6) deciphers the presence of positive and negativeanomalies with different shapes. Most of these anomalies are runningNE-SW and NS directions.The residual anomaly map (Fig. 7) reflects the occurrence ofnumerous gravity highs and lows (local) running in NE-SW, N-S and E-W direction. These anomalies highlight the lithological and structuralfeatures capping the basement complex in the form of lower and higherdensities.b- Second vertical derivativeThe second vertical derivative technique (Henderson and Zeitz,1949) was applied on the,Bouguer anomaly map at depths of 2, 3 and 4Km. The selected map from these is the second derivative map at 2kmdepth (Fig. 8). The map shows the presence of alternating positive andnegative anomalies indicating structural blocks. Most of these anomaliesshow different forms and shapes, where closed and elongated anomaliesare mainly running in NE-SW and E-W directions. Some of theseanomalies are denser in contour lines (high frequency), while others areless dense (low frequency). This may be referred to the differences in.composition, depth and topography of the basement rocks. Five majorfault trends are detected at depth 2km, these are NW-SE, NE-SW, E-W,N-S and NNE-SSW.c- Least-squares methodThe Bouguer gravity map of the study area was subjected to aseparation technique by the least-squares method. Regional componentsof first, second,' third and fourth orders were fitted to the input data toobtainthe residualmaps. .The correlation between the different successive residual gravitymaps shows that, with increasing the order of separation, the frequencyof the anomalies decreases (Abdelrahman et al., 1985). Therefore, thefourth order map contains anomalies/ of more smaller and more circularshapes. In addition, the correlation coefficients (x) between thesuccessive residual maps were computed in order to determine theoptimum order of the regional surface..to be used. Results were rl2 =0.199, r23 = 0.977 and r34 = 0.809. According to Davis (1973) a value of
6 Delineation of the structural patterncorrelation factor, which is higher than 0.7 indicates a good similaritybetween th(.,maps.These methods give satisfactory results with the second orderresidual map, so as the second order can be selected as the optimumorder as described below.Figures 9 and 10 show the least-squares second order regionaland residual maps respectively. The second order residual gravity map(Fig. 10) shows three major anomalies in addition to some local onesthat have negative and positive nature trending NW-SE, NE-SW andNS. The first anomaly (a) is located at the northwestern corner of thearea. It has a positive nature, oval shape and large size. It trends NE-SWdirection. The second anomaly (b) is located to the right of the first one,it has a negative value and trends N-S. It is a large anomaly with contourvalues ranging from 0 to -13 mgal. The third one (c) is located East ofanomaly (b) with a positive nature and trending in NW-SE direction.The second anomaly (b) may reflect a sedimentary basin or synclinebetween two uplifted blocks (a and c). There are other small anomaliesof negative and positive nature located at the south, southeastern andnortheastern parts.3- Depth estimation methodsa) ModelingTen profiles were selected for modeling using GM-SYS prog~am,which is produced by Northwest Geophysical Associates Inc., USA(1995). The location of these profiles is indicated in Figure (11). Theinput data are the gravity values along the profile and the densitycontrast between the sedimentary and basement rocks (~p=O.25gm1cm3).The calculations of the models for these profiles producesatisfactory results. Figure (12) represent one example for the modelingtechnique.Profile P3: This profile runs in the NW-SE direction (Fig.12-a) andpasses near the Khatatba No.1 well. The depth to the basement is about1.1 km near the well and increases toward the south eastern part to about3 km.b) Spectral analysisSpectral analysis has proved to be a suitable tool for the directinterpretation of gravity and magnetic data. It gives sufficientinformation about the mean depth of the causative bodies. In thismethod, the potential anomalies in the space domain are transformedinto frequency domain and the vari0us parameters of the anomaly"
A beer Abd EI-Rehim El-Kenawy 7sources are derived from the characteristic properties of the amplitudespectrum. Several authors have proposed the spectral analysis techniquesfor tne analysis of the potential field data. Fourier spectral analysis hasbeen developed by Troshkov and Shalaev (1961), Spector (1968),Spector and Grant (1970), Treitel et al (1971), Cassano and Rocca(1975), Hahan et al (1976), Sadek et al (1984) and Mnniruzzamanand Banks (1989).According to Spector (1971), the depth (Z) of the anomaly sourcesare given from the slope of the straight line interpolating the diagram oflog normalized amplitude spectrum versus the spatial frequency usingthe following relationZ = - slope (1)Where: Slope = log A (w) I w and w = 211:for = the wave number atfrequency (t) where (t) is the general term for the frequency at any point.The results of Spector technique for the ten profiles are shown intable No. (1) while Figure (12-b) shows the spectral analysis for profileNo. (3).c) Enler deconvolntionEuler deconvolution is both a boundary fmder and a depthestimator. It is commonly used as a first step in the interpretation ofmagnetic or gravity data. The most important products are thedelineation of trends such as basement faults and estimates of theirdepths. The method can be expected to provide useful information aboutfaults and steeply dipping contacts and basin edges.The use of this method has become more widespread because it hasbeen automated and rapid interpretation that work with either grid orprofile data (Klingele et aL, 1991; Marason and Klingele, 1993;Harris et aI., 1996; Stavrev, 1997 and Barbosa et ai, 1999). It isnormally applied to grided data, where the data-sampling interval isuniform. It passes a moving window through the data, and uses leastsquaresinversion to obtain the depth and horizontal location of sourceswith different structural indices.
8 Delineation of the structural patternTable No'(l) Depth to the basement using Spectral analysis andKuler deconvolution methodsSpector technique Euler deconvolutionProfile(1971) (1994)No.kmkm1 1.5 3.8 .2 2.3 ' 2.23 1.9 1.34 2.2 25 2 56 1.6 17 1.7 1.78 1.5 1.39 1.8 1.810 2 1.1Usually the structural index (SI) is fixed and the locations anddepths (xO, yO, zO) of any sources are found using the followingequation:aj aj Ifax(x-xo) + cy(y - Yo)+ az(z - zo)=SI(B - f)Where f is the observed field at location (x, y, z) and B is the baselevel of the field (regional value at the point (x, y, z») and SI is thestructural index or degree of homogeneity (Reid et al., 1990). Thequality of depth estimation depends on the choice of the correctstructuralindex and adequate sampling of data.The application of Euler deconvolution technique to the Bouguergravity data was applied for both profiles and grid data. This techniqueis carried out using Geosoft, 1994 software with SI = 0 (gravity step)andwindow size = 10..>Table (1) shows the results of Euler for the profiles while Figure(12-c) shows the application for profile No.(3).
A beer Abd El-Rehim El-Kenawy 9Figure (13) displays the locations and distribution of the depth forthe whoL area, the depths range from 0 to 3.7km. It shows that thl:';areahas a few locations that having no symbols, these few localities mayconsider as locations of deep sedimentary basins with depth more than4km.Inspection of fIrst horizontal gradientmap, gravity map, residualmap of the least-square method and the Gridepth of the 2-D Eulardeconvolutionrevealed that the central part of the area is characterizedby the presence of thick sedimentary section (basin) of about 4.5km.There is a good agreementbetween the results fi'omdifferentmethods.SUMMARY AND CONCLUSIONSThe study area is located between Latitudes 30° 00 ~and 30°30~N, and Longitudes 30044~and 31°30~B, and occupies the southernpart of the Nile Delta. The 'data used in this study consist of a Bouguermap and borehole data of the wells inside and surrounded the area. Thegravity map was used to construct the structural regime of the basementcomplex. The trend analysis, GriffIn's, second vertical derivative, leastsquares,2-D modeling, spectral analysis and Euler deconvolutionmethods were used to delineate the structural pattern, sedimentary basinsand construct the Buler deconvolution map for the depth to the basementusing the Gridepth solutions result from 2-D Buler deconvolution.The obtained maps revealed that the area is affected by differentstructural trends throughout its geological history. These include, indescending order: Aqaba (N15°-25°E), Syrian (N45°-65°E), Suez (N35°-45°W), Mediterranean (E-W), Najd (N65°W) and East Africa (N-S)trends. In addition, one main depositional center in the area is displayedon the Gridepth n;lap with a depth of more than 4 km. This location isstructurally controlled and has conside!able interest for hydrocarbongeneration, accumulation and exploration.ACKNOWLEDGEMENTThe author is greatly indebted to Prof. Dr Abmed Samir,professor of Geophysics, Geology Department, Faculty of Science,Zagazig University, for his valuable support and for reviewing themanuscript.
10Delineation of'hestructural patternMEDITERRANEANSEANfD Study Area0[150 KmFig. (1): Location Map of the Stndy Area"MEDITERRANEANSEA1
Abeer Abd El-Rehim El-Kenawy 11311303O~- I ;/ (,3044 I0 5 10 15 20kmFig.(3): Bouguer gravity anomaly map of the study area(after G.P.C, 1985)C.I. 1mgalFig.(4):First horizontal gradient map of the study area
12 Delineation of the structural pattern~3030' " /?".-~ ,Y ""' / I ~/-- ./'"':::: "~---'j::::~:~/ "'~'~/\\ /~y ~._;~~'~ .~---:S--::- - \'-\..\ \\~~ . \ \ \ /1,:;: \/ ' ~ \.\\ i. \ \\ I.\' /' )/ '--- \ I '\ ~ I. I , \~ f I l' \\"- - 0'--' 'I\\ \\\" \ \ Iy" "'''- ,-' .-(/ . \-\/ ,-" ~/ 1'\ '\\I,f . \ \f/. If. ~ \ L '\\ \I i r --
Abeer Abd EI-RehimEI-Kenawy13~m,,~3030r44Fig.(8):Second vertical derivative map at depth 2 km.
14 Delineation of the structural pattern3'j:30.50 31.00 ~\31,30iI!-. ~~t:~::~ -~~--=---~= -14----14-------9.\ \3010 ..,'.s>...Fig.(9): Least squares second order regional map C.I.1mgal3~.-30,50 31,00 31110 31.20.-- / ::...>32--'i~:O'6'! \\(\\.=.'--"" 7r~,le'!,' .\ '\ -3010'-31'30Fig.(10): Least squares second order residual map. C.I. 1 mgal
Abeer Abd El-Rehim El-Kenawy 1531130..~~Fig.(11): Location map of the profiles for the modelling technique
16 Delineation of the structural pattern- ~(n}t-~ -22 ~~. ~ ..,'.~-:'.30.1000..t 100e2000--- 4.:.-t"~1i.~"t>'.....1i~~-~I-I)(b)\V\f'- nf~"'''' (C),,- ''',,'.0 :2 ., '6 9'"' i~". ""'"~...'-'" ..=- ~~_."", """Fig. (12): Depth Estimatiom for Profile (P3) using a) Geosoft.b) Spector and c} Euler Decanvolution methods,
Abeer Abd El-Rehim El-Kenawy 17..I:tt311A. I.A& 0 +f201#Aa.,.06 t. .A 1+>** I>+ ...",.4s J3r+ +1+0-1km (+)2-3km (D)31130Fig. (13): GRIDEPTH solutionsmap
18 Delineation of the structural patternREFERENCESAbd El Gawad, M., 1969: New evidence of transcurrentmovementsinRed Sea area and petroleum implications. AAPG. Bull., No. 53,pp. 1466-1479.Abdelrahman, E.M., Raid, S., Refai, E. and Amin, Y., 1985: On theleast-squares residual anomaly determination. Geophys. Vol. 50,pp. 473-480.Barbosa, V.; Slivg, J. and Medeiros, W., 1999: Stability analysis andimprovementof structural index in Euler deconvolution.Geophys.,Vol.64,No.1, pp.48-60.Bayoumi, A. I. and Boctor, J. G., 1980: A contribution to gravityanomaliesin Gulf of Suez region, Egypt. Ann. Geol. Surv. Egypt.,Vo1.10,pp. 1027-1035.Cassano, E. and Rocca, F., 1975: Interpretationof magnetic anomaliesusing spectral estimation techniques. Geophysical Prospect, V01.23, pp. 663-681.Davis, J. c., 1973: Statistics and data analysis in geology. John Wileyand Sons,Lnc. New York., 500 p.General Petroleum Company (G.P.c.), 1985: Gravity map of Egypt.EgyptianAcademy of Scientific Researchand Technology,Cairo.Geosoft Incorporated, 1994: Geosoft PackageGM-SYS., 1995: Gravity and magnetic modeling, version3.6;Northwest Geophysical Association, Inc. (NGA), Corvallis,Oregon,U.S.A. 97339.Griffin, W. R., 1949: Residual gravity in theory and practice.Geophysics.V01.14,No. 1, pp. 39-56.Hahan, A.; Kind, E. G. and Mishara, D. C., 1976:Depth estimationofmagnetic sources by means of Fourier Amplitude Spectra.Geophys.Prosp.,Vo1.24, pp. 287-308. .Halsey, J. H. and Gardner, W. C., 1975: Tectonic analysis of Egyptusing earth satellite data. Lecture given to Egyptian geologists,Cairo, Egypt,pp. 1-23.Harris, E.; Jessell, W. and Barr, T., 1996: Analysis of the Eulerdeconvolution techniques for calculating regional depth tobasement in area of complex structures.SEGAnn. Intern. Meeting.Henderson, R. G. and Zeitz, I., 1949: The computation of secondvertical derivative of geomagnetic fields. Geoph., 14, No. 4, pp.517-534.
Abeer Abd El-Rehim El-Kenawy 19Klingele, E. E.; Marasn, L., and Kahle, H. G., 1991: Automaticinterpretation of gravity gradiometeric data in two dimensions:verticalgradient. Geophys. Prosp. Vol. 39, pp. 407.Marason, L. and Klingele, E. E., 1993: Adventageof using the verticalgradient of gravity for 3-D interpretation. Geophys., Vol. 58, pp.349-355.Meshref, W. M. and El Sheikh, M. M., 1973: Magnetic tectonic trendanalysis in northern Egypt. 1. Geol., Cairo, Egypt, Vol. 17, No. 2,pp. 179-184.Meshref, W. M.; Refai, E. M. and Abd El Baki, S. M., 1976:Structural interpretation of the Gulf of Suez and its oilpotentialities.E.G.P.C., Fifth pet. Explor. Semen. Cairo.pp. 1-20.Meshref, W. M.; Abd El Baki, S. H.; Abd El Hady, H. M. andSoliman, S. A., 1980: Magnetic trend analysis in the northern partof the Arabian-Nubia shield and its tectonic implications. Ann.Geol. Surv.,Egypt, Vol. 10,pp. 939-953.Moody, J. D., 1973: Petroleum Exploration aspects of wrench faulttectonics.AAPG. Bull., Vol. 57,No. 3, pp. 449-477.Muniruzzaman, M. and Banks, R. J., 1989: Basement magnetizationestimatesby wavenumber domian analysisof magnetic and gravitymaps. Geophs.1.,Vol. 97, pp. 103-117.Reid A. B.; Allsop, J. M.; Granser, H.; MilIett, A. J., and Somerlton,I. W., 1990: Magnetic interpretationin the three dimensionsusingEuler deconvolution.Geophys.,Vol. 55,pp. 80-91.Rizzini, A.; Vezzani, F.; Coccoccetta, V. and Milad, G., 1978:Sedimentationof Neogene-Quaternary section in Nile Delta area,5!hExplorationSeminar, LE.O.C.Sadek, H. S.; Rashad, S. M. and Blank, H. R., 1984: Spectralanalysisof aeromagneticprofiles for depth estimation.USGS-OF-04-27.Shata, A. and EI-Fayoumi, I., 1969: Remarks on the regionalgeologicalstructure of the Nile Delta. Desert Ins. Mataria,Cairo.Spector, A. and Grant, F. S., 1970: Statisticalmodels for interpretingaeromagneticdata. Geophysics.Vol. 35, No. 2, pp. 293-302.Spector, A.,1968: Spectral analysis of aeromagneticdata. Ph.D., Thesis,Dept. Phy., Fac. Sci., Toronto Univ., Toronto, Canada, 167p.Spector, A., 1971: Aeromagnetic interpretationwith the aid of a digitalcomputer,Canad.Inst. Min. Bull., 64, pp. 27-33.
20 Delineation of the structural patternStavrev, P., 1997: Euler deconvolution using different similaritytransformation of gravity or magnetic anomalies. Geophys. Prosp.,Vol. 45, pp. 207-246.Tealeb, A., 1979b: Predominant tectonic trends in the north Egypt.Bulletin of the Helwan Institute of Astronomy and Geophysics189.22 pp.Treitel, S.; Clement, W. G. and Kaul, K., 1971: The spectraldetermination of depth to buried magnetic basement rocks.Geophysical Jour. Res. Astr. Soc., Vol. 24, pp. 415-428.Troshkov, G. A. and Shalaev, S. A., 1961: Application of the Fouriertransform to the solution of the reverse problem of gravity andmagnetic survey. Prehl., Geofiz., No. 30, pp. 162-178.Youssef, M. I., 1968: Structural pattern of Egypt and its interpretation.AAPG. Bull.,Vo1.52. NoA, pp. 601-614.
Geophys. Lett., 1 (2008) 21-;53PETROPHYSICAL STUDIES FOR RECOGNIZINGREEF RESERVOIRS IN OIL PROSPECTION INRAS GHARIB, AND SHOAB GHARIB OILFIELDS, GULF OF SUEZ, EGYPTGhalib, M.*; Nadia, M.* and Farrag, Kh.* Cairo University, Faculty a/Science Egypt,Geophysics DepartmentABSTRACTThe present study is concentrated on the Middle MioceneNullipore rock (Hammam Faraun Member) of BelayimFormation in Ras Gharib, and Shoab Gharib oilfields Gulf ofSuez. This Member is taken as example in the present study tocarbonate build-up or reefs. The study is an attempt toillustrate how we can recognize and interpret the section ascarbonate build-up (reefs) by using petrophysical study. Thereare different subjects which most be carried, to reach to the aimof study, which include: Interpret or identify the lithology ofthe section, examine the radioactivity recorded by Gamma raylogs, examine the presence of secondary porosity, and examinetlte vertical and horizontal petrographic variation (zonation) inthe formation or section. The results of these subjects include;the interpreted lithology of the Nullipore section in the studiedarea is limy dolomite(dolomite log response), the section ischaracterized by secondary porosity related to vuggy porosity,gamma ray log record high readings in the interval of thesection which is related to organic matter, the section ischaracterized by vertical and lateral variations in the responsesof the different logging tools which reflect the petrographicvertical and lateral variation in the section which arecharacteristic features to reefs, the evaluation to the sectionindicate suitable porosity and permeability range to the sectionto be as a potential reservoir, also the evaluation to the sectionindicate that it is hydrocarbon bearing in different zones of thesection.
22 Petrophysical studiesfor recognizing reefINTRODUCTIONRas Gharib oil field is located some of 220 km. south of Suez townon the western coast of the Gulf of Suez, Shoab Gharib oil field lies inthe adjacent offshore area and proved to be an extension to Ras Ghariboil field Fig. (1) (El Naggar, 1988). The term Nullipore rock wasfirstly applied by Moon and Sadek (1923), and considered by theStratigraphic Sub-committee (1974) as an equivalent to theHlJIllillamFaraun Member of the Belayim Formation of the MiddleMjocene. It is considered to be deposited under shallow marine warmwater conditions, which were favorable for reefal development,(Kulke, 1982, Chawdhary and Taha, 1986 and El Naggar, 1988).The stratigraphy of the formations penetrated in Ras Gharib area isobtained from subsurface information of drilled wells, it consists ofsedimentary successions ranging in age from Cambrian to RecentFig.(2) (Khattab and Hadidi, 1961 and El Naggar, 1988). Thegeologic structures of all the oil fields (among them are Ras Gharib,and Shoab Gharib oil fields) of the Gulf of Suez are strongly related tothe formation of the gulf itself which is a huge rift graben withsuccessive block faulting away from its center and parallel to itsextension (Said, 1962, Moustafa, 1993, Gobashy, et ai, 2000, Jordi,1984 and El Naggar, 1988).The aim of the study is to illustrate how we can recognize andinterpret the section as carbonate build-up (reefs) by usingpetrophysical study. The present study is concentrated on theHammam Faraun Member of Belayim Formation of the MiddleMiocene in Ras Gharib, and Shoab Gharib oil fields Gulf of Suez,Egypt. There are different subjects which most be carried, to reach tothe aim of study. By conjunction between these subjects, we can saythat the section is carbonate build-ups or not, and these subjectsinclude:1- lithologic identification to the studied section as follows:a) Identification of lithology by the readings and response ofneutron and density logs.b) Identification of lithology by neutron-density cross-plots.c) Identification of lithology by M-N cross-plots.
Ghalib, M. et. aL 232-Related the radioactivity recorded by Gamma ray logs to thepresence of organic matter.3-Examine the presence of secondary porosity and related it to vuggyporosity or not as follows:a) Identify secondary porosity according to the difference in porositydetermined by using sonic logs and porosity calculated by densitylogs.b) Identify secondary porosity on the M-N plots, according toshifting of the plotted points toward secondary porosity.c) Related the main parts of secondary porosity to vuggy porosity,according to the readings of the bulk density correction curve(flp).4- the most important properties is to examine the presence of thevertical and lateral variations (zonation) in the formation or sectionwhich is important characteristic feature to reefs.5- Petrophysical evaluation to the interpreted Nullipore section.The following subjects are the basis to interpret the HammamFaraun Member in the studied area, as carbonate build-up (reefs) byconjunction between these subjects:1- lithologic identification:The neutron and density logs are difficult to be used separately toidentify lithology, but when they are combined and plotted oncompatible 1/1 scales they are used as lithology and porosityindicators (Rider, 1986). The M-N cross-plots are used to determinelithology, and as detection to secondary porosity, where the data of theporosity logs sonic, neutron, and density are combined to provide thelithology dependent quantities M and N (Schlumberger, 1972).a) Identification of lithology by readings and response of neutronand density logs:On the neutron and density logs, to the available wells representedon the shoot points and well location map Fig. (3), the neutron logsread higher porosities than the porosities calculat~d from density logs,the response of the neutron and density logs indicate positiveseparation, and the separation is more or less constant, but theabsolute values may change with the change in porosity or the change
24 Petrophysical studiesfor recognizing reefin anhydrite content. These characters indicate that the lithology ismade up mainly of dolomite (carbonate). These are illustrated on thelog presentations to some of the available wells on Figures. 4 - 8.b) Identification of lithology by neutron-density cross plot:The lithology can be identified, by plotting the neutron-density crossplots to the Hammam Faraun section of the available wells. Theneutron-density cross plots, to the Hammam Faraun section in theavailable wells, reflect a Dolomite log response (carbonate) asindicated on Figure 9, which indicates the neutron-density cross plotsof the Hammam Faraun Member in some of the available wells.c) Identification of lithology by M-N cross plot:Sonic, neutron, and density logs are available in wells- 224 and 252,the M-N cross-plots to the Hammam Faraun Member in these twowells indicate that the lithology is limy dolomite (carbonate) asillustrated on Figure 10, which represents the M-N cross plots of theHammam Faraun Member in the two mentioned wells.2- Organic matter in the section:The gamma ray log is one of the most frequently used logs forcorrelation, where it has repeatable character; it is not effected bydepth. Carbonates in their pure states are not radioactive and this aidstheir identification- but carbonateswhichcontainorganicmatterarefrequently radioactive due to uranium contents (Schlumberger,1974).The identified lithology to the Hammam Faraun sequence iscarbonate. The Gamma ray logs record high radioactivity to theHammam Faraun section in all the available wells, this radioactivitymay be interpreted as due to the occurrence of organic matter (bearinguranium), which means that the section may be carbonate build-up(reefs).3- Secondary porosity and related it to vuggy porosity:The sonic log only records matrix porosity (primary porosity), whilethe neutron or density logs record the total porosity. Secondaryporosity can be determined by subtracting the sonic porosity from thetotal porosity (neutron or density porosity). The bulk densitycorrection curve (L\p)can be used to relate secondary porosity to
Ghalib, M. et. al. 25vuggy porosity or not. When the bulk density correction curves (~p)show low reading, in this case the secondary porosity (the main partsof it) is not due to the fracture, but the main parts of the secondaryporosity, in this case, is related to vuggy porosity (Asquith andGtbson, 1982).By comparing the calculated porosities by sonic log and density login wells- 224 and 252 from Ras Gharib oil field, it is observed that theporosity calculated by density log is higher than that calculated bysonic log, this point to the presence of secondary porosity. The antherindicator, which represents the presence of secondary porosity in theHammam Faraun Member, is represented by shifting of the plottedpoints toward the secondary porosity on the M-N cross plots, asshown on the M-N cross-plots to the Hammam Faraun Member inwells-224, and 252 Fig. (10), as an example.We can relate these types of secondary porosities to vuggy porosity,which is very good indicator to that the section is carbonate build-up.This indication was carried out by using the bulk density correctioncurve (~p). By looking on the density logs in the available wens onthe log presentations of these wells, we found that the correctioncurves (~p) read very low values in these wells at the interval ofHammam Faraun Member. These indicate that the secondaryporosities are not due to fractures only, but the main part of it is due tovuggy porosity, which is a good indicator that the section is carbonatebuild-up.4- The vertical and lateral variations in the Hammam Faraunsection (zonation):The reefs are characterized by the minor geologic vicissitudes(variations) during its growth and subsequent history, which lied tothe horizontal and vertical variations in chemical composition, geoelectriccharacteristic and lithologic and porosity types within thereefs. These are the basic factors, which are used to differentiate thereef section into geo-electric zones (Waring and Layer, 1950). ElKadi et al. (2000) differentiated the Nullipore section in Ras Fanar oilfield into three distinctive rock types according to its capacitypressure, permeability, and density-neutron log response, which can
26 Petrophysical studies for recognizing reefbe traced laterally along the field. Wegdan (1995) on her study on theNullipore section in Ras Fanar oil field subdivided the Nulliporesection into nine electro-litho facies zones underlain by a carbonatebody (basal beds), depending on petrographic and well loggingstudies.The Hammam Faraun sequence in the available wells is subdividedinto electric-litho zones, according to the response of the succession tothe log tools (Gamma, neutron-density, and sonic logs), and thedetermined porosity ranges (obtained from neutron-density crossplots). This indicates the variation in the petrographic characters of theNullipore rock:Firstly the sequence is subdivided in each well into zones, asrepresented on the log presentation to some of the available wellsFigs. (4 - 8), these subdivisions represent the vertical change in thepetrographic characters of the sequence (which characterizes thereefs). According to the preceeding deductions the Hammam Faraunsequence is interpreted as carbonate build-up (reefs).According to the correlation between the electro-litho zones in theavailable wells, based on the response of the zones to the log tools,and the porosity range determined from the neutron-density crossplots, and the stratigraphic position of each zone to the other zones inthe available wells, the Hammam Faraun sequence (in the arearestricted to the available wells) is subdivided into main nine electrolitho-zones, the zones are arranged from the younger to the oldest bythe Latin numbers I to IX.The neutron density cross-plots to the main electro-litho zones arerepresented on Figs. (11 - 12), the occurrence (stratigraphic position)and the distribution of the e1ectro-litho zones in the available wellsrepresent the lateral facies change in the Hammam Faraun sequence,which is commonly characterizes the reefs (but the completecorrelation to the zones in the area can not be carried due to littleavailable data). According to the conjunction between the precedingdeductions the Hammam Faraun sequence in the available wells isinterpreted as carbonate build-ups.1 -The electro-litho zone I:.
Ghalib, M. et. al. 27This zone is the upper zone in wells no. 6, 7, 224 and 252 of theHammam Faraun Member. It lies under the lower' anhydritic unit ofSouth Gharib Formation in these wells. The neutron-density crossplotsto this zone represent porosity range between "0.07 to 0.20" asshown on Fig. (11), the drilled thickness of this zone is 15 m. in well-6,21 m. in well-7, 8 m. in wel]-224, and 30.5 m. in well-252.2 - The electro-litho zone 11:This zone is the upper zone of Hammam Faraun Member in well-9,it underlying the lower anhydritic unit of South Gharib formation inthis well. It is the second zone in wells- 6, 7, and 252. The neutrondensitycross-plots to this zone represent porosity range between "0.20to 0.30" as shown on Fig. (11). The thickness of this zone is 63.5 m. inwell-9, 13.5 m. in well-6, 45 m. in well-7, and 4.5 m. in well-252.3 - The electro-litho zone Ill:This zone is present in wells-19 and 24. It is underlying the loweranhydritic unit of South Gharib formation in these two wells. Theneutron-density cross-plots to this zone porosity range between "0.04to 0.12" as shown on Fig. (11), the drilling thickness of this zone isabout 16m. in well-19, and 10.5m. in well-24.4 - The electro-litho zone IV:This zone is present in wells-9,20, and 19, the neutron-densitycross-plots to this zone, Fig. (11) represent porosity range between"0.30 to 0.45". The drilling thickness of this zone in well-9 is about 42m., in well-20 is about 75 m., and in well- 19 is about 38 m.5 -the electro-litho zone V:This zone is present only in well-6, the neutron-density responsedifferentiate it from the underlying and overlying zones; the neutrondensitycross-plot to this zone represents porosity range between "0.12to 0.18" as shown on Fig. (11), the drilling thickness of this zone inwel]-6is about35 m.'6 -The electro-litho zone VI:This zone is present in wells-6, 9, 19, 24, 224, and 252. The neutrondensity cross-plots to this zone represent porosity range between "0.20to 0.26" as shown on Fig. (11), the/drilling thickness of this zone inwell-252 is 16.5m. , in well-224 is 14.5m., in well-24 is 8m., in well-19is 10m., in well-9 is 13.5m, and in well-6 is 6.5 m.
28 Petrophysical studiesfor recognizing reef7 -The electro-litho zone VU:This zone is present in wells-6, 7, 9, 20, and 19. The cross-plots ofneutron-density readings to this zone represent porosity range between"0.25 and 0.35" as shown on Fig. (12). The drilling thickness of thiszone in well-6 is about 6 m., in well-7 is about 45 m., in well-9 isabout 24 m., in well-20 is about 35 m., and in well-19 is about 11 m.8 - The electro-litho facies zone VIII:This zone is present in wells-7, 9, 20, 1924, 224, -and 252, it isabsent in well-6. The neutron-density cross-plots to this zone representporosity range between "0.17 and 0.27" as shown on Fig. (12), thedrilling thickness of this zone is about 20 m. in well-7, 25.5 m. inwell-9, 14 m. in well-20, 110 m. in well-l 9, 17 m. in well-24, 15.5 m.in well-224, and 11m. in well-252.9 -the electro-litho facies zone IX:This zone is present in wells-6, 9, 20, 19, and 24. It is the bottomzone of the Hammam Faraun Member in the above mentioned wells.The neutron-density cross-plots to this zone represent porosity rangbetween "0.22 and 0.30" as shown on Fig. (12). The drillingthicknesses of this zone is about 13.5 m. in well-6, 8.5 m. in well-9, 11m. in well-20, 12m. in well-19, and 6.5 m. in well-24.Broad classification of Nullipore rock into three main groups~The preceding zones can be grouped, in broad mean, into three mainelectro-litho groups, based also on the response of the Nullipore rockto the log tools, and on the porosity range obtained from the neutrondensity cross plots as follows:The first electro-litho group: -This group is characterized by porosity range (obtained from theneutron density cross plots) ranging between "0.4 to 0.20" as shownon Fig. (13), which representsthe neutron densitycross plot to the Imain electro-litho groups. This group includes the electro-litho zonesI, III and V.The second electro-litho group:The neutron density cross plots to this group represent porosityrange between "0.20 to 0.30" , as shown on Fig.(13). This groupincludes the electro-litho zones 11,VI, VIII, and IX.
Ghalib, M. et. aL 29The third electro-lithogroup: .This group is differentiated from the other two groups by its porosityrange (obtained from the neutron density cross plots), ranging between"0.30 to 0.45" as shown on Fig. (13), this group includes the electrolithozones IV and VII. .The broad grouping of the Nullipore rock in Ras Gharib and ShoabGharib into three main electro-litho groups coincides with El Kadi etai, (2000) subdivision to the Nullipore rock in Ras Fanar field intothree main groups, where there is similarity between the groups hereand there.The above mentioned geologic vicissitudes (vertical and lateralvariations) in the Hammam Faraun Member are very characteristiccriteria which attribute this section as carbonate build-up (reef). Theconjunction between this criteria and other subjects deducted early inthis chapter such as: the determined lithology (which illustrate that thesection is composed mainly of limy dolomite), the domination ofsecondary porosity and relating it to vuggy porosity, all the abovedetermined characteristic properties are combined to give reasons thatthe Hammam Faraun section in the studied wells is carbonate build-up(reef).Petrophysical evaluation of the Nullipore rock:In the above discussion the interpreted lithology of the NulIiporesection in the available wells is limy dolomite with considerablecontents of anhydrite especially in certain horizons (interval), such asthat interpreted, in the interval from 833 to 841 m. in well-24,according to the density log reading which reach to 2.85 G/CC.The main part of the secondary porosity is related to vuggyporosity, according to the readings of the bulk density correctioncurves in the available wells./The Nullipore section in the available wells is subdivided into zones,according to the responses of the different logging tools whichrepresent vertical variation in the petrography, which may refer toreefs. The zones in all the available wells are compared, and the main
30 Petrophysical studiesfor recognizing reefelectro-litho zones are obtained, this compression represents thelateral vBL,ationin the section, which is a characteristic feature toreefs.The caliper log, which recorded a hole size smaller than the bit size,and the log has smooth profile, is an indicator to permeability of theformation, where only permeable beds allow mud-cake build-up. Thebed opposite the deflection on the SP log is permeable, and theamount of deflection however does not indicate the amount ofpermeability (Rider, 1986).In the case study of the Nullipore section (Hammam Faran Member)in the available wells the caliper log is not on-gauge, but its readingsare smaller than the bit size with smooth profile as represented on Fig.(14), which represents some of the recorded logs in well- 252 asexample. This case indicates that the formation (Nullipore section) ispermeable. Also the SP log on the figure showing negative deflectionwhich also indicates that the section opposite deflection (Nulliporerock) is permeable.Then bulk volume water (BVW) can be taken as indicator to Igrainsize, where the bulk volume water increasing with decreasing grainsize. Also vuggy porosity has very low values for irreducible watersaturation, and then has very low values for bulk volume water. Bulkvolume water (BVW= Sw * ) calculated at several depths of theformation, when it is constant or very close to constant, this indicatethat the formation is at irreducible water saturation (Asquith andGibson, 1982).Log derived permeability formula is only valid for estimatingpermeability in formations at irreducible water saturation, amongthese formulas is the Timur formula as follows (Asquith and Gibson,1982):Where:KI\O.5=KSwirrlOO(1\2.25/Swirr)is permeability in mi1.darcy.is porosity.is irreducible water saturation.
Ghalib, M. et. aL 31The bulk volume water, calculated in the available wells to theNullipore section, indicates that it is near to be constant or close tocopstant. This refers that the formation is in irreducible watersa~ration. In well-252, as an example, the BVW plotted curve onFigure-14 exhibits that the calculated bulk volume water rangingbetween, 0.06 to 0.07 which is an indicator that the zone is composedof very fine grain size. The bulk volume water in the section changesin little parts to be decreased. These decreased values in the bulkvolume water may be not related to increase in grain size, but it isrelated to vuggy porosity (where vuggy porosity has low values forbulk volume water).From the calculated water saturation and hydrocarbon saturation, wefound that the Nullipore section in well-252, as an example, is stainedwith hydrocarbon in zones (stained hydrocarbon zones), whichintercalated with wet zones (water bearing zones) as represented onFig. (14).The qualitative interpretation to the resistivity logs indicate that thewet zones are related to shallow resistivity (LLS) and deep resistivity(LLD) with no separation in readings. In zones which are stained withhydrocarbon, there is an increase in the readings of the deep resistivity(LLD) than the shallow resistivity (LLS) with small separation. Thisseparation is an indicator to hydrocarbon staining as shown on Fig.(14), as an example which represents some of the recorded logs inwell-252.Log derived permeability formula is used to calculate permeabilityin well-252 as an example. The calculated permeability is rangingbetween "20 to 620 mil.darcy" in zones, these high permeable zonesintercalate with zones of less permeability ranging between "0.2 to 2mil.darcy". These intercalated permeable and less permeable zonescoincide with intercalation between hydrocarbon zones and waterbearing zones as represented on Fig. (14).The Elan program is used in petrophysical evaluation of the studiedwells. This program gives a quantitative .determinationof porosity,
32 Petrophysical studies for recognizing reefhydrocarbon saturation, and mineral volume fractions. It is based onthe minimization of th:~differences of the actual and reconstructed logreadings for the mineral/fluid model chosen. The linear and non-lineartool response equations for the various tools are building into theevaluation package. Hydrocarbon corrections to the density andneutron tools are carried automatically.The outputs from Elan to Nullipore section in wells-7, 20, and 24 asexamples is represented on figs (15), (16), and (17). Those include themineral volume fractions, which represent that the lithology ofNullipore section is limy-dolomite with some anhydritic contents insome intervals. Also the Elan outputs include the volumetric fractionsof the fluids content (hydrocarbon and water). This represents that theNullipore section is a potential reservoir, with hydrocarbon bearing.inmany wells.SUMMARY AND CONCLUSIONSThe Middle Miocene Nullipore rocks of Belayim Formation in RasGharib, and Shoab Gharib oil fields are taken as example in thepresent study. The aim of the study is to illustrate how Wtf canrecognize and interpret the section as carbonate build-up (reefs) bypetrophysical study.The neutron logs (on the available wells) read higher porosities thanthe porosities calculated from density logs, the response of the neutronand density logs indicate positive separation, which is more or lessconstant, but the absolute values may change with porosity or changein anhydrite content. These characters indicate that the lithology ismainly dolomite (carbonate).The neutron-density cross plots and the M-N plots to the HammamFaraun section of the available wells reflect a dolomite log response(limy dolomite).Gamma ray logs, to the Hammam Faraun section, record highreadings in all the available wells. Where the section is interpreted aspure carbonate, then this radioactivity can be interpreted as due to the
Ghalib, M. et. al. 33occurrence of organic matter (uranium), which means that the sectionis carbonate build-up (reefs).Secondary porosity was interpreted on the section, due to theporosity calculated by density log is higher than that calculated bysonic log and by shifting of points toward the secondary porosity onM-N cross-plots. The readings, of the density correction curves (Llp),were used to represent that, the secondary porosity is not due tofractures only, but the main part of it is due to vuggy porosity whichindicate that the section is carbonate build-up., The Hammam Faraun sequence was subdivided into main nineelectro litho-zones. These subdivisions represent the vertical andlateral change in the petrographic characters of the sequence (which isa characteristic features to reefs), then the sequence is interpreted ascarbonate build-up (reefs).Nullipore rock in Ras Gharib and Shoab Gharib oil fields can besubdivided, in broad mean, into three main electro-litho groups, basedalso on the response of the Nullipore rock to the log tools, and on theporosity range obtained from the neutron density cross plots. Thebroad grouping of the Nullipore rock in Ras Gharib and Shoab Gharibinto three main electro-litho groups coincides with El Kadi et al(2000) subdivision to the Nullipore rock in Ras Fanar field into threemam groups.The obtained results(by conjunction between the deducted subjects)indicate that the studied section is carbonate build-up (reefs), withsuitable porosity and permeability range to be as potential reservoirs,also the evaluation to the section indicate that it is hydrocarbonbearing in different zones of the section.
34 Petrophysical studiesfor recognizing reef32°-~~.~,~~~=--~-~~!'""--33°134"IIEOITEAAANEANSEA,WATAANA, ASLEGYPT29'R AS IjUORAHZ9EASTERt~DESERT9ELAYI~ tI..NARINE
Ghalib, M. et. al.35!AGEI:::",1\I!ONIAN"",.Rock UI\i'SODi3OdPOSTZEITLltholoqy€>< ::::::::i::::.:--::..:-:.':-:':'.......- '",e..... '..m .-. Li'hologle Dcsc,lpllon1200MATOLLA1»:-:,:-:-:-:,;,\1 400-500~n'.......... .WATA .......... 24040180230420Sonds'ono; Crs o,olnirrlc,bc!a.od tOQoonol ba.1ndeposiltng onilydrltl wi.hOtI opisodeo 01 olalOkli"flu..(d.,11I\I :r.lt-FIShotlow..0"" bloclo
36 Petrophysical studies for recognizing reef~Q'I(NN---._--z~Q'I816 816818818820GO.....GO~GO...GOFig. (3): Shoot-pointsand wells location map of the studied area.
Ghalib, M. et. aL 37Southi Rock:Hammam FaraunMemberGbaribunitsNullipore rock-- Formation i--- - - reefs f'0 ,:010.0 ,:; I;i -,.,1-:'":"! " ajt1I" Jo.. '" "- ..CJ' ' Iz. --.J' -' ---'0-
38Petrophysical studiesfor recognizing reef.., I:.= =;:= := :tl~ = I:j r. == N" ~ r-ij-.....c ".f.e 180." i' E~:4'iOi Jjftl.L :J50"iII TT -II.41~iEl4Ir.~.....c~:le).!elI.eEO..2-E=Ei.%700uns0~T0 ."'-~ -3'7CAIV770800VI..tffvu ;t,_.IL- ... ......... ...-,VIUI '--~". ...,...............1",.-- .--IX I-~ Zone IllID Zone VIItlITlIB,.Zone IVZone VIIII-..Ill:;;9r5:=-Zone VI~;;~%"11Zone IXFig (5): Mirror gamma ray, density, and neutron log presentation of theNuIlipore section in well -9 represent the zonation ofthe nulIiporesection at this well. ..
Ghalih, M. et. aL 39,I SouthRock units i I .Gharlb- - --- - -- Formations:~'c::oo.~ ,go,'In ,In:~~'~::-'(:11,ca: ::E:.00:'-=a:.-'-:.....,.:
40 Petrophysical studies for recognizing reef., Rock units I South Gbarib P;t:.nr::.~""- F08"l'1natlon' ~.:.m~~..1!; .~.' ~IT . -. ',0;; t ~;; ==&;::- :111 '-~'P~ . -..-.-~ I .,. ... - ."'t~ ~--Jl .a.. \,...~. .~ r,@1',. ' ~.'\.:g t.r,. ..:g 1:3/'1>'.'."" '..electrou~o - - =z..ones I '"' ~ >-"4~~ :~ ~ \' : .. I_i~ : T I . . ..~i ! I.' ~~!-I ..-n.. "" -.- - ~..,' r . --i~ ! ~ h.--'-'-",,: ~ = I.:~ ~j i.~ I.. :- i= "E- ~ a-'-;;:;... ~ 'I.1= ,. ".u ': 11 ; ".::;: I:;: Ii', I' I.PT::;,"".: 1- - ""'''. If1'1 ,., I I~ '11. If I~C:;YQ .", 0000 ..~ _00 """0::; iOi! I r "IZone I-Zone VI-Zone VIIIFig.(7): Mirror gamma ray, density, neutron, and sonic logs presentation of theNullipore section in well-224 represent the zonation of the nulliporesection in this well.
Ghalib, M. et. aL 41--;;>s:Rock units South Gharib! H............. _r....... M.....bitr'I (NulUpore rock), .!Electrolitho- -i Zones I...-, ,1;i=I, -ill. ":,: p!'" 8' I [I-, , ( 1'" .: >1 .1::,-:!; .1 '. .. 1 f:1i -,;;: I 1-i'1Q','\,.:r-.I': ...I'8". LLf. III ...'"'"J -' , M.i i:I ..r- II- iI - 11 II' III 111... H- t-1-7..no_...- ,...,91,.... "'i1:fl"i11I= . . - _. -,'I.II1.&-1 If; I 1 "liIll't:E1111!A-IU....--."'" 7_ T r! mE '7- - TTZone VIIIFig (8): Log presentation to the Nullipore section in wen -252 exhibiting thezonation ofthe nullipore section.I1I1,
42 Petrophysical studiesfor recognizing reefu-t.)eE.!i:'iijI:Cl)...'C.¥'3r:ou-t.)eE.!~UiI:.~ 'C'"'3r:oNeutron porosity, (apparent limestone)Neutron porosity, (apparent limestone)t.) ,t.) ,.e"E.!'i:'iijI:~.¥'3mNeutron porosity, (apparent limestone),",. ,','.'.T~"iC,'"". ", ",'," "."',.'""..,,''','Neutron porosity, (apparent limestone)well-224,.u-~ EE.!~'iijc:Q)'C'"'3 r:oNeutron porosity, (apparent limestone)well-252Fig (9): The neutron density cross-plots of the Nullipore rock in wells-6, 9, 24, 224, and 252respectively, that reflect a Dolomite log response (limy dolomite) for Nullipore rock,
, 0°"IIIC.y.,,~umGhalib, M. et. aL 43-J~'\- cl!!..-- -.-Se='.,,~ry -~,P' --I--+,O''''''W II,:.~~;;-~:.;';~::,- --I i--i-f-- 1--"'- OUM~ ~."t'",OM".8""""'. ..,- '" ,,,--r--a"I j , :?. . "~' - ~~.:::::::~:~ -:-l),,'mM. ".' .,,--';,.- ---. ... .. -I-- -0 7-. ~ "HO.'~;"0 1- -----.--.IS..U.,., I-- -i4!!I0.;>'",,'-" = ",)1 ,. ,.,,,,.'mI'. = 1., ,,"'cm', '. - 1~.!' J""'~'~'-0.3 0.4 0+ "" 0.7 0,'The M-N cross plot to Nullipore section in well no. 224u.....I ,""'00906n 5" ""..um"''''' ""s.="",.", '+$.. - -- p",'o.ny,,, ,..," ...."., I .,,. "" ..,,,.,,- -.,.,"im.."'!'-. 1--;,1:'.>' "'''8-4-S"c- -"."....". .".,.,,- --..I-- - '. ,,, .t" .... t".,..,...c- """,,'''..-.:. .-..I-- 1---1- I--f--- I-./ ,"h "'0If Sullc' :;;I 1.- -App,o>on,'0f-,ho'o,o",'onIof-.,.h "",,'P. 101,',,"""" ., - 020 ",...,",,.I', - 1o..'cm"." - '9 ,.,e"1-Soli ,."."". 1 , "';;t.......,.... 00> v""",".'. . , ' 0'
44 Petrophysical studies for recognizing reefu ~,f.) --E "'s "i-'iijc:CD ~'C.¥'3tou f.)Esi-iic::CD'C.¥'3to'" ""., iC,'»".' -..Neutron porosity, (apparent limestone)7" INeutron porosity, (apparent limestone)Zone I!U.!:!E "S>,i-'iijc:CD'C.¥'3tou~s i-'iijc:CD'C.¥'3toNeutron porosity, (apparent limestone)Neutron porosity, (apparent limestone)Z,Neutron porosity, (apparent limestone)Zone VNeutron porosity, (apparent limestone)Zone VIFig (ll): The neutron-density cross-plots of the main electro-litho zones, fiomzone - I to VI in the studied wells in Ras Gharib and Shoab Ghariboil fields,
Ghalib, M. et. al. 45E!i-'(jjs::CII"'C.:t;'Smc;-C)e~bi~ '!Cl>"'C.lie'SmNeutron porosity, (apparent limestone)Zone VIINeutron porosity, (apparent limestone)Zone VIIIc;-~c;-C) ,.,E .~ ""i-'(jjs::Q)"'C.:t;'S ..m,.,.Neutron porosity, (apparent limestone)Zone IXFig (12): The neutron-density cross-plots of the main electro-litho zones fromzones- VII to IX in the studied wells in Ras GhaC'iband Shoab Ghariboil fields,
46 Petrophysical studiesfor recognizing reeft)()EE!iJ'iijc:Cl)"C..11::"SIX!Neutron porosity, (apparent limestone)t) uE sl:-'iijc:Cl)"C..11::"SIX!group 1Neutron porosity, (apparent limestone)group 2t)()EE!iJ'iijc:Cl)"C..11::"SIX!Neutron porosity, (apparent limestone)group 3Fig (13): Neutron densities cross plots of the differentiated three electro-lithogroups in Ras Gharib and Shoab Gharib area,
Ghalib, M. et. al. 47CALsJ!!L 16BS(IN)6 1&GR(GAPI) ....0.1)(1 100~SPUfVI ID00 211.00 luPorasity+~f-- Sw I be 0.1 ~1.00 0.00Penneability :1., ~,OO mJ. i\1111tf'~ I\'
48 Petrophysical studies for recognizing reef_or, "'-w..,Waterar..MD ~Ianf"'" ""..,..,: 500Ift 0.5 ("VI20&1 ~ElJ&N_''OI..U'"'''' """..,p"11 ('IN>--...- ,2700 -"2750--,-~,.-,2800 "'i"""m._'... ---..~,--~.;;:2S5O ... --2gaO2Q5O.- '-"...r-
Ghalih, M. et. al.49"LLO@I\SCILLoad;1 lA !.,.........0.2 (ohm.m) 2000RHQB@'\SCILLoad;1 ! l.LS(j)\SCII_Load;1[A1.95 ,-,._~, 2.95o.r--;::::-ToOo(ft3;!l3)ZafIIIIIL..Fig (16): Qualitative petrophysical evaluation to the Nl.Ilipore section (carried outby Elan program in well - 20), with intervals of anhydritic content.
(50 PetrophysicaJstudiesfor recognizing reefWaterWaterNPHILLD0.2" . '(~h~~)' "2000LLSMD'5L~Elan Hid Malysis'ft .1 05 (VN)O~45 " " ("R3!n3)" . ~O.15 02-(;;;)--2000RHOSMSFL( ohmID) 20002750r2BOO2850J"Fig (17): Qualitative petrophysical evaluation to the Nullipore section (carried outby Elan program in well- 24), which represent intervals with anhydriticcontents.
Ghalib, M. et aL 51REFERENCESAsquith, G. B. and Gibson C. R. (1982):Basic well log analysis forgeologists, methods in Exploration Series. Published by, Am.Ass. Pet. Geol. Tulsa, Oklohoma U.S.A, 217p.Chawdhary, L. R. and Taha, S. (1986): History of exploration andgeology of Ras Budran, Ras Fannar, and Zeit Bay oil fields,gulf of Suez Egypt published by EGPC p,149-182.El Kadi H.; Abd El Khalik M. and Abd El Moula I. (2000): Rockfacies and pore system ofNullipore carbonate reservoir in RasFanar field, Gulf of Suez Egypt. Bull. Fac. Sci., Zagazig univ.,] 15- 149,22 (1).El Naggar A. (1988): Geology of Ras Gharib, Shoab Gharib, andRas Fanar oil fields. Suco, intern. Report no. 88/522, 15p.Gobashy M. M.; Bayoumi A. I.; Abmed F. M. and Mekkawi M.(2000): Structural regime of Gharib area, Gulf of Suez, Egypt:based on potential field analysis. Bull. Fac. Sci. Zagazig Univ.,22 (1), 81-99.Jordi, H. (1984): A megatectonic concept of the Gulf of Suezpublished by EGPC. P. 1- 4.Khattab, H. A. and Hadidi, T. A. (1961): "A comparative study ofBakr, Kareem, and Ras Gharib oil fields" Third Arab PetroleumCongress, Alexandria October 16th- 21st,volume 2.Kulke, H. (1984): A Miocene carbonate and anhydrite sequence inthe Gulf of Suez as complex oil reservoir: Sixth ExplorationSeminar, published by EGPC p, 269- 275.Moon, F. W. and Sadek, H. K. (1923): Preliminary geological reporton Wadi Gharandal area. Petroleum Res. Bull., Cairo, 12,42 p.Moustafa, A. R. (1993): Structural characteristics and tectonicevolution of the east-margin blocks of the Suez rift,Tectonophysics, 223, 381- 399.Rider M. H. (1986): The geological interpretation of well logs.Blakie, Glasgow, and London - John Wiley and Sons NewYork, 175 p.Said R. (1962): "The geology of Egypt". Elsevier pub. Co.Amsterdam,New-York,377p. .Schlumberger (1972): Log interpretation, volume I principles. ParkAvenue, New York 113 p.
152 Petrophysical studiesfor recognizing reefSchlumberger (1974): Log interpretation, volume II, Applications.Park Avenue, New York 116p.Stratigraphic sub-committee of the National Committee ofGeological Sciences (1974): Miocene rock stratigraphy ofEgypt. Egypt. J. Geol., 18, 1: 1-59.Waring, W. W. and Layer, D. B. (1950): Devonian dolometizedreef, D3 reservoir, Leuduc field, Alberta, Canada. The Americanassociation ofpetroteum geologists, Bulletin, vol., 34, no. 2, p.295 - 312..Wegdan A. S. (1995): Facies and framework of sedimentation of theMiddle Miocene oil-bearing carbonate rocks in Ras Fanar oilfield, Gulf of Suez, Egypt. M. Sc. Thesis, Faculty of Science,Ain Shams University, Egypt, 133p.
Geophys. Lett., 1 (2008) 53 .80SEISMIC STUDY TO RECOGNIZE REEFRESERvoms IN RAS GHARIB, SHOAB GHARIBAND RAS FANAR OIL FIELDS,GULF OF SUEZ, EGYPTGhalib M.*; Nadia F.*, and Farrag Kh.* Cairo University, Faculty of Science Egypt,Geophysics DepartmentABSTRACTThe present study is concentrated on the Middle MioceneNullipore rock (taken as example in the present study for thecarbonate build-up or reefs) of Belayim formation in RasGharib, Shoab Gharib, and Ras Fanar oil fields, Gulf of SuezEgypt. The study is an attempt to concern on the study ofcriteria or geophysical parameters, by which we can recognizeand interpret the carbonate build-ups (reefs), using seismicdata. Seismk: parameters derived from well log data such asseismic velocity and acoustic impedance, and density are plottedversus depth and used to interpret the lithology of HammamFaraun section as carbonate (which may be reefs), bycomparing the response of the Hammam Faraun section tothese parameters, which is moderate response, with theoverlying high response representing anhydrite and theunderlying low response representing shale. By tying theseplotted parameters to the seismic section, we can delineate theHammam Faraun seismic sequence on the sections. Seismiccriteria such as outline reflection, seismic facies change, drapeand velocity anomaly can be used to interpret Hammam Faraunseismic sequence. By conjunction between these two subjects,we can interpret the Hammam Faraun seismic sequence ascarbonate build-up (reefs). Shallow marine environment ispredicted to the main parts of the Hammam Faraun seismicsequence. According to seismic reflection configurations, theintervals on the Hammam Faraun seismic sequence, whichrepresent chaotic or seismic free to amplitude anomaly, isi~terpreted as high energy intervals on the sequence, and also
54 Seismic study to recognize reef reservoirsas reefs. Mapping of the interpreted seismic fades units and thecorresponding lithology represent the occurrence of the reefs onRas Fanar field as a narrow elongated build-up, aligned NW-SE (Gulf of Suez trend) and represent the wide distribution ofthe reefs on Ras Gharib and Shoab Gharib, as a batch reefs.Ras Fanar reefs were deposited over an elongated pre-Miocenehigh, approximately of the same water depth, which result in areef barrier like shape. Shoab Gharib reefs were deposited on adomal feature (topographic high) with wide range of waterdepth. Then, the carbonate build-ups are close and related tothe structural high and high topographic areas, which arerelated to the rifling of the Gulf of Suez.INTRODUCTIONRas Gharib oil field is located some of 220 km. south of Suez town atthe western coast of the Gulf of Suez, Egypt. Shoab Gharib oil field liesin the adjacent offshore area and proved to be an extension to RasGharib oil field and Ras Fanar oil field is located 3.5 km. east of RasGharib shoreline, as represented on Fig.(1) (El Naggar, 1988). The termNullipore rock is first applied by Moon and Sadek (1923), and it isconsidered by the stratigraphic sub-committee (1974) as equivalent toHammam Faraun Member of Belayim Formation of Middle Miocene. Itis considered to be deposited under shallow marine warm waterconditions, which is favorable for reefal development (Kulke, 1982,Chawdhary and Taha, 1986, and El Naggar, 1988). The Nullliporerock in Ras Gharib is a typical reefal limestone formed of dolomiticcavernous limestone in brecciated form with shale bands and anhydritestreaks. In some wells, it is replaced by marly and chalky facies(Clypeaster bed facies). The maximum thickness of the Nulliporesection in Ras Gharib reaches 230 m., where it forms an excellentreservoir body at the northeastern portion of the area (Khattab andHadidi, 1961). The stratigraphy of the formations penetrated in RasGharib area is obtained from the subsurface information of drilled wells.It consists of formations ranging from Cambrian to Recent Fig. (2)(Khattab and Hadidi, 1961, El Naggar, 1988). The geologic structuresof all the oil fields (among them are Ras Gharib, Shoab Gharib and RasFanar oil fields) of the Gulf of Suez is stronglyrelated to the formation
Ghalib M. et. aL 55of the gulf itself, which is a huge graben with successive block faultingaway from its center and parallel to it (Said, 1962, Moustafa, 1993,Gobashy et ai, 2000, Jordi, 1984 and El Naggar, 1988).The aim of this study is concerned on the study of criteria, orgeophysical parameters by which we can recognize and interpret thecarbonate build-ups (reefs) by using seismic data, the Nullipore rock onRas Gharib, Shoab Gharib, and Ras Fanar oil fields Gulf of Suez ofEgypt is taken as example to the present study. The following subjectshave been studied to recognize and interpret the reefs by conjunctionbetween these subjects:1- Use of seismic parameters obtained from well log data such asvelocity, density and acoustic impedance to recognize the reefs onseismic sections, by tying these parameters to the seismic lines,and how these parameters are used to recognize the lithology.2- Interpretation according to criteria by which we can recognize thecarbonate build-ups (reefs) by using seismic data.3- Environmental study, mapping, and distribution of reefs.4- Depositional history of the carbonate build-ups (reefs) by seismicstudy.The criteria that can identify the reefs on seismic section dependprimarily on the difference in compaction between reefs and the adjacentstrata, and the presence of high velocity contrast between the reef andthe overlying rock, often a lot of higher, therefore there is a strongreflection at the top of the reef, but when the velocity of the reefs isnearer to the velocity of the overlying rocks ( especially in the presenceof gas at the top of the reef), then the reflection is weaker and the dimspot appear. In this case it is very hard to fined or identify the reefs onthe section.The following subjects have been studied to recognize and interpretthe reefs: /1- Density, velocity and acoustic impedance, as interpretingparameters and lithologic indicator:
56 Seismic study to recognize reef reservoirs.The logged velocity trace, the interval velocity and the formation densitylog plotted on a suitable time scale when overlain and spliced into aseismic section, velocity contrasts well aligned with appropriate peaksand troughs (McQuillin et ai, 1984). The acoustic impedance andinterval velocity as a seismic parameter determined from well log data(sonic and density logs), and the density (from density log) can be usedto interpret the lithology (Sheriff, 1995). ~The seismic parameters derived from the sonic and density log data, suchas the acoustic impedance, interval velocity and density can be used tointerpret the lithology and tied to the seismic sections as follows:The first step in this case study includes the calculation of the intervalvelocity from the sonic log, determine the density from density log andcalculating the corresponding acoustic impedance in the two wells-224and 252 taken as examples. The next step includes the plotting ofdensity, velocity and acoustic impedance versus depth to the two wellsas represented on Fig. (4) and (5), on the plotted curves we candifferentiate the Nullipore rock by its characteristic moderate density,velocity and acoustic impedance, which is characteristic feature toporous carbonate (which may be reefs), from the overlying high density,velocity and acoustic impedance which represent anhydrite (southGharib formation), also differentiate it from the underlying beds whichrepresent low density, velocity and acoustic impedance which representthe pre-Miocene shale, this indicate how the density, velocity andacoustic impedance parameters are used as lithologic indicator, where itis used to identify the Hammam Faraun sequence as pours carbonatewhich may be carbonate build-up(reefs).The plotted curves density, interval velocity and acoustic impedance towell-252 taken as an example in this case study, are used to recognizethe reflection events (sequences) on the seismic section. Where byoverlie or spliced these curves into the seismic Line-8, which runadjacent to well-252. The main shifts on the plotted curvescorresponding to the top and bottom of Hammam Faraun Member willbe aligned with the appropriate peaks and trough on the seismic sectionwhich represents the top and bottom reflectors of the Hammam FaraunMember on the seismic section as represented on Fig. (6).
Ghalib M. et. aL 572- Interpretation of reefs by seismic criteria:The recommended procedure for the interpretation of carbonate buildupsfrom a grid of seismic data follows the seismic stratigraphictechniques (Bubb and Hatlelid, 1977), which involves:- Seismic sequence analysis: it is based on the identification ofstratigraphic units composed of a relatively conformable succession ofgenetically related strata termed depositional sequences; the upper andlower boundaries of depositional sequences are unconformity or theircorrelative conformities (Mitchum et at, 1977- part 2).- Seismic facies analysis: it is based on the delineation and interpretationof reflection geometry, continuity, amplitude, frequency and intervalvelocity, as will as the external form and associations of seismic faciesunits within the framework of depositional sequences (Mitchum et at,1977- part 2).The Hammam Faraun sequence is the important sequence in thepresent study. Firstly the sequence boundaries are delineated on allintersected lines in the available grid. The complete correlation throughthe seismic grid will produce a three dimensional framework ofsuccessively stratified seismic sequences.The second step in the reef interpretation is the analysis of reflectionconfiguration and other seismic parameters, such as amplitude andcontinuity within Hammam Faraun seismic sequence. These parametersare delineated as seismic facies units, which are three dimensionalgroups of reflections whose elements differ from those of adjacent units.The next step in the reefs interpretation is based on the special criteria bywhich we can recognize the reefs or build-ups on the seismic sections.The seismic criteria that can identify the reefs on seismic sectionsdepend primarily on the difference in compaction between reefs and theadjacent strata and on that the reefs have higher velocity contrast withthe overlaying rock, often a lot of higher. This lead to high acousticimpedance contrast between reefs and the overlaying strata, which leadto high reflectivity at that boundaries, when it is not affected by presenceof hydrocarbons especially gas which may lead to weak reflectivity.Also the reefs differ in their composition from the adjacent strata (facieschange), which are reflected as difference in reflection configuration
58 Seismic study to recognize reef reservoirspatterns, which include amplitude, frequency and continuity changes(seismic facies change).Among the seismic criteria as represented on Figs. (7) and (8), that areused in the present study to recognize the carbonate build-ups on theavailable seismic sections are:..a) Outline reflection:The reflection from the top and side boundaries of the build-ups andits shape, which is generally mound-like, is a good criterion to recognizereefs (build-ups). This criterion results from the acoustic impedancecontrast between reefs and the overlying strata.b) Seismic facies change:The seismic facies change between the reefs and the enveloping strataincludes amplitude, frequency and continuity changes. It results from themain difference in the petrographic properties between the reefs and theadjacent strata, which leads to the comparable difference in reflectionconfiguration patterns between the reefs and the adjacent strata.c) Drape in the overlying strata:The reefs are physically less compacted than the normally adjacentstrata, which may be evaporites or intercalations of carbonates andanhydrite. This criterion appears on the seismic sections as drape in theoverlying strata to reefs and this drape decreases up-ward.d) Velocity anomaly:The reefs are characterized by their higher velocities than thevelocities of the adjacent strata which are a lot of higher. This criterionappears on the seismic sections as pulled-up of the underlying strata toreefs. In some cases, if the velocity of the reefs is lower than the velocityof the adjacent strata (may be due to the effect of fluids content withinthe reefs) and in this case the reflections of the underlying strata to reefsare pulled-down.3- Environment, mapping and distribution of reefs:Depositional environments can be predicted from seismic reflectiondata through the interpretation of seismic reflection. Reflectionamplitude contains information of the velocity density contrast,individual interfaces, and on the extent of inter-bedding. Continuity ofreflectors is closely associated with the continuity of bedding. The
Ghalib M. et. al. 59sediments deposited in shelf environment tend to generate parallel togently divergent reflection configurations having a widespread sheet orwedge-shaped external form (Sangree and Widmier, 1979).Depositional environment of Nullipore rock:On the available interpreted seismic grid, the reflection patterns, ofHammam Faraun seismic sequence (Nullipore rock), are of greatcontinuity and high amplitude in the main parts of the sequence. Bycompare the external form of the Hammam Faraun seismic sequence onthe dip lines: Line-I, Line-2, Line-3, Line-4, Line-5 and Line-6, asshown on the shoot points and well location map, Fig. (3), with theexternal form to it on the strike lines: Line-9, Line-IO and Line-I I, we, can conclude that, the external form of the Hammam Faraun sequence issheet- like to wedge-shape. These two parameters of high continuity andhigh amplitude of reflection patterns, and the sheet-like external formreflect that, the Hammam Faraun Member is deposited in shelfenvironment (shallow marine environment), which is suitable tocarbonate build-ups.On little parts of the Hammam Faraun sequence, the reflectionpatterns change from high continuity and high amplitude parallelpatterns to chaotic and reflection free to amplitude anomaly patterns.These patterns (chaotic and reflection free to amplitude anomaly) revealthat, the energy is high in these parts of the sequence than the main parts(which represent parallel patterns with high continuity and highamplitude). These conditions are suitable to reefs growth. The seismicfacies units on the sequence of Hammam Faraun, which representchaotic and reflection free to amplitude anomaly reveal the presence ofreefs in these parts of the sequence.Interpretation of reflection configuration:Seismic reflection termination and configurations are interpreted asstratification patterns and are used for the recognition and correlation ofdepositional sequences, interpretation of depositional environment, andestimation of litho-facies (Mitchum et ai, 1977- part 6). Seismic faciesunits are mappable, three dimensional seismic units are composed of agroup of seismic reflections, whose parameters (configuration,amplitude, continuity, frequency, and interval velocity) differ from the
60 Seismic study to recognize reef reservoirsadjacent groc.ps (Mitchum et ai, 1977- part 6). Reflection fi"ceconfiguration is indicative of uniform single lithology. In an evaporatecarbonateregime, it could indicate salt or massive earbonate reef-coreenvironments (Sangree and Widmier, 1979). Contirmous reflectionswith uniform amplitude and frequency from trace to trace arise fromrock layers that are uniform in their thickness and lithology over theregion covered by the section. They represent deposition during periodsof stable and uniform depositional conditions (Sangree and Widmier,1979). The high continuity and high amplitude facies in the shelf faciessuggests continuous beds deposited in a relatively widespread anduniform environment. Low amplitude seismic facies may indicate a zoneof one predominant lithologic type (Sangree and Widmier, 1979).Chaotic patterns, in which reflections are discontinuous, are oftenmounded or internally contorted, and frequently are distinguished bymany diffraction patterns. Discontinuous discordant reflections observedin chaotic configuration suggest a disordered arrangement of reflectionsurfaces and either a relatively high energy and variability of depositionor a disruption of beds after deposition (Sangree and Widmier, 1979).The Hammam Faraun seismic sequence is subdivided into number ofseismic facies units, according to their reflection configuration and theother parameters, such as amplitude and continuity on all the seismicsections in the available grid of the seismic data. The integration of theseseismic reflection elements with the available well data, and thegeological information of the area is a good prediction to depositionalenvironment and lithology. The high continuity and high amplitudeseismic facies units are interpreted, according to the seismicconfiguration patterns conjunct with the available well data andgeological information of the area, as anhydrite. Low and variableamplitudes with continuous reflections, seismic facies units, areinterpreted according to the conjunction between seismic, well data, andgeological information about the area as inter-bedded nullipore, andevaporite. The chaotic and amplitude anomaly seismic facies units areinterpreted as Nullipore rock (reefs), as represented on Figs. (9), to (12).Mapping and distribution to Nullipore rock:The mapping of the seismic facies units, or their correspondinglithology, on a base map is carried out by subdivided the Hammam
Ghalib M. et al. 61Faraun seismic sequence on the grid o. the available seismic data intosegments, which represent the lateral extent of the various seismic faciesunits. The segments ar-' then transferred to a shoot point map withappropriate description )f names of seismic facies units or theirinterpreted lithology. The resuJting map represents the distribution of theseismic facies units or their interpreted lithology, as represented on Fig.(13). THs figure represents the distribution of the interpreted lithology tothe seismic fades units within Hammam Faraun sequence in ShoabGharib, Ras Fanar, and Ras Gharib oil fields. The figure also representsthe widely distribution of Nullipore rock in Shoab Gharib area (as apatch reefs), which may be an extension of the Ras Gharib reefs. Thefigure also represents Ras Fanar reefs as a narrow elongated build-up,aligned NW -SE (Gulf of Suez trend).4- Depositional history of Nullipore rock:Figure (13) represents the distribution of the interpreted carbonatebuild-up (reefs) in Ras Gharib and Shoab Gharib area, as patch reefs andrepresents the elongated shape of the reefs in Ras Fanar area. Theinterpreted seismic sectioH:;and the time structure contour maps of thetop and bottom of the Hammam Faraun sequence Figs. (14) and (15)show that, Ras Fanar reefs were deposited over an elongated pre-Miocene high, approximately of the same water depth, which result in areef barrier like-shape. Shoab Gharib reefs were deposited on a domalfeature (topographic high) with a wide range of water depth. Then, thecarbonate build-ups are close and related to the structural highs and hightopographic areas that related to the rifting of the Gulf of Suez. Theconjunction between the preceding characters represents the depositionalhistory of the Nullipore rock as follows:The origin (depositional history) of the Nullipore rocks in the studiedarea is related to the structural configuration resulting from the rifting ofthe Gulf of Suez in the pre-Miocene time. This leads to the occurrence ofa number of horst blocks, step blocks, with grabens and marineembayments in between. This structural configuration leads to theexistence of areas with free sea' water circulation connected with theopen sea, which is the top surface of the horst blocks and topographichigh areas (structural high areas). The above areas are adjacent to closedareas (grabens and marine embaymeIlts)with little or no-circulation. In
62 Seismic study to recognize reef reservoirsthe first areasctructural high areas), the ecological conditions werefavorable for the growth of carbonate build-up (reefs). While in the:::econdarea,the ecological conditions were favorable for the deposition, .carbonate-anhydrite intercalations in the case of little jrculation, andthe deposition of evaporites in case of no-circulation.SUMMARY AND CONCLUSIONSRas Gharib oil field is located some of220 km south of Suez town, at thewestern coast of the Gulf of Suez Egypt, Shoab Gharib oil field lies inthe adjacent offshore area and proved to be an extension to Ras Ghariboil field. Ras Fanar oil field is located 3.5 km east of Ras Gharibshoreline. The three mentioned fields contain reef reservoirs (Nulliporerocks) of Middle Miocene age, which is taken as example in the presentstudy to carbonate build-ups or reefs.The results of this study are concentrated on the following points:1- Hammam Faraun sequence, on the studied seismic sections in RasGharib, Shoab Gharib and Ras Fanar oil fields, is interpreted ascarbonate build-up (reefs) in some localities, according to theconjunction between the seismic criteria, which are characteristIc toreefs, and seismic parameters obtained from well log data.2- In the studied area, the reflection patterns of the Hammam Faraunseismic sequence (Nullipore rock) are high continuity and highamplitude in the main parts of the sequence. The external form of theHammam Faraun sequence is sheet- like to wedge-shape. ;These twoparameters of high continuity and high amplitude of reflection patterns,and the sheet like external form reflect that, the Hammam FaraunMember is deposited in shelf environment (shallow marine enviromnent)suitable to carbonate build-up.3- On some parts of the Hammam Faraun sequence, the reflectionpatterns change from high continuity and high ~plitude parallelpatterns to chaotic and reflection free to amplitude anomaly patterns,which represent high energy in these localites of the sequence. The parts(seismic facies units) on the sequence of Hammam Faraun, whichrepresent chaotic, and reflection free to amplitude anomaly, may revealthe presence of reefs in these parts of the sequence.4- The Hammam Faraun seismic sequence is subdivided into number ofseismic facies units, according to their reflection configuration and theother parameters such as amplitude and continuity on the seismicsections of the available grid of the seismic data. Conjunction between
Ghalib M. et. al. 63the seismicreflectionconfiguration,the availablewell log data and thegeologic information of the area leads to good prediction of thedepositional environment and lithology.5- Corijunction between the iso-parametric map, which repre:;ents thedistribution of the interpreted carbonate build-up (reefs) and theisochrone maps to the top and bottom of the Hammam Faraun sequence,indicate that, Ras Fanar reefs were deposited over an elongated pre-Miocene high, approximately of the same water depth, which result in areef barrier like-shape. Also, Shoab Gharib reefs were deposited on adomal feature (topographic high) with wide range of water depth.52' n' 5'". MATRRNRO..LEGYPTbSTERNDESERT.8NA.UGEND. ,. .. .. .. ....."L"'LO f55'Fig (1): Location map showing Ras Gharib, Shoab Gharib, and Ras Fanaroil fields.
64 Seismic study to recognize reef reservoirsAGEIRock Uo!!§!!.l!!2.IIIOCENE POST ILATEIIIOCENE~,POSTZEITZEIT. .SOIlTll .IIARILithology~..",...,. ... . . . ...}}~{:;{:::::~:::::;::::::~;\~\\~~lil:::;;:::::::::::::~A-A-A-A...........,.-' A- A-A-A-"A - A- A'VE..",..'cx--'.""Tlioo6W240c:JI.woe.LltbOlo9'" OescrlpllonSandstone: Crs~w!!h'grainIoncloy. .oolitic Lime.t...minoroypsumSbo!e:greyint.r-edwith anhydrite and tbinsandstone sl,eotksAnhydrlle:Lightgreygrey,, hardTectOnic Envir-01 O_lttanSubsidenceIn tonnlcllcinseu'e!W111n.'lof Redwilh Iadicm Oceo..up "" 1'011001.. .,.o nlo,1............-EvQI)Or\te deposUion Inclosed logoooal basin.depositlno QIIKydrlteWIsharl epi"'. of clCIi"klinflux.ldurlno 21111. FI... -,.. I 0 .0'- + 120'a.'so0'- 340'400-50'0'1!4O'~180'230420') 420I0U :T.., ."""", "'"". c.",.""...1." of11 ..........L.': T_mUle; s...SST:Gy,r gra8>,clouc:.colc.cml. with Ih urelLST Inler bedsLST;mas.lve ,bufflallll" :ol'e1.brnarev=',';L'/'l$r"~dl1Io04'''",,''' wldft",II.U,Shale:d1lgrey.blockcorbonateou.,I>7ril1oSGndstone: fine to med,iJllatbedded wllh grey,brownish lilt bed.Shcllow marine b.laclod:creetoldbuildup~1 I\t\"'uItf;lt1~ .'black. 0..1'H' ",HI..Shallow marine corboctQ-ton 0 lIableIIIolt pial-'"with minor episodes 01""'Igeno..1';11""tlo...-0... ...rIoo_i",.-.""'" ..., ....
Ghalib M. et. aL 65C'Il.-NC'II.-;j>.-Z~C'It4 f)p816 816818818820Cl)Cl)~ ~ ...Fig. (3): Shoot-points and wells location map to Ras Gharib, Shoab Gharib,and Ras Fanar fields represented on it the available seismic lines and wells.Cl)
,166Seismicstudy to recognize reefreservoirs~~ ~60000620640I~ ~loo loo~ ~~ ~- ...~~rJ).\ ;\I\.-Pt.~1 i\~ !\;,AI./'\'V'. f., ~ .\ t, \''.., A."'A.",I\,~,< "~A!\AI\i'\,J:J I fI"IIAI\I\c- ':" == A "1\.111\1\1\..~0 ",,"A""C"11"'/'1" 1\1\1\,,"""" Ae l'S AAA "A " ,..",,,1\,,,,,1\111c'?7'/ //, .,~ . , './ .",\ J"".-J' ' '~. . , ,,--=-~-\/-:7'/ .-:r-. ,/ ~z::z-;/ ~ /~L < ,.::J:;:-~{,/ ~-//~,/ //72:1./ ." / , J . ' ,,.;-- / / z.-! // ~/J / ,~- ---\ / .' '"", /.../ /..--J ./ /" / / >.> /''.../ / ~;y ,.- / /' ::>i . ?:/ ./ ./ /
Ghalib M. et al.67.:::Q.,,", .a)1"00~density (gm,ice)30.000 '" :: :;100.000accoumc Impedance(A1).:.:u0Q::oc;.C1V .~600i I'D!'I:"C >-J:Hr ri I'5!Z700 1bank \'T'i¥"al.;il!!uJ:0.0UJ .-.750:e,,-' ,.< J '~~. -- --1 "': "--'->' ~w ~c'~ ~"} _ '~":'>. .::::.~ ~,1 )- l~ I' "'--"'\ ,~ ,~ --:.~- ---~,} " -"-~< " ,1//-"''''' , / / /\ ,/ / /' /7,.;"t:~(;' 6/17 /Z /, '-
"'68Seismic study to recognize reefreservoirs5...~~g~=~ I..:lili';I!!I!'!/IIliWillllll!!illlll !III!~ H!;!I"II,Wil,liWlllliliii~!ltl:m~;ml~tilmi;lijllilll;'f I 1111111 ,'i 1~llfr~II~ljI~I~II~,~'~I:~!'I~:I;!ilU1;: t»Ni~ 'f,~'~,'f III'~!!~~tI ';~J;!~. ....."~~:':,~~~~'I'I ftIt""i!'I~It~I~,~~~~~\~ ..~J~~. ...~.I\"1 jJ>. ..I:J~j! , '. ";_'."rJ!A'7",. ~ ......"hi ''I.'' I ., .',1 . "/;'I""",""~i,'~',I('f"''!'''\ I ~I'''l ~ ,ItiI.~.J'' h~ ...'I' İ .~"~,,,~i ,N'~~~I~t~~~;,;rP~,,:~:,of~:~\:~~~~~"'!~I, ' ~,"~r~:':~i~~ ... II hf.r'I ,1:rj'lflf'"lIi1;:;~'!"'I .~ " "'f"" ""I!Ii.~...IiIJtnn.'"""h,~~:'~"''':.,. " ' .'..... .. .!~_5_~1i~~?/'........~...,I"~.i~':.,0> "h, '"'''' ,..,"'IH. '.,' ..'"",,"')jI~~\nm~~I::"".-'-"'---'---..-.-..................--.-::- TopHammamFaraun-bottomJ.!i Cl!, ..~ ~ ~f.ji! ~ sI'0 ~ ~.5- the all plotted versus depthin wee I no RG-252IHamm8m Faraun ReefFig (6): Tying the parameters (density, interval velocity, and acoustic impedance)derived from well-252 in Ras Gharib oil field Gulf of Suez Egypt to seismicLine- 8 which run adjacent to the mentioned well.
Ghalib M. et. aL 69-~Q ~-=~.l::....-.-~Q. =~....-==Q~ ~~==~~.$ ~.!..=0;"F~;2:;..:: .;:":t.. .-'"'-"'- 1'"""'-.-..~i'::..::':/ . . ~-.''''''':'' ~ . ""'" ;:.1:: .~:::'~-". .'. """-."1 -.~ .-." -- .;;;.(. ~:. ., -.:.::;:: ..~ ..~. .' ~.. :::= q:.=-:.:f :,. .. '.~ .~; -:'-I:!fQ.~~'-.....t 5E ~ ~Q E = =::: 5 e ~Q~~="'.c=~~ 'I- 000Fig (7): Magnificent sector of seismic line-2 (dip-line), which pass through ShoabGharib, and RasFanar oil field gulf of Suez Egypt, represented on it the seismiccriteria which indicate reefs.
',,"",'",',,','""",,,,,,,,',70 Seismic study to recognize reef reservoirs...~ ,"" '"- '" """""""'''',A ''~"'~.-,""'''''''', ,,,',",,'" ',.,~",'" ."""... .;....,., ~.=!:..:..:,;..,,>..~' --- ,Ao...,.. ..~"- --"""":--, _, ..6 '~.. ' , '-~,.. , ~:~'- - " """-'~ *"" ~" -",~",--~ !:,~;.'''''--:,-" , ~",,;.111.,.~.c,~~:' -"~"",.. .""-' -, , ,"---~"'''-,-"".."... Al.'"'Z''' "'.-,,'" " ' ,-."",",', ~ " .",."!~ ~ , .!,,!,~~c..~--IS 5IS ~ =QISc:rtlS~Q~ =.c::z:==-= Q ""=~Fig (8): Magnificent sector of seismic Line-4(dip-line), which passes through ShoabGharib, and Ras Fanar oil fields, represented on it the main criteria whichrepresent reefs.
,:..'Ghalib M. et.aL 71~ t()~=M.~ ~aE'" 1:1:;=Q.frQ t() .,'M""t--it--'M'a:, ...NI Q...~"""' ~,~"!...IFig(9): Interpreted offshore dip seismic line-2, which pass through Shoab Ghariband Ras Fanar oil fields Gulf of Suez Egypt, represented on it the interpretedcarbonate build-up (reefs).
....t~ ""72 Seismic study to recognize reef reservoirs.=.~~ ."11.=~Ie=ee=:= =~I."t- ,1(10): Interpreted offshore dip seismic line-4, which passes .through ShoabGharib and Ras Fanar oil fields Gulf of Suez Egypt. The interpretedcarbonate build-up (reefs) is represented on it.
Ghalib M. et. aL 73(IJ0! 0I!!.e-a,'-A:1i=Z:j e.~,~iB -. '"'-~!iio&e"'. 8; ~"dilLfet e- .211J :Ee~ ! eIL!~i., 1.8Fig (11): Interpreted onshore dip seismic line-8, which passes through Ras Ghariboil field Gulf of Suez Egypt, represented on it the interpreted carbonatebuild-up (reefs). ,/
74 . Seismic study to recoj!nize reef reservoirs,..,:;;s... =ij~~-£ ...E:I~se::s~=e g.~1~ ...E:I'"0 5Fig (12): Interpreted offshore strike seismic line-ll, which passes through ShoabGharib oil field Gulf of Suez Egypt, represented on it the interpretedcarbonate build-up (reefs).
Ghalib M. et. aL 75816Cl>...N+-z818820Fig (13): Dstribution to the interpreted lithology of the seismic facies units withinHammam Faraun sequence in Shoab Gharib, Ras Fanar, and RasGharib oil field areas (area restricted to the available grid of seismicdata). (1) Represent reefs, (2) represent anhydritc, and (3)represent intercalated carbonate and anl1ydrite.
~ ~76 Seismic study to recognize reef reservoirs816._-~'eG> ~... ..,.'
'" ...Ghalib M. et. al. 77"-"'...,--.--2e:'"816". 816. .818820820'"...... ~ '" ...'"Fig (15): Time structure contour map to the bottom reflector of HammamFaraunz sequence in Ras Gbarib, Shoab Gharib, and Ras Fanaroil fields Gulf ofSuez Egypt.
78Seismic study to recognize reefREFERENCESreservoirsBubb, J. N. and Hatlelid, W. G. (1977): Seismic stratigraphy andglobal changes of sea level, part 10: Seismic recognition ofcarbonate build-ups in seismic stratigraphy - applications tohydrocarbon exploration (Ed. by Payton).Chawdhary, L. R. and Taha, S. (1986): History of exploration andgeology of Ras Budran, Ras Fannar, and Zeit Bay oil fields Gulfof Suez, Egypt, published by EGPC, p.149-182.El Naggar, A. (1988): Geology of Ras Gharib, Shoab Gharib, and RasFanar oil fields, Suco Report no. 88/522, 15p.Gobashy, M. M.; Bayoumi, A. I.; Abmed, F. M. and Mekkawi, M.(2000): Structural regime of Gharib area, Gulf of Suez, Egypt,based on potential field analysis. Bull. Fac. Sci. zagazig univ., 22(1), P. 81-99.Jordi, H. (1984): Amegatectonic concept of the Gulf of Suez publishedby EGPC. p.l- 4.Khattab, H. A. and Hadidi, T. A. (1961): "A comparative study ofBakr, Kareem, and Ras Gharib oil fields" third Arab petroleumcongress, Alexandria, October 16th- 21S\volume 2.Kulke, H. (1984): A Miocene carbonate and anhydrite sequence in theGulf of Suez as complex oil reservoir: Sixth Exploration Seminar,published by EGPC, p. 269- 275.McQuillin, R.; Bacon, M. and Baclay, w. (1984): An introduction toseismic interpretation. Gulf publishing Company, Houston,London, Paris, Tokyo 287 p.Mitchum, R. M.; JR; Vail, P.r., and Thomposon, S. (1977a): Seismicstratigrapyy and global changes of sea level, (part 2): thedepositional sequence as a basic unit for stratigraphic analysis in:seismic stratigraphy applications to hydrocarbon exploration(Ed.by Payton) memoir of the American association of petroleumgeologists, Tulsa, 26, P. 53 -62.Mitchum, R. M.; Jr.; Vail, P. R. and Sangree, J. B. (1977 b): Seismicstratigraphy and global changes of sea level, (part 6) seismicstratigraphic interpretation procedure. In seismic stratigraphyapplications to hydrocarbon exploration (Ed. by Payton). ). Memoir
Ghalib M. et. al. 79of the American Association of Petroleum Geologists (AAPG), Tulsa,26, P.117 -134.Moon, F. W. and Sadek, K. H. (1923): Preliminary geological reporton wadi Gharandal area. Petroleum Res. Bull., Cairo, 12,42 p.Moustafa, A. R. (1993): Structural characteristics and tectonic evolutionof the east-margin blocks of the Suez rift, Tectonophysics, 223,p.381- 399.Said, R. (1962): "The Geology of Egypt" EIsevierpub. Co. Amsterdam,New- York, 377p.Sangree, J. B. and Widmier, J. M. (1979):Interpretationofdepositional facies from seismic data. Geophysics,vol. 44, no. 2, p.131-160.Sheriff, R. E. and Geldart, L. P. (1995): Exploration seismology.Cambridge, New York, 592 p.Stratigraphic sub-committee of the national committee of geologicalsciences (1974): Miocene rock stratigraphy of Egypt. Egypt. J.Geol., 18(1), p. 1-59. .
<strong>GEOPHYSICS</strong><strong>LETTERS</strong>INSTRUCTIONS FOR CONTRlBUTERS1- Geophysics letters is a specialized scientific journal publishingoriginal work in all areas of geophysics.2- Papers submitted to the geophysics letters should have notpreviously been published, nor will be submitted for publicationelsewhere except in the form of abstract for a scientific meeting.3- Manuscripts should be submitted (in English) in triplicate, typewritten (Time New Roman) on one side of A4 (208 x 298) paperand should not exceed 30 double-spaced pages (including tablesand figures) and provided with side margins of 2S mm.4- Manuscripts should be assembled as follows: (a) Title page; (b) Abstractpage; and (c) The text pages.(a) Title should be concise and typed in bold capital litters, followed bythe author(s) name(s) and addresses.(b) Abstract page describes in a maximum of 200 words, the p~rposeof the investigation, the procedures employed and the conclusionsreached. Six to ten key words for indexing purposes (excludingterms already used in the title) should be listed below the abstract.(c) Text pages should have sections for: Introduction, Material andMethods, Results, Discussion and References. Tables, figures andtheir legends should be compiled on separate sheets. References toliterature cited should be up to date and must be given in name anddate form in the text and listed alphabetically on a separate page atthe end of the manuscript according to the authors surname. Theyshould be typewritten in the following manner:Gallovic , F. and Brokesova, J. (2004): On strong ground motionsynthesis with K-2 slip distribution. J. Seismo., 8 : 211-224 .S- Twenty offprints of each paper will be furnished free of charge.