Two-Wheelers in India and Vietnam - Clean Air Initiative
Two-Wheelers in India and Vietnam - Clean Air Initiative
Two-Wheelers in India and Vietnam - Clean Air Initiative
- No tags were found...

Create successful ePaper yourself
Turn your PDF publications into a flip-book with our unique Google optimized e-Paper software.
ELectrictwo-wheelers <strong>in</strong><strong>in</strong>dia <strong>and</strong> vietnamMarket Analysis <strong>and</strong> Environmental Impacts
Electric <strong>Two</strong>-<strong>Wheelers</strong><strong>in</strong> <strong>India</strong> <strong>and</strong> Viet NamMarket Analysis <strong>and</strong> Environmental Impacts
ContentsAbbreviationsivAcknowledgmentsvExecutive SummaryviIntroduction 1Background 2Ahmedabad, <strong>India</strong> 2Ha Noi, Viet Nam 3Market Analysis 4Choice Experiment Survey Design 4Attributes <strong>and</strong> Levels 4Choice Sets 6Sampl<strong>in</strong>g 6Vehicle Choice <strong>and</strong> Respondent Preferences 11Market Estimation Results 11Ha Noi, Viet Nam 11Will<strong>in</strong>gness to Pay Estimates <strong>and</strong> Tax Effects 16Market Share Predictions 19Ahmedabad, <strong>India</strong> 22Will<strong>in</strong>gness to Pay Estimates 24Market Share Predictions 24Environmental Impacts 28Impact Estimation Methodology 29Emission Rates of Electric Scooters <strong>in</strong> <strong>India</strong> <strong>and</strong> Viet Nam 30Environmental Impacts of Electric Scooter Adoption 31Lead Pollution 35Conclusions 37Instruments to Improve Electric Scooter Adoption 37Role of Policy Makers 38Role of Industry 38Jo<strong>in</strong>t Role 39F<strong>in</strong>al Remarks 39Appendixes 40Logit Model<strong>in</strong>g Formulation 40Electric Vehicle Emission Rate Estimation 41Market Analysis 42
e a positive way to <strong>in</strong>fluence adoption. In Ahmedabad, electric two-wheelers suffer greater disfavor,with poor early experiences with the new technology tarnish<strong>in</strong>g its reputation among users. Undercurrent market scenarios, only about 6% of the near future market is expected to shift towardelectric two-wheelers. Even with improved performance <strong>and</strong> price <strong>and</strong> <strong>in</strong>creases <strong>in</strong> gas prices, only14%–23% of the market can be expected to shift toward electric two-wheelers. Respondents <strong>in</strong>Ahmedabad were not sensitive to differential tax policy.Coupl<strong>in</strong>g the market analysis with environmental emission rates, several technology <strong>and</strong> policyscenarios were developed. In Ha Noi, electric two-wheeler adoption could reduce average CO 2emissions from all two-wheelers by 16%–21% depend<strong>in</strong>g on how aggressive supportive policy <strong>and</strong>technology improvements were. In addition, other primary pollutants show greater impacts fromelectric two-wheeler adoption, with reductions rang<strong>in</strong>g from 33% to 42% <strong>in</strong> two-wheeler fleetemissions, depend<strong>in</strong>g on technology <strong>and</strong> policy support. In Ahmedabad, CO 2 emission reductionsare more modest, with nearly undetectable reductions <strong>in</strong> emissions (up to 5%) under the leastaggressivescenario, <strong>and</strong> up to 11% reductions <strong>in</strong> CO 2 <strong>and</strong> 23% reductions <strong>in</strong> other primary localpollutants under more aggressive scenarios.vii❚❚❚ Executive SummaryElectric two-wheelers have the potential to improve local air quality <strong>and</strong> greenhouse gas emissionscompared to gasol<strong>in</strong>e two-wheelers. They can also reduce noise pollution to the extent that they cancompete <strong>in</strong> the market aga<strong>in</strong>st gasol<strong>in</strong>e two-wheelers. There are some fundamental performanceissues that put them at a disadvantage, <strong>in</strong>clud<strong>in</strong>g speed, range, <strong>and</strong> recharg<strong>in</strong>g time. Their operat<strong>in</strong>gcosts can be significantly lower, however, thus counteract<strong>in</strong>g some of the performance issues. Earlydeployments <strong>in</strong> both Viet Nam <strong>and</strong> <strong>India</strong> have been somewhat unsuccessful due to unreliable vehicles<strong>and</strong> have created problems with the perception of this unproven technology. A strong preference forgasol<strong>in</strong>e two-wheelers, regardless of price <strong>and</strong> performance, <strong>in</strong>dicates that the electric two-wheeler<strong>in</strong>dustry <strong>and</strong> government <strong>and</strong> nongovernment organizations should engage <strong>in</strong> active market<strong>in</strong>g<strong>and</strong> public awareness, aside from develop<strong>in</strong>g supportive electric two-wheeler policy. In addition,supportive electric two-wheeler policy should be coupled with a robust battery manufacture <strong>and</strong>recycl<strong>in</strong>g policy that would support all transportation. Electric two-wheelers can provide low-cost,low-noise, <strong>and</strong> low-emission vehicles, but are currently compet<strong>in</strong>g <strong>in</strong> a difficult market aga<strong>in</strong>st amore mature, but less environmentally friendly mode—gasol<strong>in</strong>e two-wheelers. Work<strong>in</strong>g with theelectric two-wheeler <strong>in</strong>dustry to improve their image, improve performance, <strong>and</strong> provide supportivepolicy could be the impetus to beg<strong>in</strong> wide-scale adoption of electric two-wheelers <strong>in</strong> these largemarkets.
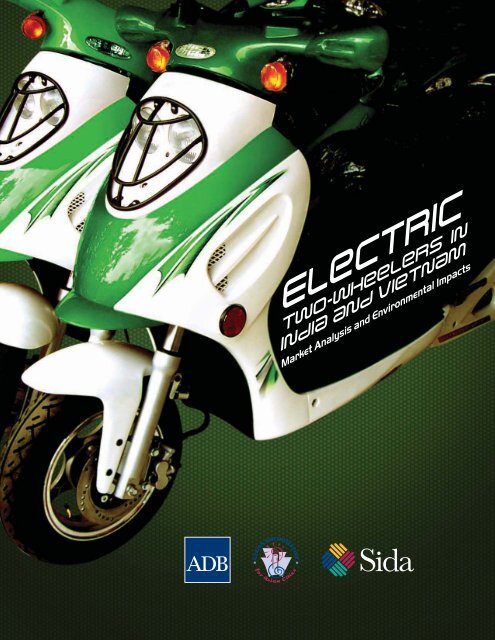
IntroductionElectric bike (e-bike) use has rapidlyexp<strong>and</strong>ed <strong>in</strong> the People’s Republic ofCh<strong>in</strong>a (PRC), <strong>in</strong> the process chang<strong>in</strong>g themode split of many cities. Currently, the PRCproduces over 20 million e-bikes yearly, up froma few thous<strong>and</strong> a decade ago. 1 E-bikes <strong>in</strong> thePRC are def<strong>in</strong>ed as electric two-wheelers withrelatively low speeds <strong>and</strong> weights compared toa motorcycle. Both bicycle-style e-bikes (withfunction<strong>in</strong>g pedals) <strong>and</strong> scooter-style e-bikes(with many of the features of gasol<strong>in</strong>e scooters)are classified as bicycles <strong>and</strong> are given access tobicycle <strong>in</strong>frastructure.E-bikes have risen <strong>in</strong> popularity <strong>in</strong> the PRC dueto restriction of gasol<strong>in</strong>e motorcycles, extensivebicycle <strong>in</strong>frastructure, <strong>and</strong> <strong>in</strong>creased car <strong>and</strong>public transit congestion. However, the rise <strong>in</strong>e-bikes <strong>in</strong> the PRC has not spread to the rest ofAsia. In fact, few cities <strong>in</strong> other Asian countrieshave any presence of e-bikes. In countries withdom<strong>in</strong>ant gasol<strong>in</strong>e two-wheeler mode split,replac<strong>in</strong>g those vehicles with electric twowheelerscould improve air quality <strong>and</strong> reducegreenhouse gases.<strong>in</strong>fluence the adoption of electric scooters(e-scooters) <strong>in</strong> these countries. It also focuseson the tailpipe emission reductions that couldoccur if e-scooters were adopted. It is importantto note that the study <strong>in</strong>vestigates the potential<strong>and</strong> relative benefits of substitut<strong>in</strong>g electric twowheelers(e-scooters) for gasol<strong>in</strong>e two-wheelers.This report does not <strong>in</strong>vestigate the potentialshift to other modes, such as cars, mass transit,or nonmotorized transport, nor their impacts. It isexpected that a shift from gasol<strong>in</strong>e two-wheelerto e-scooter would result <strong>in</strong> environmental shifts,but that safety <strong>and</strong> mobility costs <strong>and</strong> benefitswould not change much.Figure 1: Typical Electric ScooterThis study focuses on market potential <strong>in</strong>Ahmedabad, <strong>India</strong>, <strong>and</strong> Ha Noi, Viet Nam.From these cities, the study estimates price,performance, <strong>and</strong> regulatory factors that canSource: Authors.1Jamerson, F.E., <strong>and</strong> E. Benjam<strong>in</strong>. 2007. Electric Bikes Worldwide Reports—20,000,000 Light Electric Vehicles<strong>in</strong> 2007. http://ebwr.com/<strong>in</strong>dex.php
2❚❚❚ Electric <strong>Two</strong>-<strong>Wheelers</strong> <strong>in</strong> <strong>India</strong> <strong>and</strong> Viet NamBackgroundE-scooters are two-wheeled motorized vehiclesthat are similar to gasol<strong>in</strong>e-powered scooters<strong>and</strong> motorcycles, except that they operate solelyon battery power (Figure 1). As an alternative tothe gasol<strong>in</strong>e-powered scooter <strong>and</strong> motorcycle,the e-scooter offers efficiency ga<strong>in</strong>s <strong>and</strong>, as theyhave zero local tailpipe emissions <strong>and</strong> are virtuallysilent, air <strong>and</strong> noise pollution reductions.E-scooters have become popular <strong>in</strong> the PRC, butbecause of regulations, their design has beenlimited to low-power (less than 500 watts [W]),light-weight (less than 60 kilograms [kg]), <strong>and</strong> lowspeedmodels (less than 40 kilometers per hour[km/h]). These scooters do not provide thenecessary performance to compete aga<strong>in</strong>stgasol<strong>in</strong>e scooters <strong>and</strong> motorcycles <strong>in</strong> othercountries. Most Ch<strong>in</strong>ese e-bike producers do nothave an <strong>in</strong>centive to develop larger models solelyfor the export market, given the strong domesticmarket for smaller models. Given this, exist<strong>in</strong>ge-scooters are generally unsuitable for themarkets outside of the PRC. Some companiesoutside of the PRC are develop<strong>in</strong>g larger scalee-scooters that can compete aga<strong>in</strong>st smalldisplacement (
Ha Noi, Viet NamIn Viet Nam, private transport is dom<strong>in</strong>ated bygas-powered motorcycles. In 2005, there were1.5 million registered motorcycles <strong>in</strong> Viet Nam’scapital of Ha Noi for a population of 3 millionpeople, with motorcycles compris<strong>in</strong>g 65% of allvehicular trips. 6 Motorcycle ownership <strong>in</strong> Ha Noi<strong>and</strong> throughout Viet Nam cont<strong>in</strong>ues to grow atan average annual rate of more than 14%. 7At the same time, motorcycles are the ma<strong>in</strong>contributor to Ha Noi’s air quality issues, wherelevels of particulate matter exceed the nationalambient air quality st<strong>and</strong>ards. Of all known localemissions of particulate matter, 40% orig<strong>in</strong>atefrom vehicular sources, <strong>and</strong> motorcycles havethe largest share of vehicle emissions, emitt<strong>in</strong>g43% of particulate matter <strong>and</strong> more than 54%of carbon monoxide (CO) <strong>and</strong> hydrocarbons. 8 Inaddition, motorcycles are the primary source ofHa Noi’s urban noise pollution.The prevalence of motorcycle use <strong>and</strong> the relatedenvironmental issues would make Ha Noi seem,like many cities <strong>in</strong> the PRC, a market primedfor e-scooters. In Viet Nam, however, thetransition from motorcycles to e-scooters hasbeen the very opposite of that <strong>in</strong> the PRC, withe-scooters fail<strong>in</strong>g to make market penetration.In <strong>in</strong>terviews conducted <strong>in</strong> Ha Noi, <strong>Vietnam</strong>esemotorcycle riders conveyed a number of reasonsthat potentially expla<strong>in</strong> why Viet Nam has not yetadopted e-scooters, <strong>in</strong>clud<strong>in</strong>g their <strong>in</strong>ferior speed<strong>and</strong> range, but also the perceived greater comfort<strong>and</strong> style that is offered by a motorcycle. In thePRC, regulations aga<strong>in</strong>st motorcycles are extensive<strong>and</strong> exclusive bicycle <strong>in</strong>frastructure make e-bikes<strong>and</strong> e-scooters particularly attractive. 9Despite <strong>Vietnam</strong>ese riders’ negative perceptionof them, e-scooters offer a potential solutionto Ha Noi’s air <strong>and</strong> noise pollution if adoptedas a motorcycle alternative. Thus, it is valuableto explore what limits this adoption, <strong>and</strong> tounderst<strong>and</strong> the ability of technology <strong>and</strong><strong>in</strong>centives such as sales tax breaks to overcomethese impediments. Optimally, this <strong>in</strong>vestigationwould be accomplished by observ<strong>in</strong>g theactual purchas<strong>in</strong>g decisions <strong>and</strong> trade-offs of<strong>Vietnam</strong>ese riders between e-scooters <strong>and</strong>motorcycles, but the nature of the problem <strong>in</strong>Ahmedabad <strong>and</strong> Ha Noi precludes the use of realpurchas<strong>in</strong>g data <strong>and</strong> <strong>in</strong>stead requires the use ofhypothetical choice data.3❚❚❚ Introduction6World Bank. 2006. <strong>Vietnam</strong>–Hanoi Urban Transport Development Project. World Bank report numberAB2656 2006/11/22.7Tuan, V.A., <strong>and</strong> T. Shimizu. 2005. Model<strong>in</strong>g of Household Motorcycle Ownership Behavior <strong>in</strong> Hanoi City.Journal of Eastern Asia Society of Transportation Studies 6; Meszler (2007).8Schipper, L., et al. 2008. Measur<strong>in</strong>g the Invisible Quantify<strong>in</strong>g Emissions Reductions from Transport Solutions:Hanoi Case Study. EMBARQ–World Resources Institute; World Bank. 2008. Attack<strong>in</strong>g <strong>Air</strong> Pollution <strong>in</strong> Hanoi.http://go.worldbank.org/9DFE1YV5409Cherry, C., et al. 2009. Electric Bikes <strong>in</strong> the People’s Republic of Ch<strong>in</strong>a (PRC): Impact on the Environment <strong>and</strong>Prospects for Growth. Asian Development Bank: Manila.
Market AnalysisThis study attempts to identify future marketgrowth <strong>and</strong> potential for a new productwith a significant amount of uncerta<strong>in</strong>tyrelated to energy prices <strong>and</strong> regulation ofcompet<strong>in</strong>g modes. A common method to analyzenew product penetration is to conduct a statedpreferencechoice experiment.Choice Experiment Survey DesignThe choice experiment was designed to measurethe effects of performance, cost, <strong>and</strong> policy variableattributes on the <strong>Vietnam</strong>ese <strong>and</strong> <strong>India</strong>nrider’s decision to purchase an e-scooter over agasol<strong>in</strong>e motorcycle or scooter. In each decisionquestion, buyers of two-wheeled motorized vehicles<strong>in</strong> Ha Noi <strong>and</strong> Ahmedabad were presentedwith three hypothetical vehicles. In Ha Noi, thechoice set <strong>in</strong>cluded a st<strong>and</strong>ard gasol<strong>in</strong>e motorcycle,a large gasol<strong>in</strong>e motorcycle, <strong>and</strong> an e-scooter. InAhmedabad, the choice set <strong>in</strong>cluded a st<strong>and</strong>ardgasol<strong>in</strong>e motorcycle, a st<strong>and</strong>ard gasol<strong>in</strong>e scooter,<strong>and</strong> an e-scooter. A st<strong>and</strong>ard gasol<strong>in</strong>e scooterwas <strong>in</strong>cluded <strong>in</strong> Ahmedabad because of theirrelative popularity <strong>in</strong> <strong>India</strong>, whereas Ha Noi hadvery few scooters <strong>in</strong> the two-wheeler market.The three hypothetical vehicles varied <strong>in</strong> terms oftheir attributes, <strong>and</strong> respondents were <strong>in</strong>structedto <strong>in</strong>dicate the vehicle they would most prefer topurchase, based solely on the attributes providedfor each alternative.Attributes <strong>and</strong> LevelsThe number of attributes that can be tested<strong>in</strong> a choice experiment is limited by the abilityof respondents to choose between complexalternatives. To m<strong>in</strong>imize the cognitive burdenon subjects <strong>in</strong> Ha Noi, alternatives varied alonga limit of n<strong>in</strong>e attributes. This meant that not allimportant choice attributes could be <strong>in</strong>cluded<strong>in</strong> the experiment. In an attempt to control forthe omission of relevant variables, subjects were<strong>in</strong>structed to assume that all unlisted attributeswere the same for all of the hypothetical vehicles.In Ahmedabad, alternatives varied among11 attributes, add<strong>in</strong>g two attributes deemedimportant to <strong>India</strong>’s population, but perhaps lessimportant <strong>in</strong> Viet Nam’s case.The attributes <strong>in</strong>cluded <strong>in</strong> the choice experimentwere those deemed most critical based on theresults of previous stated-preference studies foralternative vehicles <strong>and</strong> based on <strong>in</strong>terviews with<strong>Vietnam</strong>ese <strong>and</strong> <strong>India</strong>n riders. 10 The entire set of10Hensher, D.A. 1982. Functional Measurement, Individual Preference <strong>and</strong> Discrete-Choice Model<strong>in</strong>g: Theory<strong>and</strong> Application. Journal of Economic Psychology. 2(4). pp. 323–335; Calfee, J. 1985. Estimat<strong>in</strong>g the Dem<strong>and</strong>for Electric Automobiles Us<strong>in</strong>g Fully Disaggregated Probabilistic Choice Analysis. Transportation Research PartB. 19(4). pp. 287–301; Bunch, D.S., et al. 1993. Dem<strong>and</strong> for <strong>Clean</strong>-Fuel Vehicles <strong>in</strong> California: A Discrete-Choice Stated Preference Pilot Project. Transportation Research Part A. 27(3). pp. 237–253; Ew<strong>in</strong>g, G., <strong>and</strong>
experimental attributes <strong>in</strong>cludes the follow<strong>in</strong>gpo<strong>in</strong>ts:(i) Purchase price: price of vehicle not<strong>in</strong>clud<strong>in</strong>g registration tax, sales tax, orvalue-added tax (VAT);(ii) Refuel or recharge range: the numberof kilometers that can be traveled on afull tank of gas or a full charge beforeneed<strong>in</strong>g to refuel or recharge;(iii) Refuel or recharge time: the amount oftime <strong>in</strong> m<strong>in</strong>utes required to fill an emptygas tank or to recharge a battery fromzero charge to full charge;(iv) Fuel or electricity cost: operat<strong>in</strong>g coststated <strong>in</strong> terms of <strong>Vietnam</strong>ese dong per100 kilometers (D/100 km) <strong>in</strong> Ha Noi<strong>and</strong> rupees per kilometer (Rs/km) <strong>in</strong>Ahmedabad;(v) Ma<strong>in</strong>tenance cost: rout<strong>in</strong>e costs ofma<strong>in</strong>tenance such as battery replacement,measured as dong per month(D/month) <strong>in</strong> Ha Noi <strong>and</strong> Rs per 15,000km <strong>in</strong> Ahmedabad;(vi) Acceleration: measured relative to thest<strong>and</strong>ard motorcycle as a percentage,where the acceleration of the st<strong>and</strong>ardmotorcycle is 0–40 km <strong>in</strong> 10 seconds <strong>in</strong>Ha Noi (In Ahmedabad, it is expressed astime to reach 30 km/h);(vii) Top speed: fastest achievable speed <strong>in</strong>kilometers per hour;(viii) License requirement: whether a license isrequired to operate the vehicle;(ix) Sales <strong>and</strong> registration tax: comb<strong>in</strong>edsales <strong>and</strong> registration tax (<strong>in</strong>dependentof purchase price) expressed <strong>in</strong> millionsof dong <strong>and</strong> owed upon purchase (InAhmedabad, it is the VAT, expressed<strong>in</strong> Rs.);(x) Transmission: manual or automatictransmission (not <strong>in</strong>cluded <strong>in</strong> Ha Noibecause most motorcycles have manualtransmissions);(xi) Carry<strong>in</strong>g capacity, expressed <strong>in</strong> number ofadults, which was explicitly <strong>in</strong>cluded <strong>in</strong> thechoice experiment <strong>in</strong> Ahmedabad s<strong>in</strong>cetwo-wheelers were considered importantbased on conversations with local experts.Accurate values for the vehicle attribute levelswere determ<strong>in</strong>ed with the aid of transporteng<strong>in</strong>eers specializ<strong>in</strong>g <strong>in</strong> the study of motorcycles<strong>and</strong> e-scooters. The vehicle attribute levels wereselected to reflect technology both current <strong>and</strong><strong>in</strong> the foreseeable future. In particular, the rangesfor the e-scooter attributes were constructedto conta<strong>in</strong> values for the “average” e-scootertoday, but also to conta<strong>in</strong> plausible values forcutt<strong>in</strong>g-edge e-scooters that may emerge <strong>in</strong> thenext few years; this allows for a better analysis ofhow technological developments may <strong>in</strong>fluencee-scooter dem<strong>and</strong>.5 5❚❚❚ Market AnalysisSarigollu, E. 2000. Assess<strong>in</strong>g Consumer Preference for <strong>Clean</strong>-Fuel Vehicles: A Discrete Choice Experiment.Journal of Public Policy <strong>and</strong> Market<strong>in</strong>g. 19. pp. 106–118; Brownstone, D., <strong>and</strong> K. Tra<strong>in</strong>. 1999. Forecast<strong>in</strong>gNew Product Penetration with Flexible Substitution Patterns. Journal of Econometrics. 89. pp. 109–129;Chiu, Y.C., <strong>and</strong> G.H. Tzeng. 1999. Transportation Research Part D. 4 (2). pp. 127–146; Ew<strong>in</strong>g, G., <strong>and</strong>E. Sarigollu. 1998. Car Fuel-Type Choice Under Travel Dem<strong>and</strong> Management <strong>and</strong> Economic Incentives. TransportationResearch Part D. 3. pp. 429–444; Dagsvik, J. et al. 2002. Potential Dem<strong>and</strong> for Alternative Fuel Vehicles.Transportation Research Part B. 36. pp. 361–384; Potoglou, D., <strong>and</strong> P. Kanaroglou. 2007. HouseholdDem<strong>and</strong> <strong>and</strong> Will<strong>in</strong>gness to Pay for <strong>Clean</strong> Vehicles. Transportation Research Part D. 12. pp. 264–274.
6❚❚❚ Electric <strong>Two</strong>-<strong>Wheelers</strong> <strong>in</strong> <strong>India</strong> <strong>and</strong> Viet NamThe tax <strong>in</strong>centive attribute levels were chosento vary around the status quo for a st<strong>and</strong>ardmotorcycle, with zero tax as a lower bound.The nonzero value for the sales <strong>and</strong> registrationtax was set to approximate 10% of the currentpurchase price for a st<strong>and</strong>ard motorcycle,10% be<strong>in</strong>g close to the actual current value ofcomb<strong>in</strong>ed sales <strong>and</strong> registration taxes. For theVAT, the nonzero value was set to approximate20% of the current purchase price, represent<strong>in</strong>gan upper bound for tax <strong>in</strong>centive policies.For most of the vehicle attributes, three levelswere sufficient to cover the range of values. InHa Noi, refuel or recharge time was assignedfour levels to cover the range of recharge timesfor an e-scooter, which spans from 10 m<strong>in</strong>utesto 6 hours. In Ahmedabad, refuel or rechargetime was assigned three levels. Whether ornot a license requirement exists for a particularvehicle was <strong>in</strong>dicated as an important decisiondeterm<strong>in</strong>ant <strong>in</strong> <strong>in</strong>terviews with <strong>Vietnam</strong>eseriders. Thus, a license requirement attributewas <strong>in</strong>cluded <strong>in</strong> two levels: “Yes”, a license isrequired; or “No”, a license is not required. Thest<strong>and</strong>ard motorcycle was taken to be the basecase vehicle, <strong>and</strong>, as such, most of its attributeswere set as constants, with the exception of sales<strong>and</strong> registration tax, which was allowed to varyto assess st<strong>and</strong>ard motorcycle tax policy. Someof the vehicle attributes for the large motorcyclewere also fixed at constants <strong>in</strong> <strong>in</strong>stances whendo<strong>in</strong>g so was <strong>in</strong>tuitive. For example, the licenserequirement for a large motorcycle was fixedat “Yes,” because current law requires anoperat<strong>in</strong>g license, <strong>and</strong> there is no possibility <strong>in</strong> theforeseeable future of this licens<strong>in</strong>g requirementbe<strong>in</strong>g repealed. All attributes <strong>and</strong> their levels arepresented <strong>in</strong> Table 1.Choice SetsEach choice set consisted of one of each vehicletype, with the attribute values of the alternativesset at particular levels. Vary<strong>in</strong>g the comb<strong>in</strong>ationsof attribute levels generates different choicesets. In both cases, the full factorial design that<strong>in</strong>cludes all possible comb<strong>in</strong>ations of attributeswould require billions of choice sets. To reducethe number of potential scenarios, a fractionalfactorial design was used to generate anorthogonal ma<strong>in</strong>-effects matrix consist<strong>in</strong>g of72 choice sets. This design allowed the ma<strong>in</strong>effect of each attribute level to be estimatedwithout confound<strong>in</strong>g.The 72 choice sets were blocked <strong>in</strong>to 12 sectionsof 6, <strong>and</strong> each respondent was presentedwith one of these blocks (answered 6 choicequestions). The first respondent would face thefirst 6 choice sets; the second respondent wouldface the next 6 choice sets, <strong>and</strong> so forth; afterthe 12th respondent, the list of choice sets wouldrecycle, with the 13th respondent fac<strong>in</strong>g the first6 choice sets. Figure 2 presents an example of achoice question from the Ha Noi survey. Figure 3presents an example of a choice question fromthe Ahmedabad survey.Sampl<strong>in</strong>gIn both cases, future two-wheeler purchaserswere targeted. In Ha Noi, this <strong>in</strong>cluded almostevery household as motorized two-wheelerownership is over one vehicle per householdon average <strong>and</strong> over 84% of households ownat least one motorbike. 11 This is confirmed by80% of the households surveyed, which statedthat they are likely to purchase a motorized11Schipper et al. 2008.
two-wheeler <strong>in</strong> the next 5 years. In Ha Noi, ahousehold survey was conducted, stratified bypopulation. Table 2 shows the stratification bydistrict, with a total of 400 households surveyed.Table 3 shows the basic demographics of thesample.Unfortunately, surveys for stratify<strong>in</strong>g by householdwere logistically difficult <strong>in</strong> Ahmedabad. Instead,a stratified <strong>in</strong>tercept approach was undertaken,sampl<strong>in</strong>g <strong>in</strong>dividuals at major trip generators <strong>in</strong>different sectors of the city. Figure 4 shows thesectors of the city, coupled with the population<strong>in</strong> those sectors. Different sections of Ahmedabadwere sampled accord<strong>in</strong>g to the populationdistribution, with a total sample size of 1,009respondents.Table 4 shows the sample characteristics ofthe Ahmedabad survey. Most strik<strong>in</strong>g is thedisproportionate number of males surveyed,which is primarily expla<strong>in</strong>ed by the culturalbarriers of the predom<strong>in</strong>ately male survey team,coupled with the <strong>in</strong>tercept sampl<strong>in</strong>g approach. In7 7❚❚❚ Market AnalysisTable 1: Experimental Attributes <strong>and</strong> LevelsAttributes(Ha Noi Underl<strong>in</strong>ed,Ahmedabad <strong>in</strong> Italics)St<strong>and</strong>ard MotorcycleMotorcycleLarge MotorcycleMotor ScooterElectric ScooterElectric ScooterPurchase price(D million)1010, 15, 308, 12, 164(Rs)Refuel/Recharge range(km)Refuel/Recharge time(m<strong>in</strong>)Fuel/Electricity cost(D/100 km)(Rs/km)Ma<strong>in</strong>tenance cost(D/month)(Rs/15,000 km)AccelerationXX% different fromst<strong>and</strong>ard motorcycle38,400; 58,700;79,000100560, 730, 9005530,0000.7, 1.08, 1.4532,000; 39,500;47,000200225, 500, 77510520,000; 30,000;40,0000.87, 1.10, 1.3315,000; 27,750;40,50060, 120, 20045, 130, 21510, 15, 30, 36010, 240, 4202,500; 5,000; 7,5000.02, 0.06, 0.11204,500204,50070, 100, 1406,800; 7,750; 8,70020% slower than 20% slower than0–40 km <strong>in</strong> 10 sec st<strong>and</strong>ard, same as st<strong>and</strong>ard, same asst<strong>and</strong>ard, 20% faster st<strong>and</strong>ard, 20% fasterthan st<strong>and</strong>ardthan st<strong>and</strong>ard0–30 km/h <strong>in</strong> XX sec2, 4, 62.5, 5, 7.53, 6, 9Top speed (km/h) 8060, 80, 10040, 50, 6065, 95, 12560, 80, 10030, 45, 60License Required Yes Yes Yes, NoSales <strong>and</strong> registration tax(D million)(Rs)Transmission(Ahmedabad only)Carry<strong>in</strong>g capacity(Ahmedabad only)0, 1.4, 2.80; 4,750; 9,5000, 1.4, 2.80; 3,600; 7,2000, 1.4, 2.80; 1,600; 3,200Manual Manual, Automatic Automatic2 adults, 3 adults 2 adults 1 adult, 2 adultsD = dong, km = kilometer, km/h = kilometer per hour, m<strong>in</strong> = m<strong>in</strong>ute, Rs = rupee, Rs/km = rupees per kilometer.Source: Authors.
Figure 2: Sample Choice Question (Ha Noi)8❚❚❚ Electric <strong>Two</strong>-<strong>Wheelers</strong> <strong>in</strong> <strong>India</strong> <strong>and</strong> Viet NamSuppose the follow<strong>in</strong>g three options are the only available alternatives for purchas<strong>in</strong>g atwo-wheeled motorized vehicle. Please <strong>in</strong>dicate which vehicle you prefer by check<strong>in</strong>g oneof the boxes below.St<strong>and</strong>ard GasMotorcyleLarge GasMotorcycleElectricScooterPurchase price (D million) 10 15 8Refuel range (km) 100 200 120Refuel/recharge time (m<strong>in</strong>) 5 10 30Fuel/Electricity cost (D/100 km) 30,000 30,000 5,000Ma<strong>in</strong>tenance cost (D/month) 20,000 20,000 100,000Acceleration0–40 km/h <strong>in</strong>10 seconds20% faster than“st<strong>and</strong>ard motorcycle”Same as “st<strong>and</strong>ardmotorcycle”Top speed (km/h) 80 80 50License required Yes Yes YesSales/Registration tax (Dmillion)2.8 1.4 1.4D = dong, D/100 km = dong per 100 kilometers, D/month = dong per month, km = kilometer, km/h = kilometer per hour,m<strong>in</strong> = m<strong>in</strong>ute.Source: Authors.Figure 3: Sample Choice Question (Ahmedabad)Suppose the follow<strong>in</strong>g three options are the only available alternatives for purchas<strong>in</strong>g atwo-wheeled motorized vehicle. Please <strong>in</strong>dicate which vehicle you prefer by check<strong>in</strong>g oneof the boxes below.Gasol<strong>in</strong>eMotorcycleGasol<strong>in</strong>eScooterElectricScooterPurchase price (Rs) 58,700 32,000 27,750Refuel range (km) 560 500 130Refuel/Recharge time (m<strong>in</strong>) 5 5 240Fuel/Electricity cost (Rs/km) 1.45 1.10 0.06Ma<strong>in</strong>tenance cost4,500 4,500 7,750(Rs/15,000 km)Acceleration0–30 km/h <strong>in</strong>4 seconds0–30 km/h <strong>in</strong>5 seconds0–30 km/h <strong>in</strong>6 secondsTop speed (km/h) 95 80 40Carry<strong>in</strong>g capacity (adults) 2 2 1Transmission Manual Manual AutomaticLicense required Yes Yes NoSales/Registration tax (Rs) 4,750 7,200 0km = kilometer; km/h = kilometer per hour; m<strong>in</strong> = m<strong>in</strong>ute; Rs = rupee; Rs/15,000 km = rupees per 15,000 kilometers;Rs/km = rupees per kilometer.Source: Authors.
Table 2: Population <strong>and</strong> Target Sample per District(Ha Noi)District NamePopulation(1,000persons)SampleSizeDistrictNamePopulation(1,000persons)SamplesizeUrban core <strong>and</strong> urban fr<strong>in</strong>ge districtsSuburban <strong>and</strong> rural districtsBa D<strong>in</strong>h 231 30 Tu Liem 262 25Hoan Kiem 179 25 Thanh Tri 165 20Hai Ba Trung 312 40 Soc Son 266 10Dong Da 372 45 Dong Anh 288 10Tay Ho 108 15 Gia Lam 212 30Thanh Xuan 196 40Cau Giay 171 40Hoang Mai 236 30Long Bien 186 40Total 1,991 305 Total 1,193 959 9❚❚❚ Market AnalysisSource: Nguyen, Q. 2007. Integration of Transport <strong>and</strong> L<strong>and</strong> Use <strong>in</strong> Hanoi: Can We Relieve Traffic Congestion by Relocat<strong>in</strong>gSome Major L<strong>and</strong>-Uses? Master’s thesis. International Institute for Geo-<strong>in</strong>formation Science <strong>and</strong> Earth Observation. Enschede,The Netherl<strong>and</strong>s.Table 3: Sample Characteristics(Ha Noi)Gender Female 46%Male 54%Mean age of41.3household headNumber of vehicles Cars 0.15<strong>in</strong> average householdMotorcycles 1.91Bicycles 0.93E-scooters 0.09Household <strong>in</strong>come Less than 3 17%(D million/month) (%)3–6 40%6–9 24%9–20 16%More than 20 3%Purchase motorized Def<strong>in</strong>itely 39%2-wheeler <strong>in</strong> next5 yearsVery likely 18%Likely 24%Unlikely 14%No chance 6%D = dong, e-scooter = electric scooter.Source: Authors.
10Figure 4: Geographic Sampl<strong>in</strong>g Scheme(Ahmedabad)❚❚❚ Electric <strong>Two</strong>-<strong>Wheelers</strong> <strong>in</strong> <strong>India</strong> <strong>and</strong> Viet NamSource: Authors.Table 4: Sample Characteristics (Ahmedabad)GenderMean age ofrespondentNumber of vehicles <strong>in</strong>average householdHousehold <strong>in</strong>come(Rs/month)Purchase motorized2-wheeler <strong>in</strong> next 5yearsFemaleMale2%98%39.6Cars 0.11Bicycles 0.31Motorcycles 1.02E-scooters 0.01Motor scooters 0.52Less than0%2,5002,501–7,500 3%7,501–15,000 41%15,001–30,000 44%30,000 or11%moreDef<strong>in</strong>itely 17%Very likely 16%Likely 59%Unlikely 2%No chance 6%e-scooter = electric scooter, Rs = rupee.Note: Values <strong>in</strong> parentheses are average preference scores.Source: Authors.
Ahmedabad, 94% of the respondents stated thatthey were likely or more than likely to purchasea two-wheeler <strong>in</strong> the next 5 years, <strong>in</strong>dicat<strong>in</strong>g astrong future two-wheeler market.Vehicle Choice <strong>and</strong> RespondentPreferencesIn the choice experiment, a limited numberof vehicle-specific parameters were <strong>in</strong>cludedto determ<strong>in</strong>e the effects of vary<strong>in</strong>g vehicleattributes on vehicle choice, <strong>and</strong> to ultimatelycalibrate choice models that estimate marketshares. However, several factors could not be<strong>in</strong>cluded for the sake of model efficiency <strong>and</strong>variable type. In the questionnaire portion ofthe survey (outside the context of the choiceexperiment), respondents were asked a seriesof Likert Scale questions, rat<strong>in</strong>g the importanceof various vehicle parameters from 1 to 5,with 1 be<strong>in</strong>g not important <strong>and</strong> 5 be<strong>in</strong>g veryimportant. These factors could expla<strong>in</strong> someof the unobserved preference that is captured<strong>in</strong> the model’s alternative specific constants(see Market Estimation Results section) whererespondents subconsciously prefer vehiclesbased on perceptions that are not easily tested<strong>in</strong> traditional choice model<strong>in</strong>g frameworks.Figures 5–13 show the results of these questions<strong>in</strong> both Ahmedabad <strong>and</strong> Ha Noi, expressed asa frequency of responses separated by vehiclechoice. If a respondent chose a particular typeof vehicle, the choice would be categorizedwith his or her rat<strong>in</strong>g to develop these figures.Ha Noi respondents were not asked to ratehelmet requirements or availability of recharg<strong>in</strong>gor refuel<strong>in</strong>g <strong>in</strong>frastructure. In addition to each ofthe charts, a preference score is applied to eachof the factors, by city <strong>and</strong> vehicle choice. Thisscore is calculated by assign<strong>in</strong>g a weight of 1 to“not important” up to 5 for “very important”<strong>and</strong> assumes that the strength of preference isl<strong>in</strong>ear from 1 to 5. The scores are weighted bythe proportion of the responses <strong>and</strong> allow directcomparison between values of respondents whochose different modes. For <strong>in</strong>stance, <strong>in</strong> Figure 5, anAhmedabad respondent who chose an e-scooter<strong>in</strong> the choice experiment (preference score 3.49)values “style” less than a respondent who chosea gasol<strong>in</strong>e motorcycle (preference score 3.49).The factors that vary most between modes <strong>in</strong>the same city are style, cargo-carry<strong>in</strong>g capacity,<strong>and</strong> replacement part availability, with e-scooterchoosers valu<strong>in</strong>g style <strong>and</strong> cargo-carry<strong>in</strong>gcapacity less than their counterparts, <strong>and</strong> valu<strong>in</strong>greplacement part availability more. Interest<strong>in</strong>gly,there were no significant differences betweenvehicle choosers on many of the metrics,<strong>in</strong>clud<strong>in</strong>g environmental performance, safety,<strong>and</strong> reliability of the vehicle.Market Estimation ResultsHa Noi, Viet NamThe model is estimated with sampl<strong>in</strong>g weightsfor the 14 strata, <strong>and</strong> reports robust st<strong>and</strong>arderrors. The explanatory variables <strong>in</strong> the model<strong>in</strong>clude alternative-specific constants <strong>and</strong> theexperimental attributes. The alternative-specificconstants, labeled “st<strong>and</strong>ard motorcycle” <strong>and</strong>“large motorcycle,” capture the <strong>in</strong>fluence ofthe type of vehicle on the choice decision,<strong>in</strong>dependent of the other explanatory factors. Theomitted alternative-specific variable “e-scooter”was selected as the reference alternative, <strong>and</strong>thus the coefficients for “st<strong>and</strong>ard motorcycle”<strong>and</strong> “large motorcycle” are <strong>in</strong>terpreted relativeto the e-scooter alternative. Acceleration <strong>and</strong>license requirement were treated as categorical,11 11❚❚❚ Market Analysis
10090807060% 50403020100Figure 7: How Do You Rate Safety <strong>in</strong> Vehicle Purchase Choice?1 2 3 4 5Ahmedabad: Motorcycle (2.91)Ahmedabad: Gas scooter (2.88)Ahmedabad: Electric scooter (3.10)Ha Noi: St<strong>and</strong>ard motorcycle (3.79)Ha Noi: Large motorcycle (3.80)Ha Noi: Electric scooter (3.79)13 13❚❚❚ Market AnalysisSafety (1 = not important, 5 = very important)e-scooter = electric scooter.Note: Values <strong>in</strong> parentheses are average preference scores.Source: Authors.Figure 8: How Do You Rate Comfort <strong>in</strong> Vehicle Purchase Choice?70605040%30201001 2 3 4 5Ahmedabad: Motorcycle (3.10)Ahmedabad: Gas scooter (2.90)Ahmedabad: Electric scooter (2.88)Ha Noi: St<strong>and</strong>ard motorcycle (3.38)Ha Noi: Large motorcycle (3.35)Ha Noi: Electric scooter (3.40)Comfort (1 = not important, 5 = very important)e-scooter = electric scooter.Note: Values <strong>in</strong> parentheses are average preference scores.Source: Authors.
144540Figure 9: How Do You Rate Cargo-Carry<strong>in</strong>g Capacity <strong>in</strong> Vehicle Purchase Choice?35❚❚❚ Electric <strong>Two</strong>-<strong>Wheelers</strong> <strong>in</strong> <strong>India</strong> <strong>and</strong> Viet Nam3025%201510501 2 3 4 5Ahmedabad: Motorcycle (2.30)Ahmedabad: Gas scooter (2.07)Ahmedabad: Electric scooter (1.75)e-scooter = electric scooter.Note: Values <strong>in</strong> parentheses are average preference scores.Source: Authors.Ha Noi: St<strong>and</strong>ard motorcycle (2.44)Ha Noi: Large motorcycle (2.74)Ha Noi: Electric scooter (2.57)Cargo Carry<strong>in</strong>g Capacity (1 = not important, 5 = very important)Figure 10: How Do You Rate Replacement Parts Availability <strong>in</strong> Vehicle Purchase Choice?605040% 30201001 2 3 4 5Ahmedabad: Motorcycle (2.91)Ha Noi: St<strong>and</strong>ard motorcycle (3.10)Ahmedabad: Gas scooter (2.88)Ha Noi: Large motorcycle (3.10)Ahmedabad: Electric scooter (3.10) Ha Noi: Electric scooter (3.24)Replacement Parts Availability (1 = not important, 5 = very important)e-scooter = electric scooter.Note: Values <strong>in</strong> parentheses are average preference scores.Source: Authors.
Figure 11: How Do You Rate Reliability <strong>in</strong> Vehicle Purchase Choice?908015 15706050%40302010❚❚❚ Market Analysis01 2 3 4 5Ahmedabad: Motorcycle (3.03)Ahmedabad: Gas scooter (2.94)Ahmedabad: Electric scooter (3.06)Reliability (1 = not important, 5 = very important)Ha Noi: St<strong>and</strong>ard motorcycle (3.61)Ha Noi: Large motorcycle (3.67)Ha Noi: Electric scooter (3.66)e-scooter = electric scooter.Note: Values <strong>in</strong> parentheses are average preference scores.Source: Authors.35Figure 12: How Do You Rate Recharg<strong>in</strong>g <strong>and</strong> Refuel<strong>in</strong>g Infrastructure<strong>in</strong> Vehicle Purchase Choice?302520%1510501 2 3 4 5Ahmedabad: Motorcycle (2.02)Ahmedabad: Gas scooter (1.99)Ahmedabad: Electric scooter (1.85)Recharge/Refuel<strong>in</strong>g Infrastructure (1 = not important, 5 = very important)e-scooter = electric scooter.Note: Values <strong>in</strong> parentheses are average preference scores.Source: Authors.
16Figure 13: How Do You Rate Helmet Requirements <strong>in</strong> Vehicle Purchase Choice?4035❚❚❚ Electric <strong>Two</strong>-<strong>Wheelers</strong> <strong>in</strong> <strong>India</strong> <strong>and</strong> Viet Nam3025% 201510501 2 3 4 5Ahmedabad: Motorcycle (2.39)Ahmedabad: Gas scooter (2.29)Ahmedabad: Electric scooter (2.16)Helmet Requirements (1 = not important, 5 = very important)e-scooter = electric scooter.Note: Values <strong>in</strong> parentheses are average preference scores.Source: Authors.<strong>and</strong> effects codes were generated for thesevariables.Given that previous research found gender to<strong>in</strong>fluence preferences over motorbikes <strong>and</strong> e-scooters, three gender-attribute <strong>in</strong>teractionvariables were created: range x male; top speed xmale; <strong>and</strong> price x male. 12 These variables capturethe jo<strong>in</strong>t effects of be<strong>in</strong>g male comb<strong>in</strong>ed withrefuel or recharge range, top speed, <strong>and</strong> price,<strong>and</strong> were <strong>in</strong>cluded as explanatory variablesalong with the alternative-specific constants <strong>and</strong>experimental attributes. The model estimates areshown <strong>in</strong> Table 5.All experimental attributes have the anticipatedsigns, <strong>and</strong> all are at least significant at the 95%level. Purchase price, refuel<strong>in</strong>g or recharg<strong>in</strong>gtime, fuel or electricity cost, ma<strong>in</strong>tenance cost,slower acceleration, license requirement, <strong>and</strong>tax all had negative effects on choice, whilerange, faster acceleration, <strong>and</strong> top speedhad positive effects. The coefficients for thealternative-specific constants are both positive,while only the st<strong>and</strong>ard motorcycle alternativespecificconstant is significant (p = 0.04), which<strong>in</strong>dicates that after tak<strong>in</strong>g all other explanatoryfactors <strong>in</strong>to account, respondents demonstrate apreference for a st<strong>and</strong>ard motorcycle relative toan e-scooter. The result that respondents prefermotorbikes to e-scooters, all else be<strong>in</strong>g equal, ismost likely attributable to omitted factors thatare associated with vehicle type, e.g., style,comfort, luggage space, safety, reliability, easeof f<strong>in</strong>d<strong>in</strong>g replacement parts, <strong>and</strong> environmental12Chiu <strong>and</strong> Tzeng 1999.
Table 5: Parameter Estimates of the Conditional Logit Model(Ha Noi)Variable Coefficient St<strong>and</strong>ard Error p-valuePurchase price (D million) (0.0928811) 0.0099441 0Refuel or recharge range (km) 0.004173 0.0010179 0Refuel or recharge time (m<strong>in</strong>) (0.0007025) 0.0003317 0.034Fuel or electricity cost (D/100 km) (0.0000155) 0.00000594 0.009Ma<strong>in</strong>tenance cost (D/month) (0.00000384) 0.00000167 0.02120% faster acceleration a 0.119782 0.0467819 0.0120% slower acceleration a (0.0978936) 0.0474261 0.039Top speed (km/h) 0.006553 0.0022026 0.003License required (0.0937764) 0.0482465 0.052Sales <strong>and</strong> registration tax (D) (0.1496249) 0.0241181 0Top speed x male 0.004764 0.0022562 0.035Range x male (0.002061) 0.0010027 0.04Price x male 0.0286288 0.0124639 0.022St<strong>and</strong>ard motorcycle 0.4413562 0.215009 0.04Large motorcycle 0.0886192 0.2193426 0.686N Obs 7,140Log-likelihood (0) (2403.7281)Log-likelihood (2371.7839)Wald chi-square 223.29 017 17❚❚❚ Market Analysis( ) = negative, D = dong, D/100 km = dong per 100 kilometers, D/month = dong per month, km = kilometer, km/h = kilometerper hour, m<strong>in</strong> = m<strong>in</strong>ute, N Obs = number of observations, sec = second.aRelative to st<strong>and</strong>ard motorcycle: 0–40 km <strong>in</strong> 10 sec.Source: Authors.friendl<strong>in</strong>ess; however, it may also be the casethat, even controll<strong>in</strong>g for omitted factors,<strong>Vietnam</strong>ese riders have a bias aga<strong>in</strong>st e-scootersdue to perceived poor quality or performance.An exam<strong>in</strong>ation of the gender-attribute <strong>in</strong>teractionsreveals that, as found <strong>in</strong> previous research,gender is an important decision determ<strong>in</strong>ant fore-scooters <strong>and</strong> motorbikes. 13 All three genderattribute<strong>in</strong>teraction variables are at least significantat the 0.05 level. The parameter for “rangex male” is negative, mean<strong>in</strong>g that, relative tofemales, males show a lower preference forbe<strong>in</strong>g able to travel an extended range beforeneed<strong>in</strong>g to refuel or recharge. “Top speed x male”is positive, which <strong>in</strong>dicates that males demonstrategreater preference than females for a highvehicle speed. “Price x male” is positive as well;the <strong>in</strong>terpretation is that higher purchase priceshave less of a dissuasive effect on males than13Chiu <strong>and</strong> Tzeng 1999.
18❚❚❚ Electric <strong>Two</strong>-<strong>Wheelers</strong> <strong>in</strong> <strong>India</strong> <strong>and</strong> Viet Namthey do on females (the male-dem<strong>and</strong> curve ismore <strong>in</strong>elastic). This gender-specific <strong>in</strong>formationis particularly valuable for e-scooter manufacturers,as it <strong>in</strong>dicates that a worthwhile market<strong>in</strong>gstrategy may be to produce l<strong>in</strong>es of e-scootersgeared to each gender. For example, relative toa female-l<strong>in</strong>e of e-scooters, manufacturers couldmodify the male-l<strong>in</strong>e by <strong>in</strong>creas<strong>in</strong>g its top speed<strong>in</strong> favor of cruis<strong>in</strong>g range, <strong>and</strong> any net <strong>in</strong>crease <strong>in</strong>production costs could be more readily absorbed<strong>in</strong> the purchase price by the <strong>in</strong>elastic maledem<strong>and</strong>curve.Will<strong>in</strong>gness to Pay Estimates <strong>and</strong> TaxEffectsUp to this po<strong>in</strong>t, discussion has centered onthe estimated parameter values. To providemean<strong>in</strong>gful <strong>in</strong>terpretations for the magnitudesof these parameters, <strong>and</strong> particularly to assessthe impact of tax <strong>in</strong>centives on the dem<strong>and</strong>for e-scooters, parameters are converted <strong>in</strong>tomonetary values. With<strong>in</strong> the r<strong>and</strong>om utilitymaximization framework, each parameterrepresents a marg<strong>in</strong>al utility. 14 The coefficienton price can thus be <strong>in</strong>terpreted as the marg<strong>in</strong>alutility of money, <strong>and</strong> multiply<strong>in</strong>g any otherattribute’s coefficient by the negative <strong>in</strong>verse ofthe price coefficient yields the marg<strong>in</strong>al rate ofsubstitution between that attribute <strong>and</strong> the price,which is the marg<strong>in</strong>al will<strong>in</strong>gness to pay (MWTP)for that attribute. 15 Follow<strong>in</strong>g this procedure<strong>and</strong> us<strong>in</strong>g the parameter estimates from the fullmodel, the MWTP for selected attributes werecomputed.The MWTP for the tax is –1.61 million dong foreach million dong <strong>in</strong>crease <strong>in</strong> the tax. Stateddifferently, a respondent would have to becompensated D1.61 million to <strong>in</strong>cur a D1 milliontax <strong>in</strong>crease <strong>and</strong> have his/her utility rema<strong>in</strong>unchanged; or stated another way, a respondentwould be will<strong>in</strong>g to pay D1.61 million extraon the price of a vehicle to avoid a D1 million<strong>in</strong>crease <strong>in</strong> the sales tax.With the units of change <strong>in</strong> the attributesdef<strong>in</strong>ed as <strong>in</strong> the choice experiment, the taxhas the largest will<strong>in</strong>gness to pay estimate of allsignificant variables. In particular, the effect ofthe tax is larger than the effect of the purchaseprice, which provides some evidence that a rider’scognitive response to an explicit tax <strong>in</strong>centiveis different from the response to an equivalentchange <strong>in</strong> price. The fact that the estimatedMWTP for tax is different from 1 (<strong>in</strong> magnitude)highlights the value of explicitly <strong>in</strong>clud<strong>in</strong>g the taxas an attribute <strong>in</strong> the choice experiment, becausethe different coefficients on the purchase price<strong>and</strong> the tax generate differ<strong>in</strong>g MWTP estimates.Us<strong>in</strong>g the coefficient on price to <strong>in</strong>fer the dem<strong>and</strong>effects of a tax <strong>in</strong>centive could lead to spuriousconclusions. Follow<strong>in</strong>g the method of price<strong>in</strong>ference, Ew<strong>in</strong>g <strong>and</strong> Sarigollu concluded that,although a tax <strong>in</strong>centive showed promise to boostthe adoption of alternative cars, its effect wassmaller than the effects of vehicle performanceattributes. 16 In contrast, explicitly <strong>in</strong>clud<strong>in</strong>g atax as an experimental attribute <strong>and</strong> observ<strong>in</strong>gits large marg<strong>in</strong>al <strong>in</strong>fluence (greater than the14Given an additively separable l<strong>in</strong>ear specification of <strong>in</strong>direct utility (Holmes, P., <strong>and</strong> W. Adamowicz. 2003.Attribute-Based Methods. In Champ, P., K. Boyle, <strong>and</strong> T. Brown, eds. A Primer on Nonmarket Valuation.Dordrecht, The Netherl<strong>and</strong>s: Kluwer Academic Publishers.).15Holmes <strong>and</strong> Adamowicz 2003.16Ew<strong>in</strong>g <strong>and</strong> Sarigollu 2000.
marg<strong>in</strong>al <strong>in</strong>fluence of price), this study concludesthat the <strong>in</strong>centive effect of a tax is larger than theeffects of vehicle performance attributes.In l<strong>in</strong>e with the current f<strong>in</strong>d<strong>in</strong>gs, Potoglou <strong>and</strong>Kanaroglou also obta<strong>in</strong>ed large MWTP estimatesfor sales tax (between C$2,000 <strong>and</strong> C$5,000);however, although their study explicitly <strong>in</strong>cludedtax as an attribute, their results are not directlycomparable to those <strong>in</strong> the present <strong>in</strong>vestigation.The tax was presented to respondents as a “nopurchase tax” <strong>in</strong>centive, <strong>and</strong> the actual amountof the tax <strong>in</strong> the absence of this <strong>in</strong>centive wasleft open to respondent <strong>in</strong>terpretation. Thus, <strong>in</strong>specify<strong>in</strong>g the MWTP for this <strong>in</strong>centive, the actualmonetary change <strong>in</strong> tax that would elicit aC$2,000–C$5,000 MWTP is left uncerta<strong>in</strong>. 17 Inthe design for this study, all possible values ofthe tax were controlled <strong>and</strong> specified explicitly <strong>in</strong>the experiment, thus allow<strong>in</strong>g for more precise<strong>in</strong>terpretations of MWTP.It is also worth not<strong>in</strong>g the large MWTP foracceleration <strong>and</strong> for license required, twovariables not <strong>in</strong>cluded <strong>in</strong> previous research one-scooter dem<strong>and</strong>. 18 Respondents would payD1.29 million for a 20% <strong>in</strong>crease <strong>in</strong> accelerationfrom the base level of 0–40 km <strong>in</strong> 10 seconds,<strong>and</strong> would pay D1.05 million to avoid a 20%decrease. Requir<strong>in</strong>g a license for a vehicle isequivalent to <strong>in</strong>creas<strong>in</strong>g that vehicle’s purchaseprice by D1.01 million.Market Share PredictionsIn this section, the results from the conditionallogit model are used to estimate market sharesfor st<strong>and</strong>ard motorcycles, large motorcycles,<strong>and</strong> e-scooters <strong>in</strong> Ha Noi, given various statesof technology <strong>and</strong> policy. The market shares arederived by comput<strong>in</strong>g probabilities as nonl<strong>in</strong>earcomb<strong>in</strong>ations of the estimated coefficients, withthe experimental attributes set at given values<strong>and</strong> the dummy variable for “Male” held at thesample mean of 0.54.The analysis exam<strong>in</strong>es three different statesof e-scooter technology: current, upgraded,<strong>and</strong> cutt<strong>in</strong>g-edge. Each state is comb<strong>in</strong>ed withboth low <strong>and</strong> high gasol<strong>in</strong>e price scenarios.Each comb<strong>in</strong>ation of e-scooter technology <strong>and</strong>gasol<strong>in</strong>e price scenario is comb<strong>in</strong>ed with twodifferent sales tax policies, one that reflects thecurrent taxation of e-scooters, <strong>and</strong> one thatprovides tax <strong>in</strong>centives for e-scooters. Marketshares are calculated for each comb<strong>in</strong>ation oftechnology, gasol<strong>in</strong>e price, <strong>and</strong> tax policy.Table 6 presents the attribute values thatwere selected for the three different states oftechnology <strong>in</strong> the low gasol<strong>in</strong>e price scenariowithout an e-scooter tax <strong>in</strong>centive.The upgraded state of technology implementsmid-level enhancements <strong>in</strong> e-scooter technology,relative to the current technology, withoutassociated <strong>in</strong>creases <strong>in</strong> price or operat<strong>in</strong>g costs.The e-scooter refuel range <strong>in</strong>creases from60 km to 120 km; the recharg<strong>in</strong>g time fallsfrom 360 m<strong>in</strong>utes to 30 m<strong>in</strong>utes; acceleration<strong>in</strong>creases from be<strong>in</strong>g 20% slower to the same asa st<strong>and</strong>ard motorcycle’s; <strong>and</strong> the top speed risesfrom 40 km/h to 50 km/h.19 19❚❚❚ Market Analysis17Potoglou <strong>and</strong> Kanaroglou 2007.18Chiu <strong>and</strong> Tzeng 1999.
20❚❚❚ Electric <strong>Two</strong>-<strong>Wheelers</strong> <strong>in</strong> <strong>India</strong> <strong>and</strong> Viet NamThe cutt<strong>in</strong>g-edge state of technology posits evenfurther improvements <strong>in</strong> refuel range, recharg<strong>in</strong>gtime, <strong>and</strong> top speed, relative to the upgradedtechnology, while assum<strong>in</strong>g these improvementsto be accompanied by associated <strong>in</strong>creases <strong>in</strong>price <strong>and</strong> operat<strong>in</strong>g costs. Refuel range <strong>in</strong>creasesto 200 km; recharg<strong>in</strong>g time falls to 10 m<strong>in</strong>utes;<strong>and</strong> top speed <strong>in</strong>creases to 60 km/h. Thee- scooter purchase price rises from D10 millionto D16 million. The electricity costs <strong>in</strong>crease fromD5,000/100 km to D7,500/100 km, reflect<strong>in</strong>ghigher energy requirements <strong>and</strong> also the capitalcosts of supercharg<strong>in</strong>g devices required for rapidrecharg<strong>in</strong>g. F<strong>in</strong>ally, the ma<strong>in</strong>tenance costs risefrom D100,000/month to D140,000/month toaccount for the greater expense of enhancedbatteries.In the low gasol<strong>in</strong>e price scenario, fuel costs areset at D30,000/100 km for both the st<strong>and</strong>ard<strong>and</strong> large motorcycles. These calculations arebased on a gasol<strong>in</strong>e price of D15,000 per liter<strong>and</strong> a specification of 50 km per liter for st<strong>and</strong>ard<strong>and</strong> large motorcycles. In late July 2008, theGovernment of Viet Nam cut back on fuelsubsidies <strong>and</strong> raised the price of retail gasol<strong>in</strong>eby 31% to approximately D20,000 per liter.Market share predictions based on the highgasol<strong>in</strong>e price scenario reflect this <strong>in</strong>crease<strong>in</strong> the price of gasol<strong>in</strong>e, <strong>and</strong> us<strong>in</strong>g the abovespecification for kilometers per liter, the fuelcosts are set at D40,000/100 km for both thest<strong>and</strong>ard <strong>and</strong> large motorcycles <strong>in</strong> the highgasol<strong>in</strong>e price scenario.Exam<strong>in</strong><strong>in</strong>g the taxes <strong>in</strong> Table 6, the sales tax foreach of the three vehicles is set at 10% of thepurchase price <strong>in</strong> the absence of the e-scooter tax<strong>in</strong>centive. These sales taxes are set to approximatethe current policy <strong>in</strong> Ha Noi. For the market sharepredictions based on the implementation of ane-scooter tax <strong>in</strong>centive, the sales tax for thee-scooter is set to 0%, while the sales taxesfor the st<strong>and</strong>ard <strong>and</strong> large motorcycles eachrema<strong>in</strong> at 10%. Table 7 shows the market sharepredictions for each state of technology underboth low <strong>and</strong> high gasol<strong>in</strong>e price scenarios, with<strong>and</strong> without the e-scooter tax <strong>in</strong>centive.Under the current technology with low gasol<strong>in</strong>eprice <strong>and</strong> no e-scooter tax <strong>in</strong>centive, thee-scooter is predicted to hold the smallest share ofthe market for two-wheeled motorized transportat 20%, with the large motorcycle hold<strong>in</strong>g 33%,<strong>and</strong> the st<strong>and</strong>ard motorcycle hold<strong>in</strong>g the largestshare with 47%. Mov<strong>in</strong>g to a high gasol<strong>in</strong>e pricewhile rema<strong>in</strong><strong>in</strong>g with the current technology<strong>and</strong> without an e-scooter tax <strong>in</strong>centive <strong>in</strong>creasesthe predicted e-scooter market share to 23%.In general, for a given state of technology <strong>and</strong>a given tax policy, mov<strong>in</strong>g from a low to highgasol<strong>in</strong>e price results <strong>in</strong> a 3% <strong>in</strong>crease <strong>in</strong> thepredicted e-scooter market share.An exam<strong>in</strong>ation of the posited technologicalimprovements reveals an <strong>in</strong>fluence on thepredicted market shares. Without the e-scootertax <strong>in</strong>centive, switch<strong>in</strong>g from the current stateof technology to the cutt<strong>in</strong>g-edge state oftechnology results <strong>in</strong> a 13% <strong>in</strong>crease <strong>in</strong> thepredicted e-scooter share of the market undereither gasol<strong>in</strong>e price scenario, from 20% to 33%<strong>in</strong> the low gasol<strong>in</strong>e price scenario, <strong>and</strong> from23% to 36% <strong>in</strong> the high gasol<strong>in</strong>e price scenario.Similarly, when the e-scooter tax <strong>in</strong>centive is<strong>in</strong> place, switch<strong>in</strong>g from current technology tocutt<strong>in</strong>g-edge technology <strong>in</strong>creases e-scootermarket share from 23% to 38% with lowgasol<strong>in</strong>e prices, <strong>and</strong> from 26% to 42% with highgasol<strong>in</strong>e prices.
Table 6: Low Gasol<strong>in</strong>e Price without Electric Scooter Tax Incentive(Ha Noi)AttributeCutt<strong>in</strong>g-EdgeTechnologyUpgradedTechnologyCurrentTechnologyPurchase price (D million)St<strong>and</strong>ard motorcycle 10 10 10Large motorcycle 15 15 15E-scooter 16 12 12Refuel range (km)St<strong>and</strong>ard motorcycle 100 100 100Large motorcycle 200 200 200E-scooter 200 120 60Refuel/Recharge time (m<strong>in</strong>)St<strong>and</strong>ard motorcycle 5 5 5Large motorcycle 10 10 10E-scooter 10 30 360Fuel/Electricity cost (D/100km)St<strong>and</strong>ard motorcycle 30,000 30,000 30,000Large motorcycle 30,000 30,000 30,000E-scooter 7,500 5,000 5,000Ma<strong>in</strong>tenance cost (D/month)St<strong>and</strong>ard motorcycle 20,000 20,000 20,000Large motorcycle 20,000 20,000 20,000E-scooter 140,000 100,000 100,000Acceleration aSt<strong>and</strong>ard motorcycle same as common same as common same as commonLarge motorcycle 20% faster 20% faster 20% fasterE-scooter 20% faster same as common 20% slowerTop speed (km/h)St<strong>and</strong>ard motorcycle 80 80 80Large motorcycle 80 80 80E-scooter 60 50 40LicenseSt<strong>and</strong>ard motorcycle Yes Yes YesLarge motorcycle Yes Yes YesE-scooter No No NoSales tax (D million)St<strong>and</strong>ard motorcycle 10% 10% 10%Large motorcycle 10% 10% 10%E-scooter 10% 10% 10%21 21❚❚❚ Market AnalysisD = dong, D/100 km = dong per 100 kilometers, D/month = dong per month, e-scooter = electric scooter, km = kilometer,km/h = kilometer per hour, m<strong>in</strong> = m<strong>in</strong>ute, sec = second.aRelative to st<strong>and</strong>ard motorcycle: 0–40 km <strong>in</strong> 10 sec.Source: Authors.
Table 7: Market Share <strong>in</strong> Ha Noi—Vary<strong>in</strong>g Tax, Fuel Price, <strong>and</strong> Technology22❚❚❚ Electric <strong>Two</strong>-<strong>Wheelers</strong> <strong>in</strong> <strong>India</strong> <strong>and</strong> Viet NamMarket Share Predictions for Alternative Technologies without Tax IncentiveCurrentTechnologyLow Gasol<strong>in</strong>e PriceUpgradedTechnologyCutt<strong>in</strong>g-EdgeTechnologyCurrentTechnologyHigh Gasol<strong>in</strong>e PriceUpgradedTechnologyCutt<strong>in</strong>g-EdgeTechnologySt<strong>and</strong>ard 0.47 (0.03) 0.41 (0.03) 0.40 (0.04) 0.46 (0.03) 0.39 (0.03) 0.38 (0.04)motorcycleLarge 0.33 (0.03) 0.28 (0.03) 0.27 (0.02) 0.32 (0.03) 0.27 (0.05) 0.26 (0.02)motorcycleE-scooter 0.20 (0.04) 0.31 (0.04) 0.33 (0.04) 0.23 (0.05) 0.34 (0.05) 0.36 (0.05)CurrentTechnologyMarket Share Predictions for Alternative Technologies with Tax IncentiveLow Gasol<strong>in</strong>e PriceUpgradedTechnologyCutt<strong>in</strong>g-EdgeTechnologyCurrentTechnologyHigh Gasol<strong>in</strong>e PriceUpgradedTechnologyCutt<strong>in</strong>g-EdgeTechnologySt<strong>and</strong>ard 0.46 (0.03) 0.39 (0.03) 0.37 (0.04) 0.44 (0.04) 0.36 (0.03) 0.34 (0.04)MotorcycleLarge 0.31 (0.03) 0.27 (0.03) 0.25 (0.02) 0.30 (0.03) 0.25 (0.03) 0.24 (0.02)motorcycleE-scooter 0.23 (0.04) 0.35 (0.04) 0.38 (0.04) 0.26 (0.05) 0.38 (0.05) 0.42 (0.05)e-scooter = electric scooter.Note: Values not enclosed <strong>in</strong> parentheses are the coefficients, while values with<strong>in</strong> parentheses are the st<strong>and</strong>ard errors. As aresult of round<strong>in</strong>g, the market shares for some alternatives may not sum to 1.Source: Authors.For a given state of technology <strong>and</strong> givengasol<strong>in</strong>e price scenario, the e-scooter tax<strong>in</strong>centive <strong>in</strong>creases the predicted market share ofe-scooters by 3% to 6%. Among the scenariosexam<strong>in</strong>ed, the e-scooter market share reachesits highest level of 42% under cutt<strong>in</strong>g-edgetechnology, high gasol<strong>in</strong>e price, <strong>and</strong> e-scootertax <strong>in</strong>centive.Ahmedabad, <strong>India</strong>Not all experimental attributes <strong>in</strong> the Ahmedabadsurvey were significant or had the expected sign.There are a number of possible explanations forthis, <strong>in</strong>clud<strong>in</strong>g lack of importance of the attribute<strong>in</strong> the choice decision. However, it could alsobe that respondents did not read the choicequestions carefully or had a preconceived biasaga<strong>in</strong>st electric two-wheelers. This is evidenced <strong>in</strong>the high alternative specific constants for gasol<strong>in</strong>escooters <strong>and</strong> motorbikes. It could be the casethat <strong>in</strong>dividuals chose those modes consider<strong>in</strong>gattributes that were not <strong>in</strong>cluded <strong>in</strong> the choiceexperiment. Alternatively, <strong>in</strong>dividuals may havechosen based on the attributes <strong>in</strong> the choiceexperiment, but may have had preconceivednotions of those attributes as opposed to thelevels provided; or <strong>in</strong>dividuals may simply valuegas scooters solely for the fact that they arepowered by gas <strong>and</strong> not electricity.Table 8 shows the parameter estimates forthe conditional logit model estimated <strong>in</strong>Ahmedabad. The alternative specific constants
Table 8: Parameter Estimates of the Conditional Logit Model (Ahmedabad)Variable Coefficient St<strong>and</strong>ard Error p-valuePurchase price (Rs) (0.0000291) 1.57E-06 0Refuel or recharge range (km) 0.0001977 0.0001042 0.058Refuel or recharge time (m<strong>in</strong>) (0.0019452) 0.0002849 0Fuel or electricity cost (Rs/km) (0.7535194) 0.0797702 0Ma<strong>in</strong>tenance cost (Rs/15000 km) 0.000057 0.0000623 0.36Top speed (km/h) 0.0022291 0.0011376 0.05Acceleration (0–30 km <strong>in</strong> X sec) (0.0127484) 0.0113414 0.261VAT + registration tax (Rs) 4.40E-06 5.85E-06 0.452Caplow (1 passenger) (0.5077588) 0.0678198 0Caphigh (3 passengers) 0.314273 0.050005 0Transmission (0.0016645) 0.0277165 0.952License (0.0577002) 0.046505 0.215Price x female (0.0000323) 0.0000119 0.007Speed x female 0.0206921 0.0069034 0.003Caplow x female 1.190801 0.3827393 0.002Caphigh x female (1.252734) 0.3179304 0Ma<strong>in</strong>tenance x female (0.0009319) 0.0004108 0.023Motorcycle alternative specific constant 2.078798 0.1689444 0Motor scooter alternative specific constant 2.073141 0.1416126 0N Obs 16,962Log-likelihood (0) (5060.6495)Log-likelihood (4947.4576)Wald Chi-Square 556.8023 23❚❚❚ Market Analysis( ) = negative, km = kilometer, km/h = kilometer per hour, m<strong>in</strong> = m<strong>in</strong>ute, N Obs = number of observations, Rs = rupee, Rs/km= rupees per kilometer, Rs/15,000 km = rupees per 15,000 kilometers, sec = second.Note: p-value95% confidence that the parameter estimate is not equal to zero.Source: Authors.<strong>in</strong>dicate a strong disposition toward gasol<strong>in</strong>epoweredtwo-wheelers. A notable <strong>in</strong>significantvariable is VAT + Registration tax. The implicationhere is that <strong>India</strong>n vehicle purchasers are lesssensitive to taxes than purchasers <strong>in</strong> Viet Nam.This could also <strong>in</strong>dicate that the respondents didnot conceptualize the effect of the tax on theirpurchase choice, an <strong>in</strong>herent challenge withstated-preference choice experiments.There was difficulty <strong>in</strong>clud<strong>in</strong>g gender-attribute<strong>in</strong>teractions because females were undersam-pled. Unfortunately, the predom<strong>in</strong>ately malesurvey team had difficulty collect<strong>in</strong>g data fromfemales, which creates estimation problems<strong>in</strong> the model. Still, price, speed, capacity, <strong>and</strong>ma<strong>in</strong>tenance costs <strong>in</strong>teracted with gender<strong>in</strong>fluencedchoice. The <strong>in</strong>terpretation of thenegative sign on ma<strong>in</strong>tenance cost <strong>and</strong> purchaseprice variables, <strong>in</strong>teracted with females, <strong>in</strong>dicatesthat females are more price-sensitive than males.Females are also less concerned with capacityas an important variable <strong>in</strong> their decision.Surpris<strong>in</strong>gly, speed, <strong>in</strong>teracted with female
24❚❚❚ Electric <strong>Two</strong>-<strong>Wheelers</strong> <strong>in</strong> <strong>India</strong> <strong>and</strong> Viet Namgender, is positive, <strong>in</strong>dicat<strong>in</strong>g that females preferfaster vehicles than males, contrary to f<strong>in</strong>d<strong>in</strong>gs<strong>in</strong> the Ha Noi model or <strong>in</strong> Chiu <strong>and</strong> Tzeng. 19Will<strong>in</strong>gness to Pay EstimatesThe MWTP of various attributes is important tounderst<strong>and</strong> the substitution patterns of potentiale-scooter purchasers. Aga<strong>in</strong>, the MWTP isexpressed as the amount of money one wouldpay for a marg<strong>in</strong>al <strong>in</strong>crease or decrease <strong>in</strong> anotherparameter <strong>and</strong> is calculated as the quotient ofthe vehicle purchase price parameter estimate<strong>and</strong> the parameter of the variable <strong>in</strong> question.Notably, the alternative specific constantswere dom<strong>in</strong>ant <strong>in</strong> the MWTP estimates, aboutRs71,000, just for hav<strong>in</strong>g a gasol<strong>in</strong>e two-wheeler<strong>in</strong>stead of an electric. This exceeds the purchaseprice <strong>in</strong> many cases, yield<strong>in</strong>g a strong prevalenceaway from electric two-wheelers. Speed isimportant, <strong>and</strong> respondents were will<strong>in</strong>g to payRs76 per km/h top speed <strong>in</strong>crease. Similarlyrespondents would pay Rs438 per secondreduced to reach 30 km/h (for <strong>in</strong>stance,respondents would pay Rs438 more for a twowheelerthat accelerated from 0 to 30 km/h <strong>in</strong>5 seconds, compared to the same two-wheelerthat accelerated from 0 to 30 km/h <strong>in</strong> 6 seconds).Interest<strong>in</strong>gly, capacity proved important as<strong>in</strong>dividuals were will<strong>in</strong>g to pay Rs10,000 fora scooter with an additional person-carry<strong>in</strong>gcapacity. Regard<strong>in</strong>g cross-price sensitivity,<strong>in</strong>dividuals were will<strong>in</strong>g to pay Rs26,000 to saveRs1/km on fuel costs. Over the reasonable lifeof a vehicle (80,000 km), this fuel sav<strong>in</strong>gs fromadditional <strong>in</strong>vestment <strong>in</strong> a fuel economy wouldpay for itself threefold. To put it another way,a vehicle purchaser will only pay an up-frontcost of about 1/3 of the expected fuel costsav<strong>in</strong>gs over the life of the vehicle. Consider<strong>in</strong>gma<strong>in</strong>tenance costs, respondents were will<strong>in</strong>gto pay about Rs2 to save Rs1/15,000 km <strong>in</strong>ma<strong>in</strong>tenance costs. Aga<strong>in</strong>, assum<strong>in</strong>g a vehiclelifespan of 80,000 km, the up-front will<strong>in</strong>gnessto pay for an expected ga<strong>in</strong> is about 1/3 of theexpected sav<strong>in</strong>gs.Market Share PredictionsThe results of the conditional logit modelspecification are used to estimate marketshares for Ahmedabad, creat<strong>in</strong>g several classesof vehicles <strong>and</strong> estimat<strong>in</strong>g the future marketpotential of each class of vehicle. Similar tothe Ha Noi model, the analysis exam<strong>in</strong>es threedifferent states of e-scooter technology: current,upgraded, <strong>and</strong> cutt<strong>in</strong>g-edge. Each state iscomb<strong>in</strong>ed with low <strong>and</strong> high gasol<strong>in</strong>e pricescenarios. S<strong>in</strong>ce taxes did not enter significantly<strong>in</strong> the model, they were not <strong>in</strong>cluded as adeterm<strong>in</strong>ant of market share. Market shares arecalculated for each comb<strong>in</strong>ation of technology<strong>and</strong> gasol<strong>in</strong>e price.Table 9 presents the attribute values thatwere selected for the three different states oftechnology <strong>in</strong> the low gasol<strong>in</strong>e price scenario.Aga<strong>in</strong>, the upgraded state of technologyimplements mid-level enhancements <strong>in</strong> e-scootertechnology, relative to the current technology,without associated <strong>in</strong>creases <strong>in</strong> price or operat<strong>in</strong>gcosts.19Chiu <strong>and</strong> Tzeng 1999.
The two states where market share is analyzedare low <strong>and</strong> high gasol<strong>in</strong>e price scenarios. Thelow gasol<strong>in</strong>e price scenario reflects the currentmarket conditions, while the high gasol<strong>in</strong>e pricescenario reflects a 33% price <strong>in</strong>crease. This price<strong>in</strong>crease is consistent with <strong>in</strong>creases <strong>in</strong> fuel pricesseen around the world <strong>and</strong> could be a result oftaxation policy or market forces.Consider<strong>in</strong>g the high <strong>and</strong> low fuel prices,coupled with different performance <strong>and</strong> priceattributes of current <strong>and</strong> future generatione-scooters, market shares are estimated asshown <strong>in</strong> Table 10. In Ahmedabad, e-scootermarket potential is much lower than <strong>in</strong> Ha Noi.In the low gasol<strong>in</strong>e price scenario, the currenttechnology e-scooter is estimated to penetrateonly 6% of the market. With an upgradedtechnology (performance), this value <strong>in</strong>creases to19%. Interest<strong>in</strong>gly, the market share drops <strong>in</strong> thecutt<strong>in</strong>g-edge technology case, to about 11%.The explanation of this drop is that the operat<strong>in</strong>gcosts <strong>in</strong>crease given higher energy requirements<strong>and</strong> more expensive ma<strong>in</strong>tenance costs, whichoutweigh the performance improvements. Theimplication here is that consumers might not bewill<strong>in</strong>g to pay for higher perform<strong>in</strong>g batteries <strong>and</strong>power, <strong>in</strong> exchange for improved performance.Increas<strong>in</strong>g gasol<strong>in</strong>e prices by 33% results <strong>in</strong> a2–3 percentage po<strong>in</strong>t <strong>in</strong>crease <strong>in</strong> market sharefor all three e-scooter classes.25 25❚❚❚ Market Analysis
26❚❚❚ Electric <strong>Two</strong>-<strong>Wheelers</strong> <strong>in</strong> <strong>India</strong> <strong>and</strong> Viet NamTable 9: Market Estimation Attribute Values(Ahmedabad)AttributeCutt<strong>in</strong>g-EdgeTechnologyUpgradedTechnologyCurrentTechnologyPrice (Rs)Motor scooter 39,500 39,500 39,500Motorcycle 58,700 58,700 58,700E-scooter 37,000 27,750 27,750Range (km)Motor scooter 100 100 100Motorcycle 200 200 200E-scooter 200 120 60Recharge time (m<strong>in</strong>)Motor scooter 5 5 5Motorcycle 10 10 10E- scooter 10 30 360Fuel/electricity cost (Rs/km)Motor scooter 1.08 1.08 1.08Motorcycle 1.08 1.08 1.08E-scooter 0.09 0.06 0.06Ma<strong>in</strong>tenance cost (Rs/15,000 km)Motor scooter 7,500 7,500 7,500Motorcycle 7,500 7,500 7,500E-scooter 10,850 7,750 7,750Acceleration (0–30 km <strong>in</strong> XX sec)Motor scooter 5 5 5Motorcycle 4 4 4E-scooter 4 5 6Speed (km/h)Motor scooter 80 80 80Motorcycle 80 80 80E-scooter 60 50 40Capacity high (# adults)Motor scooter 2 2 2Motorcycle 2 2 2E-scooter 2 2 1TransmissionMotor scooter Automatic Automatic AutomaticMotorcycle Manual Manual ManualE-scooter Automatic Automatic Automaticcont<strong>in</strong>ued on next page...
Table 9 cont<strong>in</strong>uedAttributeCutt<strong>in</strong>g-EdgeTechnologyUpgradedTechnologyCurrentTechnologyLicenseMotor scooter Yes Yes YesMotorcycle Yes Yes YesE-scooter No No NoVAT + registration taxMotor scooter 3,600 3,600 3,600Motorcycle 4,750 4,750 4,750E-scooter 1,600 1,600 1,60027 27❚❚❚ Market Analysiskm = kilometer, km/h = kilometer per hour, Ma<strong>in</strong>t = ma<strong>in</strong>tenance, m<strong>in</strong> = m<strong>in</strong>ute, Rs = rupee, Rs/15,000 km = rupees per15,000 kilometer, Rs/km = rupees per kilometer, sec = second.Source: Authors.Table 10: Market Share <strong>in</strong> Ahmedabad—Vary Fuel Price <strong>and</strong> TechnologyCurrentTechnologyLow Gasol<strong>in</strong>e PriceUpgradedTechnologyCutt<strong>in</strong>g-EdgeTechnologyCurrentTechnologyHigh Gasol<strong>in</strong>e PriceUpgradedTechnologyCutt<strong>in</strong>g-EdgeTechnologyMotorcycle 0.32 (0.02) 0.28 (0.02) 0.30 (0.02) 0.31 (0.02) 0.26 (0.02) 0.29 (0.02)Motor scooter 0.62 (0.02) 0.53 (0.02) 0.59 (0.03) 0.60 (0.02) 0.50 (0.02) 0.57 (0.03)E-scooter 0.06 (0.01) 0.19 (0.02) 0.11 (0.03) 0.08 (0.02) 0.23 (0.03) 0.14 (0.04)e-scooter = electric scooter.Note: Values not enclosed <strong>in</strong> parentheses are the coefficients, while values with<strong>in</strong> parentheses are the st<strong>and</strong>ard errors. As aresult of round<strong>in</strong>g, the market shares for some alternatives may not sum to 1.Source: Authors.
Environmental ImpactsAlthough e-scooters can be referred toas zero-emission vehicles, they do <strong>in</strong>fact emit pollution from power plants.Additionally, they emit lead from battery manufactur<strong>in</strong>g<strong>and</strong> recycl<strong>in</strong>g. A study <strong>in</strong> the PRCshowed that electric two-wheelers emit upto 30% of the mass of a battery over its lifecycle. Electric vehicles also tend to emit moresulfur dioxide (SO 2) pollution than conventionalgasol<strong>in</strong>e vehicles because of reliance on coalpower plants. 20 Because electric two-wheelersare compet<strong>in</strong>g aga<strong>in</strong>st gasol<strong>in</strong>e scooters<strong>and</strong> motorcycles <strong>in</strong> <strong>India</strong> <strong>and</strong> Viet Nam,e-scooter-style vehicles will likely be requiredto atta<strong>in</strong> market share. E-scooters have higherenergy requirements than smaller e-bikes soe-scooters could have higher emissions dur<strong>in</strong>g theuse phase. In this section, use-phase emissions ofe-scooters were estimated <strong>and</strong> compared aga<strong>in</strong>stgasol<strong>in</strong>e two-wheelers. Lead pollution was alsoestimated based on regional efficiencies of thelead battery production <strong>and</strong> recycl<strong>in</strong>g <strong>in</strong>dustries <strong>in</strong><strong>India</strong> <strong>and</strong> Viet Nam.Ultimately, e-bike emission rates depend onemissions from the power sector. Both Viet Nam<strong>and</strong> <strong>India</strong> have a high reliance on thermal powersources <strong>and</strong>, as dem<strong>and</strong> grows, thermal powercont<strong>in</strong>ues to constitute a high proportion of newcapacity. In 2006, 16% of <strong>India</strong>’s power was suppliedby hydropower, 2% by nuclear <strong>and</strong> about81% by thermal power, 86% of which is coalbased.21 Viet Nam relies much more heavily onhydropower sources, although thermal powersources are a large share. In 2004, 52% ofpower was generated by thermal power while48% was produced by hydropower. Only 12%of power was generated by coal, while the rema<strong>in</strong>derwas generated by natural gas <strong>and</strong> otherthermal sources. 22Several studies have quantified motorcycle emissionrates worldwide. A recent, comprehensivestudy identified emission rates of two-stroke<strong>and</strong> four-stroke motorcycles. In both <strong>India</strong> <strong>and</strong>Viet Nam, four-stroke motorcycles are quicklyreplac<strong>in</strong>g two-stroke motorcycles, with fourstrokesconstitut<strong>in</strong>g 70% of new motorbike sales<strong>in</strong> <strong>India</strong> <strong>in</strong> 2004. 23E-bikes vary by country <strong>and</strong> region. E-scooteremissions <strong>in</strong> the PRC, with 85% reliance onfossil fuel electricity generation, are also shown<strong>in</strong> Table 11 for comparison. Notably, emissionrates from gasol<strong>in</strong>e motorcycles are at least anorder of magnitude higher for most pollutants,compared to e-scooters.20Cherry et al. 2009.21US Energy Information Adm<strong>in</strong>istration. 2009. Country Analysis Briefs–<strong>India</strong>. www.eia.doe.gov/emeu/cabs/<strong>India</strong>/Electricity.html22US Energy Information Adm<strong>in</strong>istration. 2009. Country Analysis Briefs–<strong>Vietnam</strong>. www.eia.doe.gov/emeu/cabs/<strong>Vietnam</strong>/Electricity.html23Meszler, D. 2007. <strong>Air</strong> Emissions Issues Related to <strong>Two</strong> <strong>and</strong> Three-Wheeled Motor Vehicles. San Francisco:International Council of <strong>Clean</strong> Transport.
Table 11: Motorcycle Emission Rates(g/km)vehicles. 25 scooter, with mid-range motor power29ExhVOCEvapVOCTotalVOC CO NO X PM CO 2MaxCO 2 N 2 O CH 4 SO 2<strong>Two</strong>-stroke 15.5 1.25 16.75 18 0.05 0.5 40 118 0.002 0.15 …Four-stroke 1 1.25 2.25 12.5 0.15 0.1 55 77 0.002 0.2 …E-scooter, … … 0.007 0.02 0.06 0.017 21.5 … … … 0.13PRC... = not available, CH 4 = methane, CO = carbon monoxide, CO 2 = carbon dioxide, e-scooter = electric scooter, Evap = evaporativeemissions, Exh = exhaust emissions, g/km = gram per kilometer, max CO 2 = maximum CO 2emissions carbon dioxide,N 2 O = nitrous oxide, NO x = nitrogen oxide, PM = particulate matter, PRC = People’s Republic of Ch<strong>in</strong>a, SO 2 = sulfur dioxide,VOC = volatile organic compound.Source: Meszler, D. 2007. <strong>Air</strong> Emissions Issues Related to <strong>Two</strong> <strong>and</strong> Three-Wheeled Motor Vehicles. SanFrancisco: International Council of <strong>Clean</strong> Transport; Cherry, C., et al. 2009. Electric Bikes <strong>in</strong> the People’sRepublic of Ch<strong>in</strong>a (PRC)—Impact on the Environment <strong>and</strong> Prospects for Future Growth. Asian DevelopmentBank: Manila.Impact Estimation Methodology(750 W) <strong>and</strong> a maximum speed of 45km/h. This class of scooter is not widelyE-scooters <strong>in</strong> <strong>India</strong> <strong>and</strong> Viet Nam, to compete manufactured <strong>in</strong> the PRC because ofdirectly aga<strong>in</strong>st gasol<strong>in</strong>e motorcycles <strong>and</strong> regulatory pressure to develop slowerscooters <strong>and</strong> become more widely used, willdem<strong>and</strong> higher energy <strong>and</strong> thus more electricitygeneration with concomitant pollution perkilometer, compared to a smaller e-bike onthe same grid. In this analysis, three classesof e-scooters are analyzed for environmentalemissions:<strong>and</strong> lighter vehicles. The electricityrequirements at the plug are 2.3 kWh/100km.(iii) The third class is a more advancede-scooter, with motor power greaterthan 1,000 W <strong>and</strong> maximum speedsof over 55 km/h. There are few of this(i) The first class is the same estimated <strong>in</strong>Cherry <strong>and</strong> We<strong>in</strong>ert et al., a lower power(350–500 W) scooter with a maximumspeed of 30 km/h. These scooters aretechnologically mature <strong>and</strong> very common<strong>in</strong> the PRC. The electricity requirementsat the plug are 1.8 kilowatt-hours per100 km (kWh/100 km). 24class developed <strong>in</strong> Asia. The electricityrequirements at the plug of this class areestimated to be 3.1 kWh/100 km.Transmission losses require more electricity tobe generated at the plant than is delivered tothe outlet—10% more <strong>in</strong> Viet Nam, 14% more<strong>in</strong> the PRC, <strong>and</strong> 34% more <strong>in</strong> <strong>India</strong>. The higherthe transmission loss, the more electricity must(ii) The second class is an <strong>in</strong>termediate be generated per kilometer to power electric❚❚❚ Environmental Impacts24Cherry et al. 2009.25Lawrence Berkeley National Laboratory. 2004. Ch<strong>in</strong>a Energy Databook 6.0. http://ch<strong>in</strong>a.lbl.gov/research/ch<strong>in</strong>a-energy-databook; Web<strong>India</strong>123.com. 2009. Steps Will Be Taken to Br<strong>in</strong>g Down Transmission Loss:Balan. 14 June. http://news.web<strong>in</strong>dia123.com/news/Articles/<strong>India</strong>/20090614/1275122.html; <strong>Vietnam</strong>News. 2009. EVN Wants Cap on Power Losses. 10 July. http://vietnamnews.vnagency.com.vn/showarticle.php?num=03ECO190509
30❚❚❚ Electric <strong>Two</strong>-<strong>Wheelers</strong> <strong>in</strong> <strong>India</strong> <strong>and</strong> Viet NamOnce plug-to-wheel <strong>and</strong> plant-to-plug energyuse is estimated, one can estimate the totalelectric energy use requirements per kilometer.First, one has to estimate the emission <strong>in</strong>tensityof electricity generation, expressed as grams ofpollutant per kilowatt-hour. Emission rates fromthe power sector, per kilowatt-hour of generatedelectricity, are estimated us<strong>in</strong>g two databases.For CO 2 emissions, the Carbon Monitor<strong>in</strong>g forAction (CARMA) database is used to estimatethe <strong>in</strong>tensity of CO 2 emissions per kilowatthourof electricity generation, averaged over thecountry. Conventional pollutant emission ratesare estimated by summ<strong>in</strong>g aggregate emission<strong>in</strong>ventories <strong>in</strong> the power sector, estimated by theNational Aeronautics <strong>and</strong> Space Adm<strong>in</strong>istrationIntercont<strong>in</strong>ental Transport Experiment PhaseB (NASA INTEX-B), <strong>and</strong> divid<strong>in</strong>g by the totalelectricity generation <strong>in</strong> each country provided bythe CARMA database. 26 Each of these analyseswas conducted us<strong>in</strong>g a geographic <strong>in</strong>formationsystem (GIS) to spatially estimate emissions. Inall cases, aggregate emissions from the powersector were averaged, rather than plant-specificemission rates. The pollutants estimated <strong>in</strong>cludeCO 2 , black carbon (BC), CO, NO X , organiccompounds (OC), particulate matter 10 (PM 10 ),particulate matter 2.5 (PM 2.5 ), SO 2, <strong>and</strong> volatileorganic compounds (VOC).Regionally, emission rates could vary depend<strong>in</strong>gon the electricity generation fuel mix <strong>in</strong> eachspecific grid. In the PRC, regional variationscan account for some regions hav<strong>in</strong>g up to sixtimes higher emissions per kilowatt-hour than“cleaner” grids for some pollutants. Viet Namhas one cont<strong>in</strong>uous power grid, so it wasassumed that each unit of electricity generationhas the same emission <strong>in</strong>tensity. <strong>India</strong> has fivedist<strong>in</strong>ct power grid networks, but grid-specificemission rates were not estimated because ofthe lack of region-specific power generationlocations. Given this, national emission rates for<strong>India</strong> were estimated. The calculation method isshown <strong>in</strong> Appendix 2.Emission Rates of ElectricScooters <strong>in</strong> <strong>India</strong> <strong>and</strong> Viet NamUs<strong>in</strong>g the above methodology, the emissionrates for the three vehicle classes are estimated<strong>and</strong> presented <strong>in</strong> Table 12. Because of thestructure of Viet Nam’s energy <strong>and</strong> leadprocess<strong>in</strong>g <strong>in</strong>dustry <strong>and</strong> resources, e-scooteremission rates are significantly lower than<strong>India</strong>’s for most pollutants. Still, compared withgasol<strong>in</strong>e two-wheelers, e-scooters have muchlower emission rates on almost all pollutants <strong>in</strong>both countries.Importantly, on a per-kilometer basis, e-scooterscan reduce CO 2 emissions by one-third to onehalfof a motorcycle’s emissions. CO is practicallyundetectable compared to a motorcycle’s emissions.The only pollutant that has a potentially higheremission rate dur<strong>in</strong>g the use phase is SO 2 , whereasSO 2 emission rates of vehicles us<strong>in</strong>g unleadedgasol<strong>in</strong>e are often undetectable. There are someimportant differences to note between us<strong>in</strong>g ane-scooter <strong>in</strong> <strong>India</strong> <strong>and</strong> Viet Nam. Particularly,the CO emission rate <strong>in</strong> Viet Nam is orders ofmagnitude higher than CO emissions <strong>in</strong> <strong>India</strong>. Onthe other h<strong>and</strong>, the OC emission rate is severalorders of magnitude higher <strong>in</strong> <strong>India</strong> than the OCemission rate <strong>in</strong> Viet Nam. This is likely because ofa different fuel mix for electricity generation.26Argonne National Lab. 2006. 2006 Asia Emissions for INTEX-B. 7 June. http://www.cgrer.uiowa.edu/EMISSION_DATA_new/<strong>in</strong>dex_16.html; CARMA. 2009. Carbon Monitor<strong>in</strong>g for Action. July 1. http://carma.org
CO 2(g/km)BC (mg/100 km)CO (mg/100 km)NO X(g/100 km)OC(g/100 km)PM 10(g/100 km)PM 2.5(g/100 km)SO 2(g/100 km)VOC(g/100 km)Table 12: Emission Rate of Electric Scooters <strong>in</strong> <strong>India</strong> <strong>and</strong> Viet NamClass ILowPowerE-scooter<strong>India</strong>Class IIMidPowerE-scooterClass IIIHighPowerE-scooterClass ILowPowerE-scooterViet NamClass IIMidPowerE-scooterClass IIIHighPowerE-scooter<strong>India</strong> <strong>and</strong>Viet Nam4-Stroke<strong>Two</strong>wheeler21.9 28.0 37.8 16.1 20.5 27.7 5527.3 34.8 47.0 0.8 1.0 1.4 –0.03 0.04 0.05 31.5 40.2 54.2 1,250,0004.8 6.2 8.3 1.3 1.7 2.3 1592.8 118.6 159.8 0.4 0.5 0.6 –4.5 5.8 7.8 0.3 0.4 0.6 102.8 3.6 4.9 0.2 0.3 0.4 –8.1 10.3 13.9 1.9 2.4 3.3 –0.4 0.5 0.6 0.0 0.1 0.1 22531❚❚❚ Environmental Impacts– = no data available, BC = black carbon, CO = carbon monoxide, CO 2 = carbon dioxide, e-scooter = electric scooter,g/100 km = gram per 100 kilometers, g/km = gram per kilometer, mg/100 km = milligram per 100 kilometers,NO x = nitrogen oxide, OC = organic compound, PM 10 = particulate matter 10, PM 2.5 = particulate matter 2.5, SO 2 = sulfur dioxide,VOC = volatile organic compound.Source: Authors; Meszler, D. 2007. <strong>Air</strong> Emissions Issues Related to <strong>Two</strong> <strong>and</strong> Three-Wheeled Motor Vehicles. San Francisco:International Council of <strong>Clean</strong> Transport.Environmental Impacts ofElectric Scooter AdoptionWhile e-scooters have lower emission ratesthan gasol<strong>in</strong>e scooters, their impact can onlybe realized with high adoption rates. Coupl<strong>in</strong>ge-scooter scenarios developed <strong>in</strong> the marketanalysis section with environmental emissionrates can show reductions <strong>in</strong> transportationrelatedemissions, <strong>in</strong> terms of both local pollutants<strong>and</strong> greenhouse gases. The market scenariosdeveloped <strong>in</strong> Tables 7 <strong>and</strong> 9 are extended below<strong>in</strong> Tables 13 <strong>and</strong> 14, coupled with the weightedemission rate of two-wheelers <strong>in</strong> the country byscenario. These tables present several scenariosof e-scooter adoption, based on improvedperformance <strong>and</strong> economic <strong>in</strong>centive. Based onthese scenarios, the impact of e-scooters canbe estimated through an average two-wheeleremission rate that takes <strong>in</strong>to account theproportions of the fleet compris<strong>in</strong>g gasol<strong>in</strong>e <strong>and</strong>electric two-wheelers. This weighted emissionrate <strong>in</strong>cludes the appropriate e-scooter class <strong>and</strong>weights the emissions by the proportion of thetwo-wheeler market that the e-scooter captures.This assumes that as e-scooters replace gasol<strong>in</strong>etwo-wheelers, e-scooter users use gasol<strong>in</strong>etwo-wheelers <strong>in</strong> the same way. For <strong>in</strong>stance,
32❚❚❚ Electric <strong>Two</strong>-<strong>Wheelers</strong> <strong>in</strong> <strong>India</strong> <strong>and</strong> Viet NamTable 13: <strong>Two</strong>-Wheeler Average Emission Rate Impacts of Electric Scooter Market Penetration—Ha NoiNo Tax Incentive Tax IncentiveScenario 1 Scenario 2 Scenario 3 Scenario 4% Change(comparedto 100% gastwo-wheeler)High GasPrice Class IIIE-Scooter42%E-scooters% Change(comparedto 100% gastwo-wheeler)Low GasPrice Class IIIE-Scooter38%E-scooters% Change(comparedto 100% gastwo-wheeler)High GasPrice Class IIIE-Scooter36%E-scooters% Change(comparedto 100% gastwo-wheeler)Low GasPrice Class IIIE-Scooter33%E-scootersCurrentState b0%Pollutant a E-scooters55 46.0 (16) 45.2 (18) 44.6 (19) 43.5 (21)CO 2(g/km)1,250 838 (33) 800 (36) 775 (38) 725 (42)CO(g/100km)15 10.8 (28) 10.4 (30) 10.2 (32) 9.7 (36)NO X(g/100km)10 6.9 (31) 6.6 (34) 6.4 (36) 6.0 (40)PM 10(g/100km)1.4 Newemissions1.2 Newemissions1.2 NewemissionsSO 20 1.1 New(g/100km) c emissions225 151 (33) 144 (36) 140 (38) 131 (42)VOC(g/100km)( ) = negative, CO = carbon monoxide, CO 2 = carbon dioxide, e-scooter = electric scooter, g/100 km = gram per 100 kilometers, g/km = gram per kilometer, NO X = nitrogen oxide,PM 10 = particulate matter 10, SO 2 = sulfur dioxide, VOC = volatile organic compound.aSome pollutants were omitted from this table because they were not consistently reported across data sets.bFrom Meszler 2007.cSO 2 is unreported <strong>in</strong> Meszler 2007. It is assumed that the emission rate is zero for gasol<strong>in</strong>e two-wheelers s<strong>in</strong>ce this is an important new emission from electric vehicles.Source: Authors; Meszler, D. 2007. <strong>Air</strong> Emissions Issues Related to <strong>Two</strong> <strong>and</strong> Three-Wheeled Motor Vehicles. San Francisco: International Council of <strong>Clean</strong> Transport.
Table 14: <strong>Two</strong>-Wheeler Average Emission Rate Impacts of Electric Scooter Market Penetration—AhmedabadLow Gasol<strong>in</strong>e Price High Gasol<strong>in</strong>e PriceScenario 1 Scenario 2 Scenario 3 Scenario 4% Change(comparedto 100%gas twowheeler)Class IIIE-Scooter14%E-scooters% Change(comparedto 100%gas twowheeler)Class IIE-Scooter11%E-scooters% Change(comparedto 100%gas twowheeler)Class IIIE-Scooter23%E-scooters% Change(comparedto 100%gas twowheeler)Class IIE Scooter19%E-scootersCurrentState b0%Pollutant a E-scooters55 50.0 (9) 48.7 (11) 52.0 (5) 51.2 (7)CO 2(g/km)1,250 1,016 (19) 960 (23) 1,113 (11) 1,075 (14)CO(g/100 km)15 13.4 (11) 13.0 (14) 14.0 (6) 13.8 (8)NO X(g/100 km)10 9.2 (8) 9.0 (10) 9.5 (5) 9.4 (6)PM 10(g/100 km)1.4 Newemissions1.1 Newemissions2.4 NewemissionsSO 20.0 1.9 New(g/100 km) c emissions225 183 (19) 173 (23) 200 (11) 194 (14)VOC(g/100 km)( ) = negative, CO = carbon monoxide, CO 2 = carbon dioxide, e-scooter = electric scooter, g/100 km = gram per 100 kilometers, g/km = gram per kilometer, NO X = nitrogen oxide,PM 10 = particulate matter 10, SO 2 = sulfur dioxide, VOC = volatile organic compound.aSome pollutants were omitted from this table because they were not consistently reported across data sets.bFrom Meszler 2007.cSO 2 is unreported <strong>in</strong> Meszler 2007. It is assumed that the emission rate is zero for gasol<strong>in</strong>e two-wheelers s<strong>in</strong>ce this is an important new emission from electric vehicles.Source: Authors; Meszler, D. 2007. <strong>Air</strong> Emissions Issues Related to <strong>Two</strong> <strong>and</strong> Three-Wheeled Motor Vehicles. San Francisco: International Council of <strong>Clean</strong> Transport.33❚❚❚ Environmental Impacts
34❚❚❚ Electric <strong>Two</strong>-<strong>Wheelers</strong> <strong>in</strong> <strong>India</strong> <strong>and</strong> Viet Nama 33% shift toward e-scooters will result <strong>in</strong> a33% replacement of vehicle kilometers traveled.There are two potentially counterbalanc<strong>in</strong>gforces that could produce biased results from thisassumption: (i) s<strong>in</strong>ce the marg<strong>in</strong>al cost of travelis lower, there could be more <strong>in</strong>duced travel bye-scooter owners; <strong>and</strong> (ii) e-scooters generallyhave a lower range than their gasol<strong>in</strong>ecounterparts, so e-scooter owners might makeshorter trips on average.It should be noted that emission rate reductionsare compared to the average emission rate ofthe gasol<strong>in</strong>e two-wheeler, <strong>and</strong> do not suggestthat ambient air quality will improve by thispercentage <strong>in</strong> urban areas. It is uncerta<strong>in</strong> whateffect e-scooters will have on ambient air quality<strong>in</strong> populated areas for two reasons.Gasol<strong>in</strong>e two-wheelers are responsible formuch, but not all air pollution <strong>in</strong> urban areas. For<strong>in</strong>stance, gasol<strong>in</strong>e two-wheelers are responsiblefor about 80% of transport-related CO pollution<strong>in</strong> Ha Noi. By displac<strong>in</strong>g 33% of gasol<strong>in</strong>e twowheelerswith e-scooters, total transport-relatedCO emissions could be reduced by 26%. Onthe other h<strong>and</strong>, gasol<strong>in</strong>e two-wheelers areonly responsible for 20% of transport-relatedPM emissions (dom<strong>in</strong>ated by heavy-duty dieselvehicles), so by displac<strong>in</strong>g 33% of gasol<strong>in</strong>etwo-wheelers with e-scooters, transport-relatedPM emissions will be reduced by 6% (20%times 31%). 27Gasol<strong>in</strong>e two-wheelers emit pollution directly<strong>in</strong>to the urban environment, impact<strong>in</strong>g localambient air quality directly. E-scooters emitpollution from sometimes remote power plants,impact<strong>in</strong>g ambient air quality <strong>in</strong> different regions.This could result <strong>in</strong> significantly improved publichealth through reduced exposure efficiency ofair pollution. 28Although e-scooters do emit slightly more SO 2 ,there are very clear advantages of promot<strong>in</strong>ge-scooters <strong>in</strong> Viet Nam <strong>and</strong> <strong>India</strong>. In fact,subsidiz<strong>in</strong>g e-scooter adoption could be a morecost-effective method of reduc<strong>in</strong>g CO 2 emissionsthan many compet<strong>in</strong>g alternatives. Moreover,e-scooter adoption will likely result <strong>in</strong> muchgreater local air pollution improvement.E-scooters have the potential both to improvelocal air quality <strong>and</strong> reduce greenhouse gasemissions derived from the transport sector. Infact, they can be very cost effective at both.For <strong>in</strong>stance, <strong>in</strong> Ha Noi, 12 billion passengerkilometerswere traveled by motorbike <strong>in</strong> 2005,or about 8,000 km per year per motorbike. 29 Thisanalysis shows that 33% of the future marketcould choose e-scooters with little government<strong>in</strong>tervention, assum<strong>in</strong>g that the best technologyis developed <strong>and</strong> marketed by <strong>in</strong>dustry. Assum<strong>in</strong>gthat 33% of the 12 billion passenger-kilometersare taken by e-scooters <strong>in</strong> the future, the totalemissions would be 552,000 metric tons ofCO 2 yearly. E-scooter market adoption could<strong>in</strong>crease to 38% if e-scooters were exemptfrom registration tax (10%) <strong>and</strong> gasol<strong>in</strong>e twowheelerswere still subject to that tax, result<strong>in</strong>g<strong>in</strong> a 5-percentage-po<strong>in</strong>t <strong>in</strong>crease <strong>in</strong> adoption.This market penetration would result <strong>in</strong> total27Schipper et al. 2008.28Heath et al. 2006.29Schipper et al. 2008.
two-wheeler CO 2 emissions of 535,200 tons,or a 16,800 ton reduction per year. If an e-scooter’s lifespan is 6 years, on average, each e-scooter that replaces a gasol<strong>in</strong>e scooter wouldreduce CO 2 emissions by 1.3 tons. 30 This wouldcost about D1 million per e-scooter, or about$48/ ton. While this is more expensive than somealternatives, the co-benefits of improved airquality could justify public subsidy of this mode.The potential improvements are more modest<strong>in</strong> Ahmedabad for two reasons. The first is thate-scooters have a negative perception, even withprice <strong>and</strong> performance advantages. This results <strong>in</strong>a low market adoption, imped<strong>in</strong>g policy attemptsto <strong>in</strong>fluence market dem<strong>and</strong>. The second reasonis that <strong>India</strong>’s electricity generation emissionrates are relatively high, reduc<strong>in</strong>g the netbenefit of a shift from gasol<strong>in</strong>e two-wheelers toe-scooters. With effective market<strong>in</strong>g campaigns,public perception could shift toward e-scooters;however, current consumers seem unresponsiveto direct price <strong>in</strong>centives, like VAT reduction.Lead PollutionLead pollution is a significant concern when consider<strong>in</strong>ge-scooter adoption. Lead acid batteriesare still the dom<strong>in</strong>ant battery technology adoptedby e-scooter manufacturers <strong>in</strong> Asia, withover 95% of electric two-wheelers us<strong>in</strong>g them. 31In addition, Asia has a relatively poor record forbattery production <strong>and</strong> recycl<strong>in</strong>g efficiency. Inthe PRC, lead pollution rates from e-scootersare about 420 milligrams per kilometer (mg/km),compared to about 32 mg/km for a gasol<strong>in</strong>etwo-wheeler. 32 All of these emissions occur dur<strong>in</strong>gthe m<strong>in</strong><strong>in</strong>g <strong>and</strong> smelt<strong>in</strong>g, battery manufacture,<strong>and</strong> recycl<strong>in</strong>g phases.Estimat<strong>in</strong>g lead pollution of e-scooters <strong>in</strong> <strong>India</strong><strong>and</strong> Viet Nam is complicated s<strong>in</strong>ce a large portionof lead batteries are imported from the PRC. Mao<strong>and</strong> Dong et al. estimate regional emission ratesof lead from battery production <strong>and</strong> recycl<strong>in</strong>g. 33For the most part, regional rates are discussed,but given <strong>India</strong>’s size, the authors calculate <strong>India</strong>specificloss rates. <strong>India</strong> has one of the lowestlead-loss rates <strong>in</strong> Asia, 10.9% of lead output,while Asia’s average is 19.6% of lead output.Battery life is related to both recharge cycles <strong>and</strong>weather. Battery life can deteriorate significantly<strong>in</strong> hot or cold temperatures. 34 S<strong>in</strong>ce e-scooters arenew vehicles, it is difficult to estimate how manykilometers one might travel before replac<strong>in</strong>g abattery. Additionally, batteries for larger, fastere-scooters are significantly larger than batteries <strong>in</strong>most Ch<strong>in</strong>ese e-scooters. Table 15 shows batterysize, weight, <strong>and</strong> lead emissions for differente-scooter classes <strong>and</strong> mileage assumptions.35❚❚❚ Environmental Impacts30This is a calculation of the total amount of CO 2reduction over the life of vehicle. CO 2reduction (<strong>in</strong> grams) =8,000 km/yr*6 (55gCO 2/km-27.7g CO 2), where 55g/km is the assumed emission rate of gasol<strong>in</strong>e motorcycles<strong>and</strong> 27.7g/km is the average CO 2emission rate of electric scotters.31Jamerson <strong>and</strong> Benjam<strong>in</strong> 2007.32Cherry et al. 2009.33Mao, J. et al. 2008. A Multilevel Cycle of Anthropogenic Lead: II. Results <strong>and</strong> Discussion. Resources, Conservation<strong>and</strong> Recycl<strong>in</strong>g. 52 (8–9). pp. 1050–1057.34We<strong>in</strong>ert, J.X. et al. 2007. Lead-Acid <strong>and</strong> Lithium-Ion Batteries for the Ch<strong>in</strong>ese Electric Bike Market <strong>and</strong> Implicationson Future Technology Advancement. Journal of Power Sources. 172 (2). pp. 938–945.
Table 15: Average Emissions from Lead Acid Batteries36❚❚❚ Electric <strong>Two</strong>-<strong>Wheelers</strong> <strong>in</strong> <strong>India</strong> <strong>and</strong> Viet NamE-scooterClass I<strong>India</strong>E-scooterClass IIE-scooterClass IIIE-scooterClass IViet NamE-scooterClass IIE-scooterClass IIIBattery capacity (Ah) 20 30 40 20 30 40Lead content (kg) 18 29 40 18 29 40Lead loss rate10.9 10.9 10.9 19.6 19.6 19.6(% of output) aMileage over15,000 15,000 15,000 15,000 15,000 15,000battery life bAverage emissionrate (mg Pb/km)131 211 291 235 379 523Ah = amp-hour, e-scooter = electric scooter, kg = kilogram, km = kilometer, mg Pb/km = milligram lead per kilometer.aFrom Mao <strong>and</strong> Dong et al. 2008. <strong>India</strong>-specific rate of 10.9% used for <strong>India</strong> <strong>and</strong> Asia average rate or 19.6% used forViet Nam.bEmission rate per kilometer is very sensitive to battery life s<strong>in</strong>ce all production <strong>and</strong> recycl<strong>in</strong>g emissions are averaged overthe life cycle of the battery. Estimates vary on the amount of mileage one can achieve per battery, but most makers report10,000–15,000 km.Source: Authors; Mao, J. et al. 2008. A Multilevel Cycle of Anthropogenic Lead: II. Results <strong>and</strong> Discussion.Resources, Conservation <strong>and</strong> Recycl<strong>in</strong>g. 52(8–9). pp. 1050–1057.
ConclusionsE-scooter adoption is dependent on anumber of variables, <strong>in</strong>clud<strong>in</strong>g purchaseprice, operat<strong>in</strong>g costs, ma<strong>in</strong>tenance cost(battery purchase), performance, <strong>and</strong> regulation.In both Ahmedabad, <strong>India</strong>, <strong>and</strong> Ha Noi, VietNam, <strong>in</strong>dividuals valued various attributesdifferently, illustrat<strong>in</strong>g the need for locationspecificpolicies. For <strong>in</strong>stance, remov<strong>in</strong>g licenserequirements is “worth” about D1 millionon average <strong>in</strong> Ha Noi, whereas they are notimportant <strong>in</strong> Ahmedabad. One of the commonthemes among survey respondents <strong>and</strong> othertransport experts <strong>in</strong> both cities is that e-scooterssuffer a perception problem. Individuals seemskeptical of their reliability or perceive themto be low-power, low-performance vehicleswhose quality is not proven. In fact, a poorreputation for quality is likely a significant factor.If given accurate <strong>in</strong>formation related to e-scooterperformance <strong>and</strong> price, <strong>in</strong>dividuals have somelikelihood of choos<strong>in</strong>g them over gasol<strong>in</strong>e twowheelers.However, many <strong>in</strong>dividuals do not haveadequate knowledge to make this decision <strong>in</strong> themarketplace. It is <strong>in</strong>cumbent upon <strong>in</strong>dustry <strong>and</strong>the government to <strong>in</strong>crease public awareness toadequately market the performance <strong>and</strong> pricecharacteristics of e-scooters, <strong>in</strong> an environmentwhere gasol<strong>in</strong>e two-wheelers are ubiquitous <strong>and</strong>their performance well known.replaces a gasol<strong>in</strong>e two-wheeler reduces CO 2emissions by 1.3 tons per vehicle over its lifespan<strong>in</strong> Ha Noi. Moreover, almost all local air pollutantsare reduced, with the likely exception of SO 2 . InAhmedabad, the direction of the impact is thesame on all pollutants, but more modest s<strong>in</strong>cethe power generation sector is more emission<strong>in</strong>tensive <strong>and</strong> the likelihood of wide-scaleadoption seems lower, based on the surveys.Lead pollution is a serious concern that needsto be avoided through adoption of cleanerlithium-ion <strong>and</strong>/or nickel-metal hydride batterytechnologies or vastly improved recovery <strong>and</strong>recycl<strong>in</strong>g processes. Some of the more advancedlead production, battery manufacture, <strong>and</strong>recycl<strong>in</strong>g processes have quite low loss rates,<strong>in</strong> the order of 5% of the f<strong>in</strong>al lead mass ofthe battery. Moreover, steps can be taken toassure conta<strong>in</strong>ment of emissions to improveenvironmental <strong>and</strong> occupational health. Both<strong>India</strong> <strong>and</strong> Viet Nam have begun adoption ofan environmental certification program, BetterEnvironmental Susta<strong>in</strong>ability Targets, whichfocuses on reduc<strong>in</strong>g negative impacts associatedwith lead battery manufacture.Instruments to Improve ElectricScooter AdoptionThe air quality improvement <strong>and</strong> CO 2 reductionswill be significant if e-scooters can replacegasol<strong>in</strong>e two-wheelers. Each e-scooter thatThere are many ways to support e-scooteradoption, <strong>in</strong>clud<strong>in</strong>g remov<strong>in</strong>g fuel subsidies forgasol<strong>in</strong>e two-wheelers <strong>and</strong> subsidiz<strong>in</strong>g clean
38❚❚❚ Electric <strong>Two</strong>-<strong>Wheelers</strong> <strong>in</strong> <strong>India</strong> <strong>and</strong> Viet Nambattery technology, preferential taxation <strong>and</strong>registration fees. While operat<strong>in</strong>g costs (electricity)are very low, the up-front cost of batteries isprohibitive for many consumers, even thoughthe average cost over time could be significantlylower than that of a gasol<strong>in</strong>e two-wheeler.Alternative f<strong>in</strong>anc<strong>in</strong>g models could potentiallyovercome this problem, like leas<strong>in</strong>g or f<strong>in</strong>anc<strong>in</strong>gbatteries, but these models are unproven <strong>in</strong> thiscontext. Without market<strong>in</strong>g to <strong>in</strong>form the public<strong>and</strong> address negative perceptions of e-scooters,or shifts <strong>in</strong> the economics of vehicle choice (likemajor gasol<strong>in</strong>e price shifts), e-scooters will onlyconstitute a small portion of vehicles on thestreet. As technology advances <strong>and</strong> prices drop,coupled with improved performance, e-scooterscan beg<strong>in</strong> to become more widely used. Untilthen, government <strong>in</strong>tervention to improve theeconomic advantage of e-scooters relative togasol<strong>in</strong>e two-wheelers could be a cost-effectivepollution mitigation strategy.Role of Policy MakersPolicy makers have a few tools that they can useto improve the market of e-scooters. In general,preferential taxation policy is shown to factor<strong>in</strong> <strong>in</strong>creas<strong>in</strong>g market share. This policy could<strong>in</strong>clude rais<strong>in</strong>g sales taxes <strong>and</strong> registration fees atthe po<strong>in</strong>t of purchase for gasol<strong>in</strong>e two-wheelers,while simultaneously reduc<strong>in</strong>g e-scooter fees.In Ha Noi, a D1 million tax differential is worthabout a D1.6 million purchase price advantagetoward e-scooters. This tax preference could benear term, until adoption rates are reasonable<strong>and</strong> the technology proven. Remov<strong>in</strong>g licens<strong>in</strong>grequirements also encourages adoption <strong>in</strong>Ha Noi, although this could have safetyconsequences. While it is difficult for thegovernment to reduce operat<strong>in</strong>g costs (fuelprimarily), a more country-level response would<strong>in</strong>clude reduc<strong>in</strong>g gasol<strong>in</strong>e subsidies, effectively<strong>in</strong>creas<strong>in</strong>g gasol<strong>in</strong>e prices. Unfortunately, thisbroad-brush approach does not target gasol<strong>in</strong>etwo-wheelers specifically, but will <strong>in</strong>creaseoperat<strong>in</strong>g costs of gasol<strong>in</strong>e vehicles <strong>and</strong> thus<strong>in</strong>crease the operat<strong>in</strong>g cost advantage of electricvehicles.<strong>Two</strong> ma<strong>in</strong> components of the success of e-bikes<strong>in</strong> the PRC are <strong>in</strong>frastructure availability <strong>and</strong>somewhat draconian bans on gasol<strong>in</strong>e twowheelers<strong>in</strong> many cities. The current e-scootertechnology is comparable <strong>in</strong> performance to agasol<strong>in</strong>e two-wheeler <strong>in</strong> an urban environment,so e-scooters do not necessarily require exclusive<strong>in</strong>frastructure. Increas<strong>in</strong>g regulation aga<strong>in</strong>stgasol<strong>in</strong>e two-wheelers, although difficult, isone of the most effective ways to promotee-scooters.Role of IndustryThe models presented <strong>in</strong> this report identifymany performance characteristics that willimprove the overall marketability of e-scooters,<strong>in</strong> addition to price components that are largely<strong>in</strong> the h<strong>and</strong>s of the <strong>in</strong>dustry. Several factors weredeemed important, <strong>in</strong>clud<strong>in</strong>g top speed, range,acceleration, <strong>and</strong> purchase <strong>and</strong> operat<strong>in</strong>g costs. Itis the responsibility of the companies <strong>and</strong> <strong>in</strong>dustryassociations to improve the performance ofe-scooters so that they can compete on a similarlevel as gasol<strong>in</strong>e two-wheelers. The disadvantageof e-scooters is the battery system that must bepurchased up-front. This makes the purchaseprice significantly more expensive <strong>and</strong> consumersare only will<strong>in</strong>g to pay one-third the expected
lifetime sav<strong>in</strong>gs at the time of purchase. This is asignificant hurdle, but research <strong>and</strong> developmentare result<strong>in</strong>g <strong>in</strong> improved e-scooter performanceat lower prices. Unfortunately, because of therelatively modular e-scooter <strong>in</strong>dustry, weak<strong>in</strong>tellectual property protection, <strong>and</strong> low barriersto entry, e-scooter companies have little <strong>in</strong>centiveto <strong>in</strong>novate. 35One of the biggest hurdles is negative perceptions<strong>and</strong> misconceptions. An <strong>in</strong>dustry association thatregulates the quality of vehicles <strong>and</strong> effectivelymarkets e-scooters is important to overcomepersistent, if unwarranted, negative perceptions,many of which are based on some bad earlyexperiences of the e-scooter <strong>in</strong>dustry.Jo<strong>in</strong>t RoleTo <strong>in</strong>crease e-scooter adoption, government <strong>and</strong><strong>in</strong>dustry must jo<strong>in</strong> to develop market<strong>in</strong>g strategiesfor e-scooters. Government can also serve as anearly adopter for agencies <strong>and</strong> employees tocreate an <strong>in</strong>itial market <strong>and</strong> overcome negativeperceptions. Government can also provide directsubsidy to overcome higher-quality batteryprice barriers, which simultaneously improvesperformance <strong>and</strong> reduces environmentalimpacts. F<strong>in</strong>ally, because of the fragmentednature of the e-scooter <strong>in</strong>dustry, government ornongovernment research <strong>and</strong> development canimprove the technology, which can be sharedwith <strong>in</strong>dustry.F<strong>in</strong>al RemarksE-scooters have potential to improve air quality<strong>and</strong> reduce greenhouse gas emissions <strong>in</strong>Viet Nam <strong>and</strong> <strong>India</strong>. This research developedseveral models to estimate the effects of policymeasures <strong>and</strong> technological improvements onvehicle choice <strong>and</strong>, ultimately, air quality. Theapplication of these models can test a numberof policy <strong>and</strong> technology scenarios, of which afew are presented <strong>in</strong> this report. Future workcan apply these models to specific policies orimprovements <strong>in</strong> performance or price. Notably,the models do not estimate all of the factorsthat could <strong>in</strong>fluence choice, as evidenced bythe “alternative specific constants” for gasol<strong>in</strong>etwo-wheelers. These constants <strong>in</strong>clude manyfactors that vary between vehicle types but areunobserved, <strong>and</strong> likely <strong>in</strong>clude issues relatedto perception. E-scooter adoption can <strong>in</strong>creasewith a comb<strong>in</strong>ation of <strong>in</strong>creased performance,reduced price, regulations favor<strong>in</strong>g e-scooters(or harm<strong>in</strong>g gasol<strong>in</strong>e two-wheelers), improved<strong>in</strong>frastructure, <strong>and</strong> effective market<strong>in</strong>g. Theseare all difficult to achieve, but the benefitscould supplant other strategies toward reduc<strong>in</strong>genvironmental problems.39❚❚❚ Conclusion35We<strong>in</strong>ert, J.X. et al. 2008. The Future of Electric <strong>Two</strong>-<strong>Wheelers</strong> <strong>and</strong> Electric Vehicles <strong>in</strong> Ch<strong>in</strong>a. Energy Policy.36 (7). pp. 2544–2555.
40❚❚❚ Electric <strong>Two</strong>-<strong>Wheelers</strong> <strong>in</strong> <strong>India</strong> <strong>and</strong> Viet NamAppendix 1: Logit Model<strong>in</strong>gFormulationThe data analysis applies the conditional logitmodel based on the theory of r<strong>and</strong>om utility. 1Let the <strong>in</strong>direct utility associated with vehicle kbe given by:where k = 1,...,m (m alternatives)ƒε kX kßα={1y ji0( dkXk; ) + kV = f , , ,k= determ<strong>in</strong>istic component of utility= stochastic component of utilityreflect<strong>in</strong>g researcher uncerta<strong>in</strong>ty= sector of attributes for option k= vector of attribute parameters to beestimated= the parameter on to be estimatedif j chose iotherwised kwhere k = 1 denotesthe reference alternative.variables, the probability of choos<strong>in</strong>g alternativei from choice set C is given by:Let the subscript j denote the jth respondent forj =1,…,N<strong>and</strong> letP( i / C)={1y ji0 mk1expexp( d X)( d X)Then the log-likelihood to be maximized isspecified as follows:logL=Nikif j chose iotherwisem∑∑j=1 k=1yjilogm∑k=1iexpkexp( f )i( f )kNow assume an additively separable l<strong>in</strong>ear<strong>in</strong>direct utility function:Vkd Xkk kFurthermore, assume ε κ ∼iid that across all alternativesas a Type I Extreme Value Distribution.It can be shown that, as a result of the propertiesof Type I Extreme Value Distribution r<strong>and</strong>om1McFadden, D. 1974. Conditional Logit Analysis of Qualitative Choice Behavior. In Zarembka, P. ed. Frontiers<strong>in</strong> Econometrics. New York: Academic Press.
Appendix 2: Electric VehicleEmission Rate Estimatione = electricity requirement from the plug towheel41Once emission <strong>in</strong>tensities are estimated, one canestimate emission rates of electric vehicles perkilometer as follows:EmissionRate (g/km) = e ×(1+tl)×∑Epowerplants∑Gpowerplantstl = transmission loss rate∑Epowerplants∑Gpowerplants= total emissions of a certa<strong>in</strong> pollutantfrom all power plants= yearly electricity generation of allpower plants.❚❚❚ Appendixeswhere EmissionRate = emission rate of a certa<strong>in</strong>pollutant from an e-scooter
42❚❚❚ Electric <strong>Two</strong>-<strong>Wheelers</strong> <strong>in</strong> <strong>India</strong> <strong>and</strong> Viet NamAppendix 3: Market AnalysisStated-preference experiments are frequentlyused <strong>in</strong> market<strong>in</strong>g for forecast<strong>in</strong>g new productdem<strong>and</strong> <strong>and</strong> <strong>in</strong> recent years the methodologyhas been applied by transport <strong>and</strong> economicresearchers to assess the dem<strong>and</strong> for new“green” vehicles. Most of this stated-preferenceresearch on electric cars <strong>and</strong> alternative fuelvehicles has focused on the effects of price <strong>and</strong>vehicle performance attributes on the purchasedecision; relatively few studies have exam<strong>in</strong>ed theeffect of economic <strong>in</strong>struments on this decision.Potoglou <strong>and</strong> Kanaroglou exam<strong>in</strong>ed the ability ofeconomic <strong>in</strong>centives to encourage clean vehicleadoption, us<strong>in</strong>g a stated-preference <strong>in</strong>ternetsurvey <strong>in</strong> Hamilton, Canada. 1 Their experiment<strong>in</strong>volved the choice between an alternative fuelvehicle, a conventional gas vehicle, <strong>and</strong> a hybridelectric vehicle based on class/size, purchase price,annual fuel cost, annual ma<strong>in</strong>tenance cost, fuelavailability, <strong>and</strong> acceleration. The authors made<strong>in</strong>centives explicit attributes <strong>in</strong> the experiment,which <strong>in</strong>cluded access to high occupancy vehicle(HOV) lanes, exemption from park<strong>in</strong>g/meter fees,<strong>and</strong> exemption from sales tax.Potoglou <strong>and</strong> Kanaroglou found that theprobability of adopt<strong>in</strong>g an alternative fuelvehicle or a hybrid electric vehicle <strong>in</strong>creased <strong>in</strong>the presence of a tax free option. 2 In particular,their analysis <strong>in</strong>dicated that all else be<strong>in</strong>g equal,respondents would pay an additional C$2,000to C$5,000 for a vehicle that was exempt ofsales tax.Relative to the number of studies on preferences for four-wheeled alternative vehicles, theresearch that has been conducted to assess themarket potential for two-wheeled alternativevehicles is quite limited. Only one paper to date(that the authors know of) has used the statedpreferencemethod to dissect the choice decision fore-scooter purchases. Chiu <strong>and</strong> Tzeng exam<strong>in</strong>edthe dem<strong>and</strong> for e-scooters <strong>in</strong> Taipei,Ch<strong>in</strong>a. 3 Theirr<strong>and</strong>om sample of households <strong>in</strong> Taipei,Ch<strong>in</strong>awas used to evaluate the choice between a largeeng<strong>in</strong>emotorcycle, a small-eng<strong>in</strong>e motorcycle,<strong>and</strong> an electric motorcycle based on purchaseprice, top speed, emission level, operat<strong>in</strong>gcost, cruise range, style, <strong>and</strong> environmentalfriendl<strong>in</strong>ess.Chiu <strong>and</strong> Tzeng’s <strong>in</strong>vestigation revealed thatmotorcycle preferences differed between male<strong>and</strong> female riders, <strong>and</strong> thus they estimated asegmented mult<strong>in</strong>omial logit model for males<strong>and</strong> females. 4 The authors found purchase price<strong>and</strong> speed to be significant choice determ<strong>in</strong>antsfor all riders, <strong>and</strong> found that education <strong>and</strong> thenumber of motorcycles per household memberhad positive effects on choos<strong>in</strong>g an electricmotorcycle. Their results confirmed genderspecificeffects for operat<strong>in</strong>g costs, range, <strong>and</strong>style. Cruis<strong>in</strong>g range was positive <strong>and</strong> significant1Potoglou <strong>and</strong> P. Kanaroglou. 2007. Household Dem<strong>and</strong> <strong>and</strong> Will<strong>in</strong>gness to Pay for <strong>Clean</strong> Vehicles. TransportationResearch Part D. 12. pp. 264–274.2Potoglou <strong>and</strong> Kanaroglou 2007.3Chiu Y.C., <strong>and</strong> G.H. Tzeng. 1999. Transportation Research Part D. 4(2). pp. 127–146.4Chiu <strong>and</strong> Tzeng 1999.
for all males, while operat<strong>in</strong>g costs were importantto older males. Females showed a preference fora scooter-style bike over a traditional style, mostlikely because the scooter-style is lightweight <strong>and</strong>is more comfortable. Economic <strong>in</strong>centives werenot explicitly considered, although <strong>in</strong>creas<strong>in</strong>ge-scooter subsidies were offered as a way tostimulate adoption.43❚❚❚ Appendixes
Electric <strong>Two</strong>-<strong>Wheelers</strong> <strong>in</strong> <strong>India</strong> <strong>and</strong> <strong>Vietnam</strong>—Market Analysis<strong>and</strong> Environmental ImpactsWhile the use of electric two-wheelers has <strong>in</strong>creased <strong>in</strong> the People’s Republic of Ch<strong>in</strong>a(PRC) <strong>in</strong> the past decade, such unparalleled growth has not extended beyond the PRC’sborders to countries, such as <strong>India</strong> <strong>and</strong> Viet Nam, where environmentally detrimentalgasol<strong>in</strong>e motorcycles dom<strong>in</strong>ate. This report documents market conditions <strong>in</strong> Ahmedabad,<strong>India</strong>, <strong>and</strong> Ha Noi, Viet Nam, to expla<strong>in</strong> why this is so, <strong>and</strong> analyzes the potentialenvironmental impact of electric two-wheelers to show how they could chart a pathtoward susta<strong>in</strong>able transport <strong>in</strong> these <strong>and</strong> other countries <strong>in</strong> the region.About the Asian Development BankADB’s vision is an Asia <strong>and</strong> Pacific region free of poverty. Its mission is to help itsdevelop<strong>in</strong>g member countries substantially reduce poverty <strong>and</strong> improve the quality of lifeof their people. Despite the region’s many successes, it rema<strong>in</strong>s home to two-thirds of theworld’s poor: 1.8 billion people who live on less than $2 a day, with 903 million struggl<strong>in</strong>gon less than $1.25 a day. ADB is committed to reduc<strong>in</strong>g poverty through <strong>in</strong>clusiveeconomic growth, environmentally susta<strong>in</strong>able growth, <strong>and</strong> regional <strong>in</strong>tegration.Based <strong>in</strong> Manila, ADB is owned by 67 members, <strong>in</strong>clud<strong>in</strong>g 48 from the region. Its ma<strong>in</strong><strong>in</strong>struments for help<strong>in</strong>g its develop<strong>in</strong>g member countries are policy dialogue, loans, equity<strong>in</strong>vestments, guarantees, grants, <strong>and</strong> technical assistance.Asian Development Bank6 ADB Avenue, M<strong>and</strong>aluyong City1550 Metro Manila, Philipp<strong>in</strong>eswww.adb.orgISBN 978-971-561-873-1Publication Stock No. RPT091118Pr<strong>in</strong>ted <strong>in</strong> the Philipp<strong>in</strong>es