- Page 7 and 8:
viContents12. Streptogramins and Ox
- Page 9 and 10:
viiiContributorsElizabeth D. Hermse
- Page 11 and 12:
2 Craigconcentrations. With this pa
- Page 13 and 14:
4 Craigaminoglycosides decreases an
- Page 15 and 16:
6 CraigLog 10 CFU/Thigh at 24 hours
- Page 17 and 18:
8 Craig10080CephalosporinsPenicilli
- Page 19 and 20:
10 Craig50Cephalosporins40T>MIC (%)
- Page 21 and 22:
12 Craigor fluoroquinolones has a p
- Page 23 and 24:
14 CraigTABLE 3 Pharmacodynamic and
- Page 25 and 26:
16 Craig14. Andes D, van Ogtrop M.
- Page 27 and 28:
18 Craig55. Heffelfinger JD, Dowell
- Page 30 and 31:
2 Applying Pharmacodynamics for Sus
- Page 32 and 33:
Applying Pharmacodynamics for Susce
- Page 34 and 35:
Applying Pharmacodynamics for Susce
- Page 36 and 37:
Applying Pharmacodynamics for Susce
- Page 38 and 39:
Applying Pharmacodynamics for Susce
- Page 40 and 41:
≥Applying Pharmacodynamics for Su
- Page 42 and 43:
Applying Pharmacodynamics for Susce
- Page 44 and 45:
Applying Pharmacodynamics for Susce
- Page 46 and 47:
Applying Pharmacodynamics for Susce
- Page 48 and 49:
Applying Pharmacodynamics for Susce
- Page 50 and 51:
Applying Pharmacodynamics for Susce
- Page 52 and 53:
Applying Pharmacodynamics for Susce
- Page 54 and 55:
Section II: Non-clinical Models of
- Page 56 and 57:
In Vitro Dynamic Models as Predicti
- Page 58 and 59:
In Vitro Dynamic Models as Predicti
- Page 60 and 61:
In Vitro Dynamic Models as Predicti
- Page 62 and 63:
In Vitro Dynamic Models as Predicti
- Page 64 and 65:
In Vitro Dynamic Models as Predicti
- Page 66 and 67:
In Vitro Dynamic Models as Predicti
- Page 68 and 69:
In Vitro Dynamic Models as Predicti
- Page 70 and 71:
In Vitro Dynamic Models as Predicti
- Page 72 and 73:
In Vitro Dynamic Models as Predicti
- Page 74 and 75:
In Vitro Dynamic Models as Predicti
- Page 76 and 77:
In Vitro Dynamic Models as Predicti
- Page 78 and 79:
In Vitro Dynamic Models as Predicti
- Page 80 and 81:
In Vitro Dynamic Models as Predicti
- Page 82 and 83:
In Vitro Dynamic Models as Predicti
- Page 84 and 85:
In Vitro Dynamic Models as Predicti
- Page 86 and 87:
In Vitro Dynamic Models as Predicti
- Page 88 and 89:
4 Animal Models of Infection for th
- Page 90 and 91:
Animal Models of Infection for the
- Page 92 and 93:
Animal Models of Infection for the
- Page 94 and 95:
Animal Models of Infection for the
- Page 96 and 97:
Animal Models of Infection for the
- Page 98 and 99:
Animal Models of Infection for the
- Page 100 and 101:
Animal Models of Infection for the
- Page 102 and 103:
Animal Models of Infection for the
- Page 104 and 105:
Animal Models of Infection for the
- Page 106 and 107:
Animal Models of Infection for the
- Page 108 and 109:
Animal Models of Infection for the
- Page 110 and 111:
Animal Models of Infection for the
- Page 112 and 113:
5 The Predictive Value of Laborator
- Page 114 and 115:
Predictive Value of Laboratory Test
- Page 116 and 117:
Predictive Value of Laboratory Test
- Page 118 and 119:
Predictive Value of Laboratory Test
- Page 120 and 121:
Predictive Value of Laboratory Test
- Page 122 and 123:
Predictive Value of Laboratory Test
- Page 124 and 125:
Predictive Value of Laboratory Test
- Page 126 and 127:
Predictive Value of Laboratory Test
- Page 128 and 129:
Predictive Value of Laboratory Test
- Page 130 and 131:
Predictive Value of Laboratory Test
- Page 132 and 133:
Predictive Value of Laboratory Test
- Page 134 and 135:
Predictive Value of Laboratory Test
- Page 136:
Predictive Value of Laboratory Test
- Page 139 and 140:
130 Tozuka and Murakawacharacterist
- Page 141 and 142:
132 Tozuka and Murakawa(cephem, oxa
- Page 143 and 144:
134 Tozuka and MurakawaInfusion pha
- Page 145 and 146:
136 Tozuka and Murakawapoorly into
- Page 147 and 148:
138 Tozuka and Murakawasix hours (3
- Page 149 and 150:
140 Tozuka and Murakawadosing inter
- Page 151 and 152:
142 Tozuka and MurakawaIntestinal b
- Page 153 and 154:
144 Tozuka and Murakawa16. Tozuka Z
- Page 155 and 156:
146 Tozuka and Murakawa59. Nicolau
- Page 157 and 158:
148 Kim and Nicolauand 23S) and fro
- Page 159 and 160:
150 Kim and Nicolaudetectable amino
- Page 161 and 162:
152 Kim and Nicolauactivity (26). B
- Page 163 and 164:
154 Kim and Nicolaucalculated as th
- Page 165 and 166:
156 Kim and Nicolauoverestimate of
- Page 167 and 168:
158 Kim and Nicolauit will likely m
- Page 169 and 170:
160 Kim and Nicolautrough concentra
- Page 171 and 172:
162 Kim and NicolauTABLE 1 Selectio
- Page 173 and 174:
164 Kim and NicolauConcentration (
- Page 175 and 176:
166 Kim and NicolauAdoption of cont
- Page 177 and 178:
168 Kim and Nicolau18. Swenson C, C
- Page 179 and 180:
170 Kim and Nicolau61. Karlowsky J,
- Page 181 and 182:
172 Kim and Nicolau103. Beaubien AR
- Page 183 and 184:
174 Kim and Nicolau146. Marik PE, L
- Page 186 and 187:
8 QuinolonesPaul G. AmbroseInstitut
- Page 188 and 189:
Quinolones 179876Log 10 CFU/mL54321
- Page 190 and 191:
Quinolones 1811.0Probability of era
- Page 192 and 193:
Quinolones 183100Efficacy (Percent
- Page 194 and 195:
Quinolones 1855040A30201040B302010N
- Page 196 and 197:
Quinolones 1878. Ambrose PG, Grasel
- Page 198 and 199:
9 Glycopeptide PharmacodynamicsEliz
- Page 200 and 201:
Glycopeptide Pharmacodynamics 191Va
- Page 202 and 203:
Glycopeptide Pharmacodynamics 193re
- Page 204 and 205:
Glycopeptide Pharmacodynamics 195es
- Page 206 and 207:
Glycopeptide Pharmacodynamics 197fr
- Page 208 and 209:
Glycopeptide Pharmacodynamics 199va
- Page 210 and 211:
Glycopeptide Pharmacodynamics 201Va
- Page 212 and 213:
Glycopeptide Pharmacodynamics 203TA
- Page 214 and 215:
Glycopeptide Pharmacodynamics 205re
- Page 216 and 217:
Glycopeptide Pharmacodynamics 207co
- Page 218 and 219:
Glycopeptide Pharmacodynamics 209RE
- Page 220 and 221:
Glycopeptide Pharmacodynamics 211pa
- Page 222 and 223:
Glycopeptide Pharmacodynamics 21386
- Page 224:
Glycopeptide Pharmacodynamics 21513
- Page 227 and 228:
218 Jain et al.the polypeptide (P)
- Page 229 and 230:
220 Jain et al.1999-2000), all S. p
- Page 231 and 232:
222 Jain et al.azalides (7,8). In a
- Page 233 and 234:
224 Jain et al.age 65 years or more
- Page 235 and 236:
226 Jain et al.cross-resistance, bo
- Page 237 and 238:
228 Jain et al.35. Strigl S, Roblin
- Page 239 and 240:
230 Jain et al.77. Mandell LA, Bart
- Page 241 and 242:
232 Hermsen and RotschaferWhile met
- Page 243 and 244:
234 Hermsen and Rotschaferdisulfira
- Page 245 and 246:
236 Hermsen and Rotschafer3. George
- Page 248 and 249:
12 Streptogramins and Oxazolidinone
- Page 250 and 251:
Streptogramins and Oxazolidinones 2
- Page 252 and 253:
Streptogramins and Oxazolidinones 2
- Page 254 and 255:
Streptogramins and Oxazolidinones 2
- Page 256 and 257:
Streptogramins and Oxazolidinones 2
- Page 258 and 259:
Streptogramins and Oxazolidinones 2
- Page 260 and 261:
Streptogramins and Oxazolidinones 2
- Page 262 and 263:
Streptogramins and Oxazolidinones 2
- Page 264 and 265:
Streptogramins and Oxazolidinones 2
- Page 266 and 267:
Streptogramins and Oxazolidinones 2
- Page 268 and 269:
Streptogramins and Oxazolidinones 2
- Page 270 and 271:
Streptogramins and Oxazolidinones 2
- Page 272 and 273:
Streptogramins and Oxazolidinones 2
- Page 274:
Streptogramins and Oxazolidinones 2
- Page 277 and 278:
268 Andes and Craigminocycline > do
- Page 279 and 280:
270 Andes and CraigProtein-binding
- Page 281 and 282:
272 Andes and CraigDoxycycline stud
- Page 283 and 284:
274 Andes and Craigmurine thigh mod
- Page 285 and 286:
276 Andes and Craig13. Weber K, Pfi
- Page 288 and 289:
Section IV: Antiviral Agents14 The
- Page 290 and 291:
TABLE 1 Plasma and Intracellular Ph
- Page 292 and 293:
The Clinical Pharmacology of Nucleo
- Page 294 and 295:
The Clinical Pharmacology of Nucleo
- Page 296 and 297:
The Clinical Pharmacology of Nucleo
- Page 298 and 299:
TABLE 2 FDA-Approved Dosing Regimen
- Page 300 and 301:
The Clinical Pharmacology of Nucleo
- Page 302:
The Clinical Pharmacology of Nucleo
- Page 305 and 306:
296 DrusanoConsequently, in this ch
- Page 307 and 308:
298 Drusanolinear function. Finally
- Page 309 and 310:
300 DrusanoA2520p24 pg/ml(thousands
- Page 311 and 312:
302 Drusano6050p24 (ng/mL)4030204 x
- Page 313 and 314:
304 Drusano10080% Inhibition6040200
- Page 315 and 316:
306 DrusanoWeighted Residuals201816
- Page 317 and 318:
308 Drusano3020Condon 74 mutation a
- Page 319 and 320:
310 DrusanoA600500Mean CD4 over 24
- Page 321 and 322:
312 DrusanoTABLE 2 In Vitro Assessm
- Page 323 and 324:
314 Drusano16. Drusano GL, Balis FM
- Page 325 and 326:
316 Andesmixture of phosphatidylcho
- Page 327 and 328:
318 AndesTABLE 1 Amphotericin B Pha
- Page 329 and 330:
320 AndesIn vivo time kill studies
- Page 331 and 332:
322 AndesA 88CR 2 = 93% R 2 8= 61%7
- Page 333 and 334:
324 Andes8. Diekema DJ, Messer SA,
- Page 335 and 336:
326 Andes51. Clemons KV, Sobel RA,
- Page 337 and 338:
328 Moutonbelow). In 1952, Jerchel
- Page 339 and 340:
330 Mouton100Vd3.080t 1/22.5t 1/2 (
- Page 341 and 342:
332 Moutontriazoles with values up
- Page 343 and 344:
334 Moutonthe MIC for azoles as cur
- Page 345 and 346:
336 Mouton44 4 44 44 44100%Opticals
- Page 347 and 348:
338 MoutonTABLE 4 Comparative Susce
- Page 349 and 350:
340 Moutonadministered i.p. at dosi
- Page 351 and 352:
342 MoutonfAUC/MIC ratio of around
- Page 353 and 354:
344 Moutonet al. (107). The efficac
- Page 355 and 356:
346 Mouton200AUC10001 day1 week2 we
- Page 357 and 358:
348 Mouton12. Brammer KW, Farrow PR
- Page 359 and 360:
350 Mouton52. Purkins L, Wood N, Gr
- Page 361 and 362:
352 Mouton91. Breuker I, Meis JF, V
- Page 364 and 365:
18 Glucan Synthase InhibitorsTawand
- Page 366 and 367:
Glucan Synthase Inhibitors 357AEchi
- Page 368 and 369:
Glucan Synthase Inhibitors 359SUSCE
- Page 370 and 371:
Glucan Synthase Inhibitors 36180% m
- Page 372 and 373:
Glucan Synthase Inhibitors 363TABLE
- Page 374 and 375:
Glucan Synthase Inhibitors 36565Cas
- Page 376 and 377:
Glucan Synthase Inhibitors 367appro
- Page 378 and 379: Glucan Synthase Inhibitors 36910025
- Page 380 and 381: Glucan Synthase Inhibitors 371TABLE
- Page 382 and 383: Glucan Synthase Inhibitors 373inter
- Page 384 and 385: Glucan Synthase Inhibitors 3755. Se
- Page 386 and 387: Glucan Synthase Inhibitors 37746. S
- Page 388 and 389: Section VI: Antimalarial Agents19 A
- Page 390 and 391: Antimalarial Agents 381thereby chem
- Page 392 and 393: Antimalarial Agents 383Atovaquone-P
- Page 394 and 395: Antimalarial Agents 385TABLE 1 Sing
- Page 396 and 397: Antimalarial Agents 387relationship
- Page 398 and 399: TABLE 2 Summary of Pharmacokinetic
- Page 400 and 401: Antimalarial Agents 39115Plasma qui
- Page 402 and 403: Antimalarial Agents 393population k
- Page 404 and 405: Total parasite burdenAntimalarial A
- Page 406 and 407: Antimalarial Agents 397are not impo
- Page 408 and 409: Antimalarial Agents 399Total parasi
- Page 410 and 411: Antimalarial Agents 40110 12Total p
- Page 412 and 413: Antimalarial Agents 403parasite dev
- Page 414 and 415: Antimalarial Agents 405treatment or
- Page 416 and 417: Antimalarial Agents 40741. White NJ
- Page 418: Antimalarial Agents 40985. Simpson
- Page 421 and 422: 412 Drusanowell but the end point d
- Page 423 and 424: 414 DrusanoHIV copy number change (
- Page 425 and 426: 416 Drusanoalso indicates that the
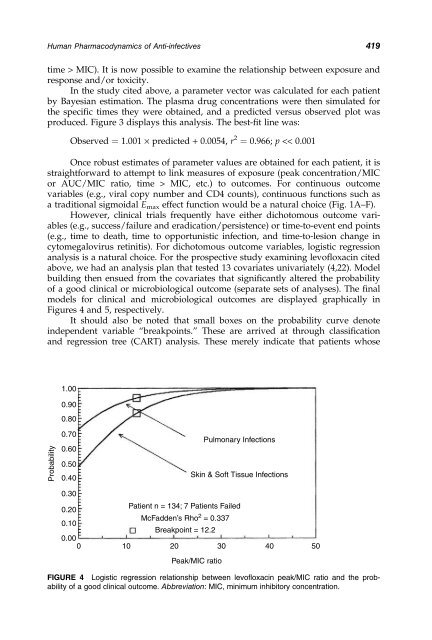
- Page 427: 418 DrusanoPopulation Pharmacokinet
- Page 431 and 432: 422 DrusanoASurvivor function Survi
- Page 433 and 434: 424 Drusano(B)1.00Levofloxacin 1000
- Page 435 and 436: 426 DrusanoAConcentration (mg/L)B99
- Page 437 and 438: 428 DrusanoTABLE 3 Paradigm for the
- Page 439 and 440: 430 Drusano20. Lindstrom M, Bates D
- Page 442 and 443: 21 Application of Pharmacokinetics
- Page 444 and 445: Application of Pharmacokinetics and
- Page 446 and 447: Application of Pharmacokinetics and
- Page 448 and 449: Application of Pharmacokinetics and
- Page 450 and 451: Application of Pharmacokinetics and
- Page 452 and 453: Application of Pharmacokinetics and
- Page 454 and 455: Application of Pharmacokinetics and
- Page 456 and 457: Application of Pharmacokinetics and
- Page 458 and 459: 22 Modeling of Toxicities Due to An
- Page 460 and 461: Modeling of Toxicities Due to Antib
- Page 462 and 463: Modeling of Toxicities Due to Antib
- Page 464 and 465: Modeling of Toxicities Due to Antib
- Page 466 and 467: Modeling of Toxicities Due to Antib
- Page 468 and 469: Modeling of Toxicities Due to Antib
- Page 470 and 471: Modeling of Toxicities Due to Antib
- Page 472 and 473: Section VIII: Pharmacodynamics and
- Page 474 and 475: Pharmacodynamics and Antibacterial
- Page 476 and 477: Pharmacodynamics and Antibacterial
- Page 478 and 479:
Pharmacodynamics and Antibacterial
- Page 480 and 481:
Pharmacodynamics and Antibacterial
- Page 482 and 483:
Pharmacodynamics and Antibacterial
- Page 484 and 485:
Pharmacodynamics and Antibacterial
- Page 486 and 487:
Pharmacodynamics and Antibacterial
- Page 488 and 489:
Pharmacodynamics and Antibacterial
- Page 490 and 491:
Pharmacodynamics and Antibacterial
- Page 492 and 493:
Pharmacodynamics and Antibacterial
- Page 494:
Pharmacodynamics and Antibacterial
- Page 497 and 498:
488 Coleman et al.incorporate consi
- Page 499 and 500:
490 Coleman et al.Evaluations are m
- Page 501 and 502:
492 Coleman et al.external validity
- Page 503 and 504:
494 Coleman et al.A pharmacoeconomi
- Page 505 and 506:
496 Coleman et al.with antibiotic A
- Page 507 and 508:
498 Coleman et al.TABLE 3 Reporting
- Page 509 and 510:
500 Coleman et al.specific populati
- Page 511 and 512:
502 Coleman et al.determine the rob
- Page 514 and 515:
IndexAbacavir, 279-284, 287-291, 42
- Page 516 and 517:
Index 507[Antibiotic pharmacodynami
- Page 518 and 519:
Index 509[Azoles]in vivo, concentra
- Page 520 and 521:
Index 511[Glycopeptide pharmacodyna
- Page 522 and 523:
Index 513Moxifloxacin, 53Mueller Hi
- Page 524 and 525:
Index 515[Quinolones]antimicrobial
- Page 526:
About the EditorsCHARLES H. NIGHTIN