56 Multimed Tools Appl (2011) 53:53–73region-based binary tree representation whose nodes correspond to the regions of the <strong>flower</strong><strong>image</strong> and links represent the relationships among regions was constructed to represent the<strong>flower</strong> <strong>image</strong> content. Experimental results showed that the structural representation of<strong>flower</strong> <strong>image</strong>s can produce a promising performance for <strong>flower</strong> <strong>image</strong> <strong>recognition</strong> in termsof generalization and noise robustness. In fact, the classification accuracy of the <strong>system</strong>depends on the selection of the feature values.Fukuda et al. [4] developed a <strong>flower</strong> <strong>image</strong> retrieval <strong>system</strong> by combining multipleclassifiers using fuzzy c-means clustering algorithm. In their <strong>system</strong>, <strong>flower</strong>s were classifiedinto three categories of different structures: gamopetalous <strong>flower</strong>s, many-petaled <strong>flower</strong>s, andsingle-petaled <strong>flower</strong>s. For each structure, a classifier with specific feature set wasconstructed. Fuzzy c-means clustering algorithm was then used to determine the degree ofmembership of each <strong>image</strong> to each structure. The overall similarity is a linear combinationof each individual similarity computed for each classifier with the weight being the degree ofmembership. The test database consists of 448 <strong>image</strong>s from 112 species with 4 <strong>image</strong>s perspecies. Experimental results have shown that the multiple-classifier approach outperformsany single-classifier approach. However, it is too rough a classification mechanism to classify<strong>flower</strong>s into three different categories according to the number of petals.Note that the previous researchers extracted color and shape features from the whole<strong>image</strong> region or <strong>flower</strong> boundary, without specifically treating the color and shapecharacteristics of the pistil/stamen area. Thus, an <strong>interactive</strong> <strong>flower</strong> <strong>image</strong> <strong>recognition</strong><strong>system</strong>, which extracts the color and shape features not only from the whole <strong>flower</strong> regionbut also from the pistil/stamen area, will be proposed to describe the characteristics of the<strong>flower</strong> <strong>image</strong>s more precisely. First, a <strong>flower</strong> segmentation method is developed to segmentthe <strong>flower</strong> boundary with as fewer user interactions as possible. Further, a simplenormalization procedure is employed to make the extracted features more robust to shapedeformations, including the number of petals, the relative positions of petals, the poses ofpetals taken from different directions, <strong>flower</strong> sizes, etc. The rest of this paper is organized asfollows. Section 2 describes the proposed <strong>flower</strong> <strong>image</strong> <strong>recognition</strong> <strong>system</strong>. Someexperimental results will be given in Section 3. Conclusions will be given in Section 4.2 The proposed <strong>flower</strong> <strong>image</strong> <strong>recognition</strong> <strong>system</strong>The proposed <strong>flower</strong> <strong>image</strong> <strong>recognition</strong> <strong>system</strong> consists of three major phases: <strong>flower</strong>region segmentation, feature extraction, and <strong>recognition</strong>, as shown in Fig. 1. In thesegmentation phase, the proposed <strong>system</strong> provides an interface allowing a user to draw arectangular window which circumscribes the <strong>flower</strong> region. A segmentation algorithmsimilar to that proposed by Saitoh et al. [13] is then developed to extract the <strong>flower</strong> regionwithin the rectangular window. In the feature extraction phase, the shape and color featuresof the whole <strong>flower</strong> region as well as the pistil/stamen area are extracted to measure thesimilarity between two <strong>flower</strong> <strong>image</strong>s. In the <strong>recognition</strong> phase, the <strong>flower</strong> <strong>image</strong> in thedatabase that is most similar to the input <strong>image</strong> will be found using the extractedfeatures.Fig. 1 Flow diagram of the proposed <strong>flower</strong> <strong>image</strong> <strong>recognition</strong> <strong>system</strong>
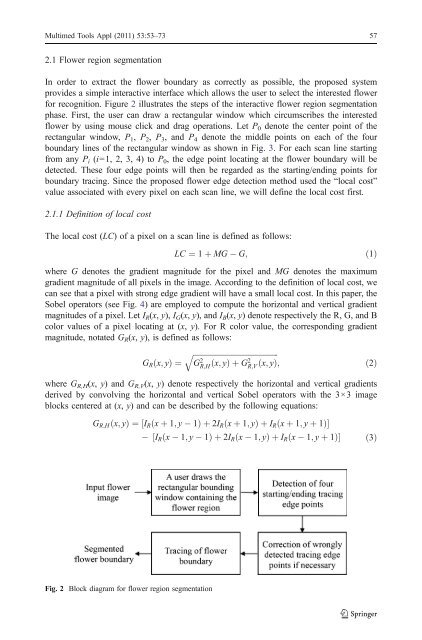
Multimed Tools Appl (2011) 53:53–73 572.1 Flower region segmentationIn order to extract the <strong>flower</strong> boundary as correctly as possible, the proposed <strong>system</strong>provides a simple <strong>interactive</strong> interface which allows the user to select the interested <strong>flower</strong>for <strong>recognition</strong>. Figure 2 illustrates the steps of the <strong>interactive</strong> <strong>flower</strong> region segmentationphase. First, the user can draw a rectangular window which circumscribes the interested<strong>flower</strong> by using mouse click and drag operations. Let P 0 denote the center point of therectangular window, P 1 , P 2 , P 3 , and P 4 denote the middle points on each of the fourboundary lines of the rectangular window as shown in Fig. 3. For each scan line startingfrom any P i (i=1,2,3,4)toP 0 , the edge point locating at the <strong>flower</strong> boundary will bedetected. These four edge points will then be regarded as the starting/ending points forboundary tracing. Since the proposed <strong>flower</strong> edge detection method used the “local cost”value associated with every pixel on each scan line, we will define the local cost first.2.1.1 Definition of local costThe local cost (LC) of a pixel on a scan line is defined as follows:LC ¼ 1 þ MG G; ð1Þwhere G denotes the gradient magnitude for the pixel and MG denotes the maximumgradient magnitude of all pixels in the <strong>image</strong>. According to the definition of local cost, wecan see that a pixel with strong edge gradient will have a small local cost. In this paper, theSobel operators (see Fig. 4) are employed to compute the horizontal and vertical gradientmagnitudes of a pixel. Let I R (x, y), I G (x, y), and I B (x, y) denote respectively the R, G, and Bcolor values of a pixel locating at (x, y). For R color value, the corresponding gradientmagnitude, notated G R (x, y), is defined as follows:G R ðx; yÞ ¼qffiffiffiffiffiffiffiffiffiffiffiffiffiffiffiffiffiffiffiffiffiffiffiffiffiffiffiffiffiffiffiffiffiffiffiffiffiffiffiffiffiffiffiffiG 2 R;H ðx;yÞþG2R;V ðx;yÞ; ð2Þwhere G R,H (x, y) and G R,V (x, y) denote respectively the horizontal and vertical gradientsderived by convolving the horizontal and vertical Sobel operators with the 3×3 <strong>image</strong>blocks centered at (x, y) and can be described by the following equations:G R;H ðx; yÞ ¼ ½I R ðx þ 1; y 1Þþ2I R ðx þ 1; yÞþI R ðx þ 1; y þ 1ÞŠ½I R ðx 1; y 1Þþ2I R ðx 1; yÞþI R ðx 1; y þ 1ÞŠ ð3ÞFig. 2 Block diagram for <strong>flower</strong> region segmentation