Journal of Zoology - CERU - University of Pretoria
Journal of Zoology - CERU - University of Pretoria
Journal of Zoology - CERU - University of Pretoria

Create successful ePaper yourself
Turn your PDF publications into a flip-book with our unique Google optimized e-Paper software.
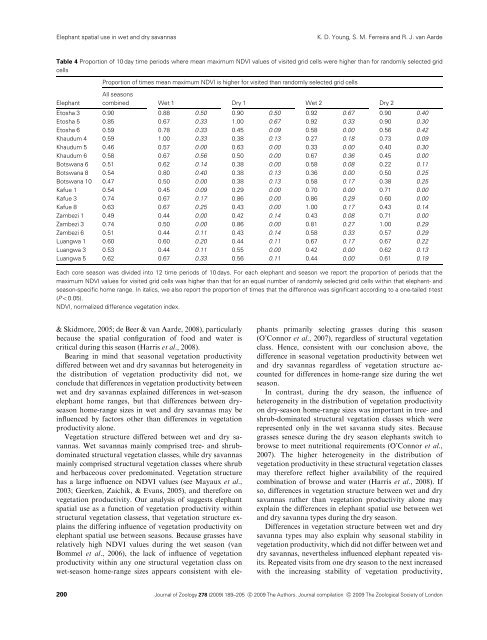
Elephant spatial use in wet and dry savannasK. D. Young, S. M. Ferreira and R. J. van AardeTable 4 Proportion <strong>of</strong> 10 day time periods where mean maximum NDVI values <strong>of</strong> visited grid cells were higher than for randomly selected gridcellsProportion <strong>of</strong> times mean maximum NDVI is higher for visited than randomly selected grid cellsAll seasonsElephant combined Wet 1 Dry 1 Wet 2 Dry 2Etosha 3 0.90 0.88 0.50 0.90 0.50 0.92 0.67 0.90 0.40Etosha 5 0.85 0.67 0.33 1.00 0.67 0.92 0.33 0.90 0.30Etosha 6 0.59 0.78 0.33 0.45 0.09 0.58 0.00 0.56 0.42Khaudum 4 0.59 1.00 0.33 0.38 0.13 0.27 0.18 0.73 0.09Khaudum 5 0.46 0.57 0.00 0.63 0.00 0.33 0.00 0.40 0.30Khaudum 6 0.58 0.67 0.56 0.50 0.00 0.67 0.36 0.45 0.00Botswana 6 0.51 0.62 0.14 0.38 0.00 0.58 0.08 0.22 0.11Botswana 8 0.54 0.80 0.40 0.38 0.13 0.36 0.00 0.50 0.25Botswana 10 0.47 0.50 0.00 0.38 0.13 0.58 0.17 0.38 0.25Kafue 1 0.54 0.45 0.09 0.29 0.00 0.70 0.00 0.71 0.00Kafue 3 0.74 0.67 0.17 0.86 0.00 0.86 0.29 0.60 0.00Kafue 8 0.63 0.67 0.25 0.43 0.00 1.00 0.17 0.43 0.14Zambezi 1 0.49 0.44 0.00 0.42 0.14 0.43 0.08 0.71 0.00Zambezi 3 0.74 0.50 0.00 0.86 0.00 0.81 0.27 1.00 0.29Zambezi 6 0.51 0.44 0.11 0.43 0.14 0.58 0.33 0.57 0.29Luangwa 1 0.60 0.60 0.20 0.44 0.11 0.67 0.17 0.67 0.22Luangwa 3 0.53 0.44 0.11 0.55 0.00 0.42 0.00 0.62 0.13Luangwa 5 0.62 0.67 0.33 0.56 0.11 0.44 0.00 0.61 0.19Each core season was divided into 12 time periods <strong>of</strong> 10 days. For each elephant and season we report the proportion <strong>of</strong> periods that themaximum NDVI values for visited grid cells was higher than that for an equal number <strong>of</strong> randomly selected grid cells within that elephant- andseason-specific home range. In italics, we also report the proportion <strong>of</strong> times that the difference was significant according to a one-tailed t-test(Po0.05).NDVI, normalized difference vegetation index.& Skidmore, 2005; de Beer & van Aarde, 2008), particularlybecause the spatial configuration <strong>of</strong> food and water iscritical during this season (Harris et al., 2008).Bearing in mind that seasonal vegetation productivitydiffered between wet and dry savannas but heterogeneity inthe distribution <strong>of</strong> vegetation productivity did not, weconclude that differences in vegetation productivity betweenwet and dry savannas explained differences in wet-seasonelephant home ranges, but that differences between dryseasonhome-range sizes in wet and dry savannas may beinfluenced by factors other than differences in vegetationproductivity alone.Vegetation structure differed between wet and dry savannas.Wet savannas mainly comprised tree- and shrubdominatedstructural vegetation classes, while dry savannasmainly comprised structural vegetation classes where shruband herbaceous cover predominated. Vegetation structurehas a large influence on NDVI values (see Mayaux et al.,2003; Geerken, Zaichik, & Evans, 2005), and therefore onvegetation productivity. Our analysis <strong>of</strong> suggests elephantspatial use as a function <strong>of</strong> vegetation productivity withinstructural vegetation classess, that vegetation structure explainsthe differing influence <strong>of</strong> vegetation productivity onelephant spatial use between seasons. Because grasses haverelatively high NDVI values during the wet season (vanBommel et al., 2006), the lack <strong>of</strong> influence <strong>of</strong> vegetationproductivity within any one structural vegetation class onwet-season home-range sizes appears consistent with elephantsprimarily selecting grasses during this season(O’Connor et al., 2007), regardless <strong>of</strong> structural vegetationclass. Hence, consistent with our conclusion above, thedifference in seasonal vegetation productivity between wetand dry savannas regardless <strong>of</strong> vegetation structure accountedfor differences in home-range size during the wetseason.In contrast, during the dry season, the influence <strong>of</strong>heterogeneity in the distribution <strong>of</strong> vegetation productivityon dry-season home-range sizes was important in tree- andshrub-dominated structural vegetation classes which wererepresented only in the wet savanna study sites. Becausegrasses senesce during the dry season elephants switch tobrowse to meet nutritional requirements (O’Connor et al.,2007). The higher heterogeneity in the distribution <strong>of</strong>vegetation productivity in these structural vegetation classesmay therefore reflect higher availability <strong>of</strong> the requiredcombination <strong>of</strong> browse and water (Harris et al., 2008). Ifso, differences in vegetation structure between wet and drysavannas rather than vegetation productivity alone mayexplain the differences in elephant spatial use between wetand dry savanna types during the dry season.Differences in vegetation structure between wet and drysavanna types may also explain why seasonal stability invegetation productivity, which did not differ between wet anddry savannas, nevertheless influenced elephant repeated visits.Repeated visits from one dry season to the next increasedwith the increasing stability <strong>of</strong> vegetation productivity,200<strong>Journal</strong> <strong>of</strong> <strong>Zoology</strong> 278 (2009) 189–205 c 2009 The Authors. <strong>Journal</strong> compilation c 2009 The Zoological Society <strong>of</strong> London