Journal of Zoology - CERU - University of Pretoria
Journal of Zoology - CERU - University of Pretoria
Journal of Zoology - CERU - University of Pretoria

Create successful ePaper yourself
Turn your PDF publications into a flip-book with our unique Google optimized e-Paper software.
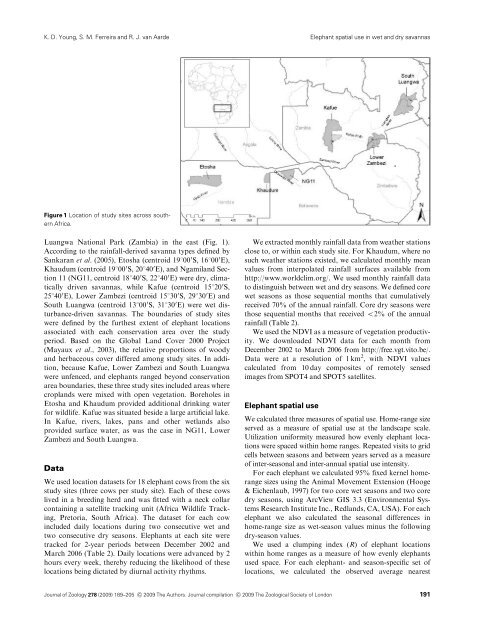
K. D. Young, S. M. Ferreira and R. J. van AardeElephant spatial use in wet and dry savannasFigure 1 Location <strong>of</strong> study sites across southernAfrica.Luangwa National Park (Zambia) in the east (Fig. 1).According to the rainfall-derived savanna types defined bySankaran et al. (2005), Etosha (centroid 19100 0 S, 16100 0 E),Khaudum (centroid 19100 0 S, 20140 0 E), and Ngamiland Section11 (NG11, centroid 18140 0 S, 22140 0 E) were dry, climaticallydriven savannas, while Kafue (centroid 15120 0 S,25140 0 E), Lower Zambezi (centroid 15130 0 S, 29130 0 E) andSouth Luangwa (centroid 13100 0 S, 31130 0 E) were wet disturbance-drivensavannas. The boundaries <strong>of</strong> study siteswere defined by the furthest extent <strong>of</strong> elephant locationsassociated with each conservation area over the studyperiod. Based on the Global Land Cover 2000 Project(Mayaux et al., 2003), the relative proportions <strong>of</strong> woodyand herbaceous cover differed among study sites. In addition,because Kafue, Lower Zambezi and South Luangwawere unfenced, and elephants ranged beyond conservationarea boundaries, these three study sites included areas wherecroplands were mixed with open vegetation. Boreholes inEtosha and Khaudum provided additional drinking waterfor wildlife. Kafue was situated beside a large artificial lake.In Kafue, rivers, lakes, pans and other wetlands alsoprovided surface water, as was the case in NG11, LowerZambezi and South Luangwa.DataWe used location datasets for 18 elephant cows from the sixstudy sites (three cows per study site). Each <strong>of</strong> these cowslived in a breeding herd and was fitted with a neck collarcontaining a satellite tracking unit (Africa Wildlife Tracking,<strong>Pretoria</strong>, South Africa). The dataset for each cowincluded daily locations during two consecutive wet andtwo consecutive dry seasons. Elephants at each site weretracked for 2-year periods between December 2002 andMarch 2006 (Table 2). Daily locations were advanced by 2hours every week, thereby reducing the likelihood <strong>of</strong> theselocations being dictated by diurnal activity rhythms.We extracted monthly rainfall data from weather stationsclose to, or within each study site. For Khaudum, where nosuch weather stations existed, we calculated monthly meanvalues from interpolated rainfall surfaces available fromhttp://www.worldclim.org/. We used monthly rainfall datato distinguish between wet and dry seasons. We defined corewet seasons as those sequential months that cumulativelyreceived 70% <strong>of</strong> the annual rainfall. Core dry seasons werethose sequential months that received o2% <strong>of</strong> the annualrainfall (Table 2).We used the NDVI as a measure <strong>of</strong> vegetation productivity.We downloaded NDVI data for each month fromDecember 2002 to March 2006 from http://free.vgt.vito.be/.Data were at a resolution <strong>of</strong> 1 km 2 , with NDVI valuescalculated from 10 day composites <strong>of</strong> remotely sensedimages from SPOT4 and SPOT5 satellites.Elephant spatial useWe calculated three measures <strong>of</strong> spatial use. Home-range sizeserved as a measure <strong>of</strong> spatial use at the landscape scale.Utilization uniformity measured how evenly elephant locationswere spaced within home ranges. Repeated visits to gridcells between seasons and between years served as a measure<strong>of</strong> inter-seasonal and inter-annual spatial use intensity.For each elephant we calculated 95% fixed kernel homerangesizes using the Animal Movement Extension (Hooge& Eichenlaub, 1997) for two core wet seasons and two coredry seasons, using ArcView GIS 3.3 (Environmental SystemsResearch Institute Inc., Redlands, CA, USA). For eachelephant we also calculated the seasonal differences inhome-range size as wet-season values minus the followingdry-season values.We used a clumping index (R) <strong>of</strong> elephant locationswithin home ranges as a measure <strong>of</strong> how evenly elephantsused space. For each elephant- and season-specific set <strong>of</strong>locations, we calculated the observed average nearest<strong>Journal</strong> <strong>of</strong> <strong>Zoology</strong> 278 (2009) 189–205 c 2009 The Authors. <strong>Journal</strong> compilation c 2009 The Zoological Society <strong>of</strong> London 191