Journal of Zoology - CERU - University of Pretoria
Journal of Zoology - CERU - University of Pretoria
Journal of Zoology - CERU - University of Pretoria
Create successful ePaper yourself
Turn your PDF publications into a flip-book with our unique Google optimized e-Paper software.
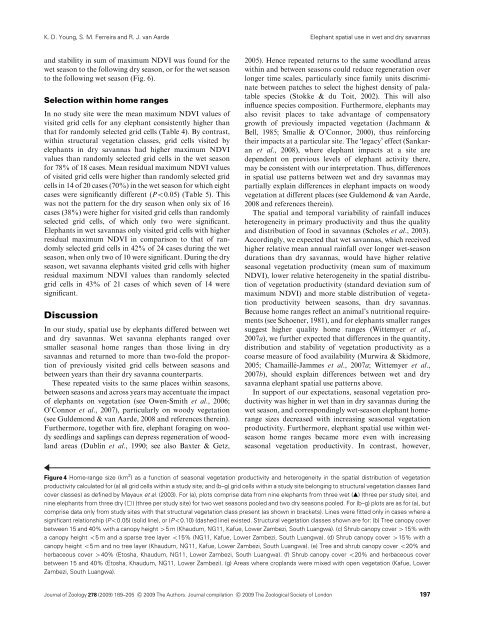
K. D. Young, S. M. Ferreira and R. J. van AardeElephant spatial use in wet and dry savannasand stability in sum <strong>of</strong> maximum NDVI was found for thewet season to the following dry season, or for the wet seasonto the following wet season (Fig. 6).Selection within home rangesIn no study site were the mean maximum NDVI values <strong>of</strong>visited grid cells for any elephant consistently higher thanthat for randomly selected grid cells (Table 4). By contrast,within structural vegetation classes, grid cells visited byelephants in dry savannas had higher maximum NDVIvalues than randomly selected grid cells in the wet seasonfor 78% <strong>of</strong> 18 cases. Mean residual maximum NDVI values<strong>of</strong> visited grid cells were higher than randomly selected gridcells in 14 <strong>of</strong> 20 cases (70%) in the wet season for which eightcases were significantly different (Po0.05) (Table 5). Thiswas not the pattern for the dry season when only six <strong>of</strong> 16cases (38%) were higher for visited grid cells than randomlyselected grid cells, <strong>of</strong> which only two were significant.Elephants in wet savannas only visited grid cells with higherresidual maximum NDVI in comparison to that <strong>of</strong> randomlyselected grid cells in 42% <strong>of</strong> 24 cases during the wetseason, when only two <strong>of</strong> 10 were significant. During the dryseason, wet savanna elephants visited grid cells with higherresidual maximum NDVI values than randomly selectedgrid cells in 43% <strong>of</strong> 21 cases <strong>of</strong> which seven <strong>of</strong> 14 weresignificant.DiscussionIn our study, spatial use by elephants differed between wetand dry savannas. Wet savanna elephants ranged oversmaller seasonal home ranges than those living in drysavannas and returned to more than two-fold the proportion<strong>of</strong> previously visited grid cells between seasons andbetween years than their dry savanna counterparts.These repeated visits to the same places within seasons,between seasons and across years may accentuate the impact<strong>of</strong> elephants on vegetation (see Owen-Smith et al., 2006;O’Connor et al., 2007), particularly on woody vegetation(see Guldemond & van Aarde, 2008 and references therein).Furthermore, together with fire, elephant foraging on woodyseedlings and saplings can depress regeneration <strong>of</strong> woodlandareas (Dublin et al., 1990; see also Baxter & Getz,2005). Hence repeated returns to the same woodland areaswithin and between seasons could reduce regeneration overlonger time scales, particularly since family units discriminatebetween patches to select the highest density <strong>of</strong> palatablespecies (Stokke & du Toit, 2002). This will alsoinfluence species composition. Furthermore, elephants mayalso revisit places to take advantage <strong>of</strong> compensatorygrowth <strong>of</strong> previously impacted vegetation (Jachmann &Bell, 1985; Smallie & O’Connor, 2000), thus reinforcingtheir impacts at a particular site. The ‘legacy’ effect (Sankaranet al., 2008), where elephant impacts at a site aredependent on previous levels <strong>of</strong> elephant activity there,may be consistent with our interpretation. Thus, differencesin spatial use patterns between wet and dry savannas maypartially explain differences in elephant impacts on woodyvegetation at different places (see Guldemond & van Aarde,2008 and references therein).The spatial and temporal variability <strong>of</strong> rainfall inducesheterogeneity in primary productivity and thus the qualityand distribution <strong>of</strong> food in savannas (Scholes et al., 2003).Accordingly, we expected that wet savannas, which receivedhigher relative mean annual rainfall over longer wet-seasondurations than dry savannas, would have higher relativeseasonal vegetation productivity (mean sum <strong>of</strong> maximumNDVI), lower relative heterogeneity in the spatial distribution<strong>of</strong> vegetation productivity (standard deviation sum <strong>of</strong>maximum NDVI) and more stable distribution <strong>of</strong> vegetationproductivity between seasons, than dry savannas.Because home ranges reflect an animal’s nutritional requirements(see Schoener, 1981), and for elephants smaller rangessuggest higher quality home ranges (Wittemyer et al.,2007a), we further expected that differences in the quantity,distribution and stability <strong>of</strong> vegetation productivity as acoarse measure <strong>of</strong> food availability (Murwira & Skidmore,2005; Chamaille´-Jammes et al., 2007a; Wittemyer et al.,2007b), should explain differences between wet and drysavanna elephant spatial use patterns above.In support <strong>of</strong> our expectations, seasonal vegetation productivitywas higher in wet than in dry savannas during thewet season, and correspondingly wet-season elephant homerangesizes decreased with increasing seasonal vegetationproductivity. Furthermore, elephant spatial use within wetseasonhome ranges became more even with increasingseasonal vegetation productivity. In contrast, however,Figure 4 Home-range size (km 2 ) as a function <strong>of</strong> seasonal vegetation productivity and heterogeneity in the spatial distribution <strong>of</strong> vegetationproductivity calculated for (a) all grid cells within a study site; and (b–g) grid cells within a study site belonging to structural vegetation classes (landcover classes) as defined by Mayaux et al. (2003). For (a), plots comprise data from nine elephants from three wet (m) (three per study site), andnine elephants from three dry (&) (three per study site) for two wet seasons pooled and two dry seasons pooled. For (b–g) plots are as for (a), butcomprise data only from study sites with that structural vegetation class present (as shown in brackets). Lines were fitted only in cases where asignificant relationship (Po0.05) (solid line), or (Po0.10) (dashed line) existed. Structural vegetation classes shown are for: (b) Tree canopy coverbetween 15 and 40% with a canopy height 45 m (Khaudum, NG11, Kafue, Lower Zambezi, South Luangwa). (c) Shrub canopy cover 415% witha canopy height o5 m and a sparse tree layer o15% (NG11, Kafue, Lower Zambezi, South Luangwa). (d) Shrub canopy cover 415% with acanopy height o5 m and no tree layer (Khaudum, NG11, Kafue, Lower Zambezi, South Luangwa). (e) Tree and shrub canopy cover o20% andherbaceous cover 440% (Etosha, Khaudum, NG11, Lower Zambezi, South Luangwa). (f) Shrub canopy cover o20% and herbaceous coverbetween 15 and 40% (Etosha, Khaudum, NG11, Lower Zambezi). (g) Areas where croplands were mixed with open vegetation (Kafue, LowerZambezi, South Luangwa).<strong>Journal</strong> <strong>of</strong> <strong>Zoology</strong> 278 (2009) 189–205 c 2009 The Authors. <strong>Journal</strong> compilation c 2009 The Zoological Society <strong>of</strong> London 197


