- Page 1 and 2:
Applied Bayesian ModellingApplied B
- Page 3 and 4:
Applied Bayesian ModellingPETER CON
- Page 5 and 6:
ContentsPrefacexiChapter 1The Basis
- Page 7 and 8:
CONTENTSvii5.3.2 INAR models for co
- Page 9 and 10:
CONTENTSix9.4.2 Gamma process prior
- Page 11 and 12:
xiiPREFACEoptions (one of the benef
- Page 13 and 14: 2 BAYESIAN MODEL ESTIMATION VIA REP
- Page 15 and 16: 4 BAYESIAN MODEL ESTIMATION VIA REP
- Page 17 and 18: 6 BAYESIAN MODEL ESTIMATION VIA REP
- Page 19 and 20: 8 BAYESIAN MODEL ESTIMATION VIA REP
- Page 21 and 22: 10 BAYESIAN MODEL ESTIMATION VIA RE
- Page 23 and 24: 12 BAYESIAN MODEL ESTIMATION VIA RE
- Page 25 and 26: 14 BAYESIAN MODEL ESTIMATION VIA RE
- Page 27 and 28: 16 BAYESIAN MODEL ESTIMATION VIA RE
- Page 29 and 30: 18 BAYESIAN MODEL ESTIMATION VIA RE
- Page 31 and 32: 20 BAYESIAN MODEL ESTIMATION VIA RE
- Page 33 and 34: 22 BAYESIAN MODEL ESTIMATION VIA RE
- Page 35 and 36: 24 BAYESIAN MODEL ESTIMATION VIA RE
- Page 37 and 38: 26 BAYESIAN MODEL ESTIMATION VIA RE
- Page 39 and 40: 28 BAYESIAN MODEL ESTIMATION VIA RE
- Page 41 and 42: 30 BAYESIAN MODEL ESTIMATION VIA RE
- Page 43 and 44: 32 HIERARCHICAL MIXTURE MODELSprinc
- Page 45 and 46: 34 HIERARCHICAL MIXTURE MODELS…P(
- Page 47 and 48: 36 HIERARCHICAL MIXTURE MODELS^m( y
- Page 49 and 50: 38 HIERARCHICAL MIXTURE MODELSent e
- Page 51 and 52: 40 HIERARCHICAL MIXTURE MODELSratio
- Page 53 and 54: 42 HIERARCHICAL MIXTURE MODELSence
- Page 55 and 56: 44 HIERARCHICAL MIXTURE MODELS^t 2
- Page 57 and 58: 46 HIERARCHICAL MIXTURE MODELSTable
- Page 59 and 60: 48 HIERARCHICAL MIXTURE MODELSTable
- Page 61 and 62: 50 HIERARCHICAL MIXTURE MODELSwith
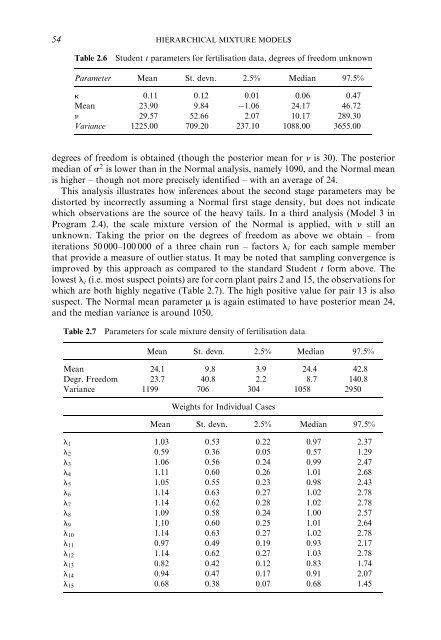
- Page 63: 52 HIERARCHICAL MIXTURE MODELSWhile
- Page 67 and 68: 56 HIERARCHICAL MIXTURE MODELSY ij
- Page 69 and 70: 58 HIERARCHICAL MIXTURE MODELSA thr
- Page 71 and 72: 60 HIERARCHICAL MIXTURE MODELSremai
- Page 73 and 74: 62 HIERARCHICAL MIXTURE MODELSin te
- Page 75 and 76: 64 HIERARCHICAL MIXTURE MODELSwheth
- Page 77 and 78: 66 HIERARCHICAL MIXTURE MODELSUsing
- Page 79 and 80: 68 HIERARCHICAL MIXTURE MODELS2.5.1
- Page 81 and 82: 70 HIERARCHICAL MIXTURE MODELSThe o
- Page 83 and 84: 72 HIERARCHICAL MIXTURE MODELSalone
- Page 85 and 86: 74 HIERARCHICAL MIXTURE MODELSTable
- Page 87 and 88: 76 HIERARCHICAL MIXTURE MODELSDe Fi
- Page 89 and 90: 78 HIERARCHICAL MIXTURE MODELSEXERC
- Page 91 and 92: 80 REGRESSION MODELSmethodology for
- Page 93 and 94: 82 REGRESSION MODELS3.1.3 Regressio
- Page 95 and 96: 84 REGRESSION MODELSscaling factor
- Page 97 and 98: 86 REGRESSION MODELSThen in a predi
- Page 99 and 100: 88 REGRESSION MODELSgroup out at a
- Page 101 and 102: 90 REGRESSION MODELSTable 3.1 Probi
- Page 103 and 104: 92 REGRESSION MODELSBetter models w
- Page 105 and 106: 94 REGRESSION MODELSmodel enhances
- Page 107 and 108: 96 REGRESSION MODELSThe last 15 000
- Page 109 and 110: 98 REGRESSION MODELSOmitting consta
- Page 111 and 112: 100 REGRESSION MODELS(3.13) would i
- Page 113 and 114: 102 REGRESSION MODELSorF 1 (g ij )
- Page 115 and 116:
104 REGRESSION MODELSa birth increa
- Page 117 and 118:
106 REGRESSION MODELSThe coefficien
- Page 119 and 120:
108 REGRESSION MODELSbut the analys
- Page 121 and 122:
110 REGRESSION MODELSThe logit link
- Page 123 and 124:
112 REGRESSION MODELSseparation, an
- Page 125 and 126:
114 REGRESSION MODELS4.543.53Precis
- Page 127 and 128:
116 REGRESSION MODELSand a second o
- Page 129 and 130:
118 REGRESSION MODELSTable 3.14Kyph
- Page 131 and 132:
120 REGRESSION MODELSstandard devia
- Page 133 and 134:
122 REGRESSION MODELSTable 3.15Data
- Page 135 and 136:
124 REGRESSION MODELSTable 3.20 Leu
- Page 137 and 138:
126 REGRESSION MODELSNote that eith
- Page 139 and 140:
128 REGRESSION MODELSTable 2 (conti
- Page 141 and 142:
130 REGRESSION MODELSDellaportas, P
- Page 143 and 144:
132 REGRESSION MODELSWinkelmann, R.
- Page 145 and 146:
Analysis of Multi-level DataApplied
- Page 147 and 148:
MULTI-LEVEL MODELS: UNIVARIATE CONT
- Page 149 and 150:
MULTI-LEVEL MODELS: UNIVARIATE CONT
- Page 151 and 152:
MULTI-LEVEL MODELS: UNIVARIATE CONT
- Page 153 and 154:
MULTI-LEVEL MODELS: UNIVARIATE CONT
- Page 155 and 156:
MODELLING HETEROSCEDASTICITY 145pos
- Page 157 and 158:
where W ij ˆ X ij b is the total l
- Page 159 and 160:
MODELLING HETEROSCEDASTICITY 149var
- Page 161 and 162:
ROBUSTNESS IN MULTI-LEVEL MODELLING
- Page 163 and 164:
ROBUSTNESS IN MULTI-LEVEL MODELLING
- Page 165 and 166:
ROBUSTNESS IN MULTI-LEVEL MODELLING
- Page 167 and 168:
MULTI-LEVEL DATA ON MULTIVARIATE IN
- Page 169 and 170:
MULTI-LEVEL DATA ON MULTIVARIATE IN
- Page 171 and 172:
MULTI-LEVEL DATA ON MULTIVARIATE IN
- Page 173 and 174:
SMALL DOMAIN ESTIMATION 163knowledg
- Page 175 and 176:
X X X n jky ijk = X XjeJ 0 keK 0 i
- Page 177 and 178:
REVIEW 167Table 4.10(continued)Okla
- Page 179 and 180:
EXERCISES 169Hulting, F. and Harvil
- Page 181 and 182:
Models for Time SeriesApplied Bayes
- Page 183 and 184:
AUTOREGRESSIVE AND MOVING AVERAGE M
- Page 185 and 186:
AUTOREGRESSIVE AND MOVING AVERAGE M
- Page 187 and 188:
AUTOREGRESSIVE AND MOVING AVERAGE M
- Page 189 and 190:
AUTOREGRESSIVE AND MOVING AVERAGE M
- Page 191 and 192:
AUTOREGRESSIVE AND MOVING AVERAGE M
- Page 193 and 194:
AUTOREGRESSIVE AND MOVING AVERAGE M
- Page 195 and 196:
AUTOREGRESSIVE AND MOVING AVERAGE M
- Page 197 and 198:
AUTOREGRESSIVE AND MOVING AVERAGE M
- Page 199 and 200:
AUTOREGRESSIVE AND MOVING AVERAGE M
- Page 201 and 202:
DISCRETE OUTCOMES 1911.2Unemploymen
- Page 203 and 204:
DISCRETE OUTCOMES 193series to y t
- Page 205 and 206:
DISCRETE OUTCOMES 195One might also
- Page 207 and 208:
DISCRETE OUTCOMES 197each model, th
- Page 209 and 210:
DISCRETE OUTCOMES 199We consider a
- Page 211 and 212:
ERROR CORRECTION MODELS 201disequil
- Page 213 and 214:
DYNAMIC LINEAR MODELS AND TIME VARY
- Page 215 and 216:
DYNAMIC LINEAR MODELS AND TIME VARY
- Page 217 and 218:
DYNAMIC LINEAR MODELS AND TIME VARY
- Page 219 and 220:
DYNAMIC LINEAR MODELS AND TIME VARY
- Page 221 and 222:
where e t ˆ y t bx t . If y t has
- Page 223 and 224:
STOCHASTIC VARIANCES AND STOCHASTIC
- Page 225 and 226:
MODELLING STRUCTURAL SHIFTS 2153.53
- Page 227 and 228:
MODELLING STRUCTURAL SHIFTS 217Lubr
- Page 229 and 230:
MODELLING STRUCTURAL SHIFTS 219and
- Page 231 and 232:
REVIEW 221with the mean of t 1 esti
- Page 233 and 234:
REFERENCES 223Christensen, R. (1989
- Page 235 and 236:
EXERCISES 225Tanizaki, H. and Maria
- Page 237 and 238:
228 ANALYSIS OF PANEL DATAwhere b i
- Page 239 and 240:
230 ANALYSIS OF PANEL DATAZ it ˆ b
- Page 241 and 242:
232 ANALYSIS OF PANEL DATAwhere e i
- Page 243 and 244:
234 ANALYSIS OF PANEL DATA6.2.2 The
- Page 245 and 246:
236 ANALYSIS OF PANEL DATAregressio
- Page 247 and 248:
238 ANALYSIS OF PANEL DATApost-trea
- Page 249 and 250:
240 ANALYSIS OF PANEL DATAwhere the
- Page 251 and 252:
242 ANALYSIS OF PANEL DATAclinics),
- Page 253 and 254:
244 ANALYSIS OF PANEL DATApermanent
- Page 255 and 256:
246 ANALYSIS OF PANEL DATAIf, howev
- Page 257 and 258:
248 ANALYSIS OF PANEL DATAwhere k t
- Page 259 and 260:
250 ANALYSIS OF PANEL DATATable 6.7
- Page 261 and 262:
252 ANALYSIS OF PANEL DATAWe obtain
- Page 263 and 264:
254 ANALYSIS OF PANEL DATAmodelling
- Page 265 and 266:
256 ANALYSIS OF PANEL DATATo furthe
- Page 267 and 268:
258 ANALYSIS OF PANEL DATAAs a part
- Page 269 and 270:
260 ANALYSIS OF PANEL DATATable 6.1
- Page 271 and 272:
262 ANALYSIS OF PANEL DATAcrude dea
- Page 273 and 274:
264 ANALYSIS OF PANEL DATAThese are
- Page 275 and 276:
266 ANALYSIS OF PANEL DATAstands at
- Page 277 and 278:
268 ANALYSIS OF PANEL DATAThe place
- Page 279 and 280:
270 ANALYSIS OF PANEL DATADavies, R
- Page 281 and 282:
272 ANALYSIS OF PANEL DATAthe lag i
- Page 283 and 284:
274 MODELS FOR SPATIAL OUTCOMESinve
- Page 285 and 286:
276 MODELS FOR SPATIAL OUTCOMESfreq
- Page 287 and 288:
278 MODELS FOR SPATIAL OUTCOMESspat
- Page 289 and 290:
280 MODELS FOR SPATIAL OUTCOMES" #p
- Page 291 and 292:
282 MODELS FOR SPATIAL OUTCOMES7.3.
- Page 293 and 294:
284 MODELS FOR SPATIAL OUTCOMESTabl
- Page 295 and 296:
286 MODELS FOR SPATIAL OUTCOMESof t
- Page 297 and 298:
288 MODELS FOR SPATIAL OUTCOMESFina
- Page 299 and 300:
290 MODELS FOR SPATIAL OUTCOMESand
- Page 301 and 302:
292 MODELS FOR SPATIAL OUTCOMESmay,
- Page 303 and 304:
294 MODELS FOR SPATIAL OUTCOMESe i
- Page 305 and 306:
296 MODELS FOR SPATIAL OUTCOMEScons
- Page 307 and 308:
298 MODELS FOR SPATIAL OUTCOMESIn t
- Page 309 and 310:
300 MODELS FOR SPATIAL OUTCOMESfor
- Page 311 and 312:
302 MODELS FOR SPATIAL OUTCOMESHowe
- Page 313 and 314:
304 MODELS FOR SPATIAL OUTCOMESTabl
- Page 315 and 316:
306 MODELS FOR SPATIAL OUTCOMES7.6.
- Page 317 and 318:
308 MODELS FOR SPATIAL OUTCOMESInfo
- Page 319 and 320:
310 MODELS FOR SPATIAL OUTCOMESInve
- Page 321 and 322:
312 MODELS FOR SPATIAL OUTCOMESIf a
- Page 323 and 324:
314 MODELS FOR SPATIAL OUTCOMESZ it
- Page 325 and 326:
316 MODELS FOR SPATIAL OUTCOMESages
- Page 327 and 328:
318 MODELS FOR SPATIAL OUTCOMESCase
- Page 329 and 330:
320 MODELS FOR SPATIAL OUTCOMESOliv
- Page 331 and 332:
322 MODELS FOR SPATIAL OUTCOMES10.
- Page 333 and 334:
324 STRUCTURAL EQUATION AND LATENT
- Page 335 and 336:
326 STRUCTURAL EQUATION AND LATENT
- Page 337 and 338:
328 STRUCTURAL EQUATION AND LATENT
- Page 339 and 340:
330 STRUCTURAL EQUATION AND LATENT
- Page 341 and 342:
332 STRUCTURAL EQUATION AND LATENT
- Page 343 and 344:
334 STRUCTURAL EQUATION AND LATENT
- Page 345 and 346:
336 STRUCTURAL EQUATION AND LATENT
- Page 347 and 348:
338 STRUCTURAL EQUATION AND LATENT
- Page 349 and 350:
340 STRUCTURAL EQUATION AND LATENT
- Page 351 and 352:
342 STRUCTURAL EQUATION AND LATENT
- Page 353 and 354:
344 STRUCTURAL EQUATION AND LATENT
- Page 355 and 356:
346 STRUCTURAL EQUATION AND LATENT
- Page 357 and 358:
348 STRUCTURAL EQUATION AND LATENT
- Page 359 and 360:
350 STRUCTURAL EQUATION AND LATENT
- Page 361 and 362:
352 STRUCTURAL EQUATION AND LATENT
- Page 363 and 364:
354 STRUCTURAL EQUATION AND LATENT
- Page 365 and 366:
356 STRUCTURAL EQUATION AND LATENT
- Page 367 and 368:
358 STRUCTURAL EQUATION AND LATENT
- Page 369 and 370:
360 STRUCTURAL EQUATION AND LATENT
- Page 371 and 372:
362 SURVIVAL AND EVENT HISTORY MODE
- Page 373 and 374:
364 SURVIVAL AND EVENT HISTORY MODE
- Page 375 and 376:
366 SURVIVAL AND EVENT HISTORY MODE
- Page 377 and 378:
368 SURVIVAL AND EVENT HISTORY MODE
- Page 379 and 380:
370 SURVIVAL AND EVENT HISTORY MODE
- Page 381 and 382:
372 SURVIVAL AND EVENT HISTORY MODE
- Page 383 and 384:
374 SURVIVAL AND EVENT HISTORY MODE
- Page 385 and 386:
376 SURVIVAL AND EVENT HISTORY MODE
- Page 387 and 388:
378 SURVIVAL AND EVENT HISTORY MODE
- Page 389 and 390:
380 SURVIVAL AND EVENT HISTORY MODE
- Page 391 and 392:
382 SURVIVAL AND EVENT HISTORY MODE
- Page 393 and 394:
384 SURVIVAL AND EVENT HISTORY MODE
- Page 395 and 396:
386 SURVIVAL AND EVENT HISTORY MODE
- Page 397 and 398:
388 SURVIVAL AND EVENT HISTORY MODE
- Page 399 and 400:
390 SURVIVAL AND EVENT HISTORY MODE
- Page 401 and 402:
392 SURVIVAL AND EVENT HISTORY MODE
- Page 403 and 404:
394 SURVIVAL AND EVENT HISTORY MODE
- Page 405 and 406:
396 SURVIVAL AND EVENT HISTORY MODE
- Page 407 and 408:
398 MODELLING AND ESTABLISHING CAUS
- Page 409 and 410:
400 MODELLING AND ESTABLISHING CAUS
- Page 411 and 412:
402 MODELLING AND ESTABLISHING CAUS
- Page 413 and 414:
404 MODELLING AND ESTABLISHING CAUS
- Page 415 and 416:
406 MODELLING AND ESTABLISHING CAUS
- Page 417 and 418:
408 MODELLING AND ESTABLISHING CAUS
- Page 419 and 420:
410 MODELLING AND ESTABLISHING CAUS
- Page 421 and 422:
412 MODELLING AND ESTABLISHING CAUS
- Page 423 and 424:
414 MODELLING AND ESTABLISHING CAUS
- Page 425 and 426:
416 MODELLING AND ESTABLISHING CAUS
- Page 427 and 428:
418 MODELLING AND ESTABLISHING CAUS
- Page 429 and 430:
420 MODELLING AND ESTABLISHING CAUS
- Page 431 and 432:
422 MODELLING AND ESTABLISHING CAUS
- Page 433 and 434:
424 MODELLING AND ESTABLISHING CAUS
- Page 435 and 436:
426 MODELLING AND ESTABLISHING CAUS
- Page 437 and 438:
428 MODELLING AND ESTABLISHING CAUS
- Page 439 and 440:
430 MODELLING AND ESTABLISHING CAUS
- Page 441 and 442:
432 MODELLING AND ESTABLISHING CAUS
- Page 443 and 444:
434 MODELLING AND ESTABLISHING CAUS
- Page 445 and 446:
436 MODELLING AND ESTABLISHING CAUS
- Page 447 and 448:
438 MODELLING AND ESTABLISHING CAUS
- Page 449 and 450:
440 MODELLING AND ESTABLISHING CAUS
- Page 451 and 452:
442 MODELLING AND ESTABLISHING CAUS
- Page 453 and 454:
444 MODELLING AND ESTABLISHING CAUS
- Page 455 and 456:
446 MODELLING AND ESTABLISHING CAUS
- Page 457 and 458:
Applied Bayesian Modelling. Peter C
- Page 459 and 460:
INDEX 451cumulative mortality in re
- Page 461 and 462:
INDEX 453latent variable effects, n
- Page 463 and 464:
INDEX 455of common odds ratio 402vs
- Page 465:
INDEX 457goals of 171time varying c