viewed here - FISITA 2010 World Automotive Congress
viewed here - FISITA 2010 World Automotive Congress
viewed here - FISITA 2010 World Automotive Congress

You also want an ePaper? Increase the reach of your titles
YUMPU automatically turns print PDFs into web optimized ePapers that Google loves.
F<strong>2010</strong>-A-035POTENTIAL OF NATURAL GAS POWERED VEHICLES INREDUCING CO2 AND POLLUTANT EMISSIONS UNDER REAL-WORLD DRIVING CONDITIONS1 Alvarez, Robert * , 1 Weilenmann, Martin, 1 Bach, Christian1 Empa, SwitzerlandKEYWORDS – compressed natural gas, vehicle exhaust emissions, CO 2 , pollutant, realworlddrivingABSTRACT - Natural gas powered vehicles (NGVs) represent a promising approach to reducevehicle CO 2 and pollutant emissions. These vehicles use compressed natural gas (CNG) asengine fuel, profiting from its considerably lower carbon content per unit energy to savevehicle CO 2 emissions. Another benefit of NGVs is that they can rely on approved powertrainand exhaust aftertreatment solutions that generally demand only minor adaptations to CNG.Finally, the environmental impact of NGVs regarding greenhouse gas emissions can begreatly reduced when employing methane gas from renewable sources.T<strong>here</strong>fore, an experimental investigation on a chassis dynamometer test bench has beencarried out with a sample of 13 in-use NGVs to determine their emission performanceregarding CO 2 and both regulated and unregulated gaseous pollutants. The vehicle sampleconsisted of 12 Euro-4 and 1 Euro-5 NGVs including original equipment manufacturer(OEM) completions and both OEM and external retrofits. Test runs with the statutory drivingcycle for Europe NEDC have been performed as well as the European real-world drivingcycles CADC and IUFC15. The latter two are based on car driving behaviour studies andreflect representative urban, rural and motorway driving.The results obtained show an acceptable pollutant emission performance of the consideredNGVs, having only 2 vehicles failing statutory hydrocarbon (HC) emission limit compliance.But emissions of HC and nitrogen oxides (NO x ) are remarkable in real-world urban hotdriving, indicating that the reduction of NO x in the catalytic converter employing HC as theoxidant may not occur entirely because HC emissions of NGVs mainly consist of methane, apowerful greenhouse gas that has a less pronounced catalytic oxidation activity. Besides,pronounced emissions of HC and also ammonia together with low emissions of NO x in highload and dynamic real-world rural and motorway driving indicate occasional fuel-richcombustion. The often low-end engine control systems used for NGVs until now and the factthat lambda sensors are cross-sensitive to methane are assumed to be responsible for thisobservation. In contrast, neither cold start nor hot emissions of carbon monoxide (CO) andnon-methane hydrocarbons (NMHC) are critical. A comparison to sample emissions of 26Euro-4 gasoline vehicles confirms these findings and also highlights benefits in CO 2emissions for the considered NGVs of around 21% for the Euro-4 sample and 33% for theEuro-5 vehicle.It can be concluded that modern NGVs demonstrate their CO 2 emission reduction potentialcompared to gasoline vehicles under real-world driving conditions with mostly improvedpollutant emission levels. However, certain fuel-specific developments in the fields of enginecontrol and exhaust aftertreatment are still to be undertaken to achieve best possible pollutantemission performance of NGVs.
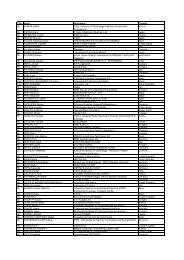
INTRODUCTIONThe need to reduce CO 2 along with pollutant emissions caused by individual mobility hasbecome a predominant task in the development efforts of vehicle manufacturers, also becauseof specific CO 2 vehicle emission legislation such as in Europe (1). Varied powertrainconcepts aiming at meeting these requirements are t<strong>here</strong>fore subsequently entering the marketand one promising short-term approach represent natural gas powered vehicles (NGVs) thatuse compressed natural gas (CNG) as engine fuel (2). Its lower carbon content per unit energyallows reducing CO 2 emissions significantly. Another advantage represents the fact thatreliable and approved technical solutions for energy conversion and exhaust aftertreatmentcan be employed with minor specific adaptations to this fuel. Further, the possibility ofemploying methane gas from renewable sources is feasible and established for these vehicleswithout considerable additional technical constraints, leading to major reduction in theenvironmental impact of NGVs regarding greenhouse gas emissions.Given this, it is of great interest to estimate the effective CO 2 and pollutant emissionperformance of modern NGVs under real-world driving conditions. The present studyaddresses to this topic and reports the outcomes of an experimental investigation on a chassisdynamometer test bench with 13 in-use NGVs of certification category Euro-4 and Euro-5including the statutory cycle for Europe and two real-world driving cycles for cars. T<strong>here</strong>sults obtained for CO 2 and both regulated and non-regulated pollutant emissions in realworldhot and cold-start driving conditions are discussed in detail and compared to sampleemissions of Euro-4 vehicles to highlight the respective differences in vehicle emissionperformance.METHODOLOGYNGV SampleThe main characteristics of the 13 in-use NGVs selected for the test series are summarized inTable 1. This selection has been chosen in order to match a representative vehicle samplewithin the registered Swiss vehicle fleet and is based on the respective vehicle registrationdatabase at the time of the investigation. 12 vehicles conform to certification category Euro-4and one vehicle to certification category Euro-5. Out of this Euro-4 sample, 10 vehiclesrepresent an original equipment manufacturer (OEM) completion and the other twocorrespond to a retrofit and OEM-retrofit completion. In addition, 5 of the OEM completionsof the Euro-4 sample (vehicles 1, 2, 3, 6 and 12) are monovalent, i.e. they feature a maximumgasoline tank volume of 15 liters and operate exclusively in CNG mode except cold start atlow ambient temperature. The state-of-the-art Euro-5 (vehicle 13) follows the same operationregime although being characterized as bivalent. All vehicles are of course equipped withthree-way catalytic converters (TWCs) to aftertreat the exhaust.
no. make model emptymassdispl.ratedpowermileagecert.cat.completionsupercharging[-] [-] [kg] [cm 3 ] [kW] [km] [-] [-] [-]1 VW Touran 1640 1984 80 2814 Euro-4 OEM no2 Opel Zafira 1.6 1590 1598 69 4404 Euro-4 OEM noCNG3 VW Caddy 1642 1984 80 32429 Euro-4 OEM no4 Volvo V70 CNG 1591 2435 103 47709 Euro-4 retrofit no5 Fiat Punto 1.2 1025 1242 44 23426 Euro-4 OEM noBipower6 Opel Combo 1395 1598 71 39459 Euro-4 OEM noC16CNG7 VW Golf Variant 1434 1984 85 93344 Euro-4 OEM noBifuel8 Citroën C3 1.4i 1014 1360 54 11300 Euro-4 OEMretrofitno9 Mercedes E 200 NGT 1690 1796 120 44192 Euro-4 OEM compr.Benz10 Fiat Multipla 1470 1596 65 46401 Euro-4 OEM no1.6Bipower11 Mercedes B 170 NGT 1440 2034 85 21154 Euro-4 OEM noBenz12 Opel Zafira B16TCNG1660 1598 110 8988 Euro-4 OEM turbocharged13 VW PassatEcofuel1537 1390 110 5296 Euro-5 OEM twinchargedTable 1. Main characteristics of the considered vehicle sample; displ.: displacement, cert. cat.: certificationcategory, compr.: compressor.The engines of vehicles 9, 12 and 13 include a form of supercharging in order to compensatepossible charge losses due to port injection of CNG and to fully exploit the fuel characteristicsof CNG with its higher knock resistance compared to gasoline. Besides, no particularservicing was carried out before the test runs except a general vehicle function check.Experimental ProgramSeveral driving cycles were employed in the test series in order to determine the CO 2 andpollutant emission performance of the selected NGVs. The statutory cold-start driving cyclefor Europe (3) was included, as well as the real-world Common Artemis Driving Cycle(CADC) and the repetitive real-world Inrets Urbain Fluid Court (IUFC15) cycle. The warmstartcycle CADC was derived from car driving behavior studies within the ARTEMISresearch program (4), and its cycle sections represent European real-world urban, rural andmotorway driving behavior for cars (5). The cold-start cycle IUFC15 was developed withinthe same research program and is suitable for investigating the effect of cold start on vehiclepollutant and CO 2 emissions because it consists of 15 repetitions of a short representativeEuropean real-world urban driving pattern (6) equally divided in three sections.
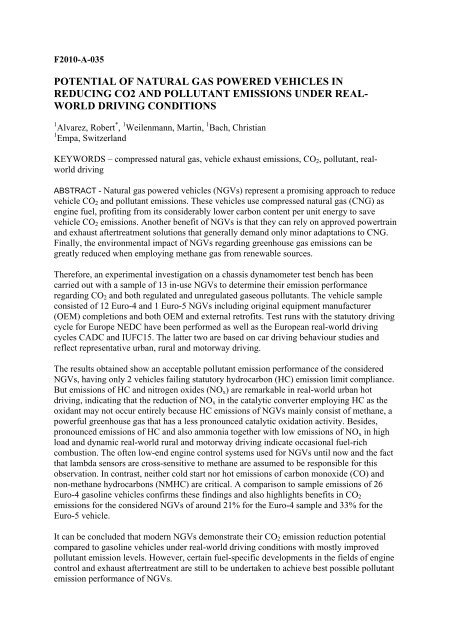
Experimental SetupFigure 1 shows the overall experimental setup employed for the test series. The exhaust wassampled with a Constant Volume Sampling (CVS) system. Exhaust emissions of CO 2 andregulated pollutants were measured according to the statutory procedure specified in CouncilDirective 70/220/EEC (3) of storing a sample of diluted exhaust in a tedlar gas sampling bagand analyzing its content offline after completion of the test run. Time-resolvedmeasurements of CO 2 and raw exhaust pollutants emissions were also performed, correctingthe resulting signal traces with respect to time delay due to the length of the sample lines.Adequate exhaust gas analyzers as specified by Council Directive 70/220/EEC (3) wereemployed for regulated pollutants and CO 2 in both cases and selected time-resolvedunregulated pollutants were detected with a chemical ionization mass spectrometer (CI-MS).Figure 1. Schematic diagram of the test setup; HFM: hot-film air-mass flow meter; CVS: constant volumesampling; CI-MS: chemical ionization mass spectrometer.The chassis dynamometer and its settings were applied according to the provisions of CouncilDirective 70/220/EEC (3). The driving resistance of the vehicle was simulated using t<strong>here</strong>spective coast-down data provided by the manufacturer and the inertia settings were set atempty vehicle mass plus 100 kg payload. The test cell ambient conditions were set to 23°Ctemperature and 50% relative air humidity. All vehicles were operated with commercial CNG.RESULTSThe test results obtained for the present NGVs in the different driving cycles discussed beloware reproduced in sample emissions of the 12 Euro-4 NGVs on one hand (NGV-E4) andsingle vehicle emissions of the Euro-5 NGV on the other hand (NGV-E5) in order to highlightthe possible improvements that can be expected from state-of-the-art completions of NGVpowertrains. In Addition, sample emissions of a Euro-4 gasoline vehicle sample (G-E4) areincluded for comparison reasons that were recorded in earlier experimental investigations(7,8) but applying the same determination methodology.
The main characteristics of the two samples are summarized in Table 2. They differ from eachother because of the larger variation of the latter needed to be reflected by the G-E4 sample toachieve in-use representativeness, resulting in lower average empty mass and higher averagedisplacement, power and mileage for G-E4 together with larger variance than NGV-E4.empty mass [kg] displ. [cm 3 ] power [kW] mileage [km]NGV-E4 1466 1767 83.7 31302G-E4 1277 1946 102.8 54889Table 2. Main sample characteristics of the NGV-E4 and G-E4 vehicle sample; displ.: displacement.Statutory Pollutant Emission PerformanceThe emission limit compliance of the measured NGVs in the statutory driving cycle NEDC isacceptable, having only two vehicles failing hydrocarbon (HC) emission limits and showingless spread in emissions with regard to G-E4, see Figure 2. Considerably lower sampleemission levels of the NGVs compared to G-E4 can be stated for emissions of carbonmonoxide (CO), nitrogen oxides (NO x ) and particularly of non-methane hydrocarbons(NMHC), because HC emissions of NGVs almost entirely consist of methane. The observeddifferences in sample pollutant emissions are assumed to be mainly caused by the less agedcatalytic converters of some NGVs thanks to their lower mileage (9) in contrast to G-E4.Also, the larger variance in vehicle sample characteristics of G-E4 leads to the given widerspread in pollutant emissions.1.41.47 3.36 2.97 2.61CO emissions [g km -1 ],HC, NMHC, NOx emissions [g km -1 ]*101.21.00.80.60.40.2NGV-E4NGV-E5G-E40.0CO HC NMHC NOxNEDCFigure 2. Average sample emissions of regulated pollutants in the cycle NEDC; error bars represent maximumand minimum sample emissions.Real-<strong>World</strong> Hot Pollutant Emission PerformanceFigure 3 shows the outcomes regarding NGV pollutant emissions in the warm-start real-worlddriving cycle CADC. The lower CO emission levels of NGVs compared to G-E4 observed inthe cycle NEDC is confirmed, especially for NGV-E5, demonstrating the emission reductionpotential for CO of state-of-the-art NGV powertrains. Low NO x emission levels can also bestated except in urban driving conditions, w<strong>here</strong> similar emission levels like G-E4 aredetected together with a larger spread in emissions. This behavior is linked to the equivalentHC emission performance observed in that cycle section: it appears that not all the NO x
formed under stoichiometric combustion conditions can be oxidized in the catalytic converterwith the respective amount of resulting HC because it mainly consists of methane, whichtypically has a less pronounced catalytic oxidation activity (9,10,11). Besides, the high HCemissions of some NGVs recorded in the more demanding rural and especially motorwaycycle sections of the CADC combined with low NO x emissions indicate occasional fuel-richcombustion. A possible reason for this insufficient fuel management in such high load anddynamic operating conditions can be found in the often low-end engine control systemsimplemented in these vehicles up to now, especially when they do not accurately compensatethe cross-sensitivity of the exhaust gas oxygen sensor to methane. Also note that thepronounced NMHC emissions of the NGV-E4 sample in the motorway cycle section are onlycaused by excessive emissions of a single vehicle and may rather constitute an exceptionaloccurrence.4.09.92 1.530.6CO emissions [g km -1 ]3.53.02.52.01.51.00.5NGV-E4NGV-E5G-E4NOx emissions [g km -1 ]0.50.40.30.20.1NGV-E4NGV-E5G-E40.0CADC urban CADC rural CADC mway0.0CADC urban CADC rural CADC mway0.100.350.100.2HC emissions [g km -1 ]0.080.060.040.02NGV-E4NGV-E5G-E4NMHC emissions [g km -1 ]0.080.060.040.02NGV-E4NGV-E5G-E40.00CADC urbanCADC rural CADC mway0.00CADC urban CADC rural CADC mwayFigure 3. Average sample emissions of regulated pollutants in the cycle CADC; error bars represent maximumand minimum sample emissions.Cold-Start Real-<strong>World</strong> Emission PerformanceThe results from the repetitive urban real-world driving cycle IUFC15 suitable forinvestigating cold start effects on vehicle pollutant emissions are given in Figure 4. Again, aconsiderably better CO emission performance can be stated for the NGV-E4 samplecompared to G-E4 that is topped by the very low CO emissions of NVG-E5. Similar sampleemissions are detected for NO x and HC in the cold started cycle section, but remarkablyhigher emissions of the latter appear for NGVs in the last two cycle sections w<strong>here</strong> catalystlight-off already occurred. The same behavior than in the CADC urban cycle section isassumed to be responsible for it, i.e. that not all of the HC can be used as oxidant tocatalytically reduce NO x in the catalytic converter because it mainly consists of methane thatdoes not easily oxidize catalytically (9,10,11). Besides, most of the NMHC emissions in the
first section of the IUFC15 of sample NGV-E4 are caused by the respective vehicles carryingout cold start in gasoline mode.57.30.5CO emissions [g km -1 ]4321NGV-E4NGV-E5G-E4NOx emissions [g km -1 ]0.40.30.20.1NGV-E4NGV-E5G-E40IUFC15 I IUFC15 II IUFC15 III0.0IUFC15 I IUFC15 II IUFC15 III0.300.56 0.61 0.44 0.570.30HC emissions [g km -1 ]0.250.200.150.100.05NGV-E4NGV-E5G-E4NMHC emissions [g km -1 ]0.250.200.150.100.05NGV-E4NGV-E5G-E40.00IUFC15 I IUFC15 II IUFC15 III0.00IUFC15 I IUFC15 II IUFC15 IIIFigure 4. Average sample emissions of regulated pollutants in the cycle IUFC15; error bars represent maximumand minimum sample emissions.These findings are confirmed by the resulting cold start extra emissions (CSEE) for the singlevehicle samples given in Table 3 that are calculated from the emissions values of the singleIUFC15 cycle sections based on the methodology described in (12): comparable CSEE arestated for NO x , CSEE for CO improve broadly and CSEE for HC and particularly for NMHCare much lower for the NGVs as their hot emissions of HC are more pronounced and basicallyconsist of methane.CSEE [g/cyc]CO HC NMHC NOxNGV-E4 0.768 0.160 0.071 0.079NGV-E5 0.261 0.162 0.025 0.094G-E4 1.664 0.240 0.223 0.090Table 3. Pollutant cold start extra emissions (CSEE) of the single vehicle samples in the driving cycle IUFC15Non-Regulated Pollutant Emission PerformanceA chemical ionization mass spectrometer has been employed in the present experimentalinvestigation to determine possible relevant unregulated pollutant emissions of NGVs. Out ofthe substances considered, basically no emissions of aromatic hydrocarbon compounds likebenzene or toluene could be detected, which excludes the possibility of formation in thecatalytic converter as CNG barely contains such compounds. Also hardly any emissions ofNO 2 were recorded in accordance to the evidence of marginal shares of NO 2 in vehicles
exhaust emissions of NO x for modern vehicles equipped with TWCs (13). In contrast, hotemissions of ammonia (NH 3 ) of vehicle sample NGV-E4 are relevant, see Figure 5. T<strong>here</strong>,emissions of NH 3 in hot cycle sections of NGV-E4 and NGV-E5 are plotted versus the meancycle speed in the respective cycle sections and compared to speed-dependent emissionfactors determined from a subsample of G-E4 within another experimental investigation (14).0.070.06NH3 emissions [g km -1 ]0.050.040.030.020.01NGV-E4NGV-E5G-E40.000 20 40 60 80 100 120 140mean velocity [km h -1 ]Figure 5. Hot NH 3 emissions of NGV-E4 and NGV-E5 vs. the respective mean cycle section speed together withvelocity-dependent NH 3 emission factors for a subsample of G-E4 (14)The velocity-dependent NH 3 emissions of NGV-E4 are about twice the emissions of G-E4.This observation enforces the above-mentioned assumption of insufficient fuel managementin certain driving situations by the low-end engine control system of some NGVs, becauseammonia is almost exclusively formed in fuel-rich combustion conditions. But the overall lowNH 3 emission levels of NGV-E5 indicate once more the possibility of reducing pollutantemissions when employing state-of-the-art abatement measures.CO 2 Emission PerformanceThe CO 2 emissions of the NGV samples recorded in the single driving cycles are given inFigure 6 together with respective sample emissions of G-E4. Reduced CO 2 sample emissionsof around 21% for NGV-E4 and even 33% for NGV-E5 compared to G-E4 can be stated in allcycle sections, although the average empty mass of the latter is articulately higher. The higheraverage displacement and rated power of sample G-E4 may account to this finding. Also, thewider spread in CO 2 emissions of G-E4 is clearly to be attributed to the higher variance of itssample characteristics. But the reduction potential regarding CO 2 emissions of NGVpowertrains when employing CNG as engine fuel because of the lower carbon content perunit energy of CNG is evident.
CO2 emissions [g km -1 ]45040035030025020015010050NGV-E4NGV-E5G-E40urban rural mway I II IIINEDC CADC IUFC15Figure 6. CO 2 sample emissions in the different driving cycles; error bars represent maximum and minimumsample emissions.Note that even though methane features a considerable greenhouse gas equivalence factor of25 with regard to CO 2 (15), the CO 2 -equivalent NGV sample emissions of methane representonly around 0.5% of the respective CO 2 emissions. CO 2 t<strong>here</strong>fore constitutes the mostrelevant greenhouse gas for NGVs.CONCLUSIONSThe present experimental investigation on CO 2 and pollutant emissions of modern NGVsdemonstrates their remarkable potential in reducing vehicle CO 2 emissions compared togasoline vehicles under real-world driving conditions and highlights an improved generalemission performance regarding regulated and non-regulated pollutants. However, it is alsoshown that further development in engine control and exhaust aftertreatment systems ofNGVs is still required to fully compensate certain fuel-specific effects in order to avoidpronounced hot vehicle emissions of some pollutants, especially NO x , methane and alsoammonia.ACKNOWLEDGEMENTSThe authors thank the Swiss Federal Office for the Environment (FOEN) for principallyfunding the study.REFERENCES(1) Regulation EC 443/2009 of the European Parliament and of the Council of 23 April2009 setting emission performance standards for new passenger cars as part of theCommunity's integrated approach to reduce CO 2 emissions from light-duty vehicles.Official Register of the European Union. http://eurlex.europa.eu/Notice.do?val=496639:cs&lang=en&list=496639:cs,&pos=1&page=1&nbl=1&pgs=10&hwords=443/2009~(2) Engerer H., Horn M., “Natural gas vehicles: An option for Europe”, Energy Policy,38, 1017–1029, <strong>2010</strong>
(3) Council Directive 70/220/EEC of 20 March 1970 on the approximation of the laws ofthe Member States relating to measures to be taken against air pollution by gases frompositive-ignition engines of motor vehicles. http://eurlex.europa.eu/LexUriServ/LexUriServ.do?uri=CONSLEG:1970L0220:20070101:en:PDF(4) ARTEMIS: Assessment and Reliability of Transport Emission Models and InventorySystems. http://www.trl.co.uk/ARTEMIS(5) André M., “The ARTEMIS European driving cycles for measuring car pollutantemissions”, Science of the Total Environment, 334-335, 73-84, 2004(6) Joumard R., André J.M., Rapone M., Zallinger M., Kljun N., André M., Samaras S.,Roujol S., Laurikko J., Weilenmann M., Markewitz K., Geivanidis S., Ajtay D.,Paturel L., “Emission factor modelling and database for light vehicles - Artemisdeliverable 3”, Inrets Report No. LTE 0523. Bron, France, 2007(7) Alvarez R., Favez J.-Y., Weilenmann M., “Gasoline Passenger Cars Euro 4 - StandardProgram”, Empa Report No. 203270g, Dübendorf, Switzerland, 2007(8) Alvarez R., Weilenmann M.,“Gasoline Passenger Cars Euro 4 - Sample Completion -Standard Program”, Empa Report No. 203270g, Dübendorf, Switzerland, 2009(9) Winkler A., Dimopoulos P., Hauert R., Bach C., Aguirre M., “Catalytic activity andaging phenomena of three-way catalysts in a compressed natural gas/gasoline poweredpassenger car”, Applied Catalysis B: Environmental, 84, 162–169, 2008(10) Takigawa A., Matsunami A., Arai N., “Methane emission from automobile equippedwith threeway catalytic converter while driving”, Energy, 30, 461–473, 2005(11) Choudhary T.V., Banerjee S., Choudhary V.R., “Catalysts for combustion of methaneand lower alkanes”, Applied Catalysis A: General, 234, 1–23, 2002(12) Favez J.-Y., Weilenmann M., Stilli J., “Cold start extra emissions as a function ofengine stop time: Evolution over the last 10 years”, Atmospheric Environment, 43,996-1007, 2009(13) Alvarez R., Weilenmann M., Favez J.-Y., “Evidence of increased mass fraction ofNO 2 within real-world NO x emissions of modern light vehicles - derived from areliable online measuring method”, Atmospheric Environment, 42, 4699-4707, 2008(14) Heeb N.V., Saxer C.J., Forss A.-M., Brühlmann S., “Trends of NO-, NO 2 -, and NH 3 -emissions from gasoline-fueled Euro-3- to Euro-4-passenger cars”, AtmosphericEnvironment, 42, 2543–2554, 2008(15) Solomon S., Qin D., Manning M., Chen Z., Marquis M., Averyt K.B., Tignor M.Miller H.L., “Climate Change 2007: The Physical Science Basis. Contribution ofWorking Group I to the Fourth Assessment Report of the Intergovernmental Panel onClimate Change”, Cambridge University Press, Cambridge, United Kingdom and NewYork, NY, USA, 996 pp, 2007