Retail Food Group Limited
Retail Food Group Limited
Retail Food Group Limited
Create successful ePaper yourself
Turn your PDF publications into a flip-book with our unique Google optimized e-Paper software.
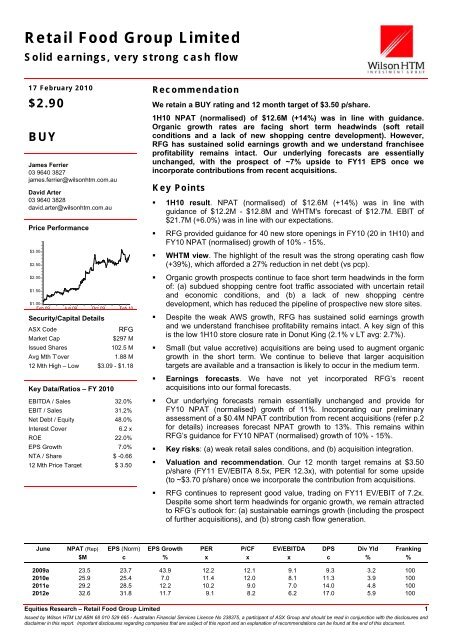
<strong>Retail</strong> <strong>Food</strong> <strong>Group</strong> <strong>Limited</strong>Solid earnings, very strong cash flowDN17 February 2010$2.90BUYJames Ferrier03 9640 3827james.ferrier@wilsonhtm.com.auDavid Arter03 9640 3828david.arter@wilsonhtm.com.auPrice Performance$3.00$2.50$2.00$1.50$1.00Feb 09Jun 09Oct 09Security/Capital DetailsFeb 10ASX CodeRFGMarket Cap$297 MIssued Shares102.5 MAvg Mth T’over1.88 M12 Mth High – Low $3.09 - $1.18Key Data/Ratios – FY 2010EBITDA / Sales 32.0%EBIT / Sales 31.2%Net Debt / Equity 48.0%Interest Cover6.2 xROE 22.0%EPS Growth 7.0%NTA / Share $ -0.6612 Mth Price Target $ 3.50RecommendationWe retain a BUY rating and 12 month target of $3.50 p/share.1H10 NPAT (normalised) of $12.6M (+14%) was in line with guidance.Organic growth rates are facing short term headwinds (soft retailconditions and a lack of new shopping centre development). However,RFG has sustained solid earnings growth and we understand franchiseeprofitability remains intact. Our underlying forecasts are essentiallyunchanged, with the prospect of ~7% upside to FY11 EPS once weincorporate contributions from recent acquisitions.Key Points• 1H10 result. NPAT (normalised) of $12.6M (+14%) was in line withguidance of $12.2M - $12.8M and WHTM's forecast of $12.7M. EBIT of$21.7M (+6.0%) was in line with our expectations.• RFG provided guidance for 40 new store openings in FY10 (20 in 1H10) andFY10 NPAT (normalised) growth of 10% - 15%.• WHTM view. The highlight of the result was the strong operating cash flow(+39%), which afforded a 27% reduction in net debt (vs pcp).• Organic growth prospects continue to face short term headwinds in the formof: (a) subdued shopping centre foot traffic associated with uncertain retailand economic conditions, and (b) a lack of new shopping centredevelopment, which has reduced the pipeline of prospective new store sites.• Despite the weak AWS growth, RFG has sustained solid earnings growthand we understand franchisee profitability remains intact. A key sign of thisis the low 1H10 store closure rate in Donut King (2.1% v LT avg: 2.7%).• Small (but value accretive) acquisitions are being used to augment organicgrowth in the short term. We continue to believe that larger acquisitiontargets are available and a transaction is likely to occur in the medium term.• Earnings forecasts. We have not yet incorporated RFG’s recentacquisitions into our formal forecasts.• Our underlying forecasts remain essentially unchanged and provide forFY10 NPAT (normalised) growth of 11%. Incorporating our preliminaryassessment of a $0.4M NPAT contribution from recent acquisitions (refer p.2for details) increases forecast NPAT growth to 13%. This remains withinRFG’s guidance for FY10 NPAT (normalised) growth of 10% - 15%.• Key risks: (a) weak retail sales conditions, and (b) acquisition integration.• Valuation and recommendation. Our 12 month target remains at $3.50p/share (FY11 EV/EBITA 8.5x, PER 12.3x), with potential for some upside(to ~$3.70 p/share) once we incorporate the contribution from acquisitions.• RFG continues to represent good value, trading on FY11 EV/EBIT of 7.2x.Despite some short term headwinds for organic growth, we remain attractedto RFG’s outlook for: (a) sustainable earnings growth (including the prospectof further acquisitions), and (b) strong cash flow generation.JuneNPAT (Rep)$MEPS (Norm)cEPS Growth%PERxP/CFxEV/EBITDAxDPScDiv Yld%Franking%2009a 23.5 23.7 43.9 12.2 12.1 9.1 9.3 3.2 1002010e 25.9 25.4 7.0 11.4 12.0 8.1 11.3 3.9 1002011e 29.2 28.5 12.2 10.2 9.0 7.0 14.0 4.8 1002012e 32.6 31.8 11.7 9.1 8.2 6.2 17.0 5.9 100Equities Research – <strong>Retail</strong> <strong>Food</strong> <strong>Group</strong> <strong>Limited</strong> 1Issued by Wilson HTM Ltd ABN 68 010 529 665 - Australian Financial Services Licence No 238375, a participant of ASX <strong>Group</strong> and should be read in conjunction with the disclosures anddisclaimer in this report. Important disclosures regarding companies that are subject of this report and an explanation of recommendations can be found at the end of this document.
17 February 2010Impact of acquisitionsWe have not yet incorporated RFG’s recent acquisitions into our formal forecasts.A summary of our expected contributions from these recent acquisitions is detailedin the tables below.Acquisition summaryY/e: 30 June Settlement EBIT ($M) EBIT ($M) Acquisition Cash ($M) Scrip ($M) Scrip (M) Multiple (x)date Pre-synergies Post-synergies price ($M) Post-synergiesDCM 13-Jan-10 0.5 1.0 2.4 2.1 0.3 0.1 2.4Brumby's NQ & NZ 15-Jan-10 0.7 0.9 4.0 2.7 1.3 0.4 4.4Brumby's WA & NT 16-Feb-10 0.8 1.1 4.8 3.6 1.2 0.4 4.4Big Dad's Pies * TBC 0.7 1.1 3.3 2.6 0.7 0.2 3.0Total 2.7 4.1 14.5 11.0 3.5 1.2 3.5Source: RFG & WHTM. Note: * denotes WHTM estimates.Earnings contributionY/e: 30 June FY10e FY11eAcquisitionsDCM 0.2 1.0Brumby's NQ & NZ 0.3 0.9Brumby's WA & NT 0.3 1.1Big Dad's Pies 0.2 1.1Total EBIT 1.0 4.1- less interest expense -0.4 -0.9- less tax expense -0.2 -1.0Total NPAT 0.4 2.3Existing business NPAT ($M) 25.9 29.2Acquired business NPAT ($M) 0.4 2.3Total NPAT ($M) 26.3 31.4- implied upside to current forecast 1.6% 7.8%Valuation upsideY/e: 30 June Existing Acquisitions TotalbusinessFY11 EBIT ($M) 47.4 4.1 51.5FY11 Net debt ($M) 42.2 11.0 53.2Shares on issue (M) 102.5 1.2 103.7FY11 EV/EBIT multiple (x) 8.5Enterprise value ($M) 438.1Equity value ($M) 384.9Valuation (p/share) $3.71- implied upside to current valuation 5%Source: RFG & WHTM.Expanded shares on issue (M) 103.7Current FY11 EPS forecast $0.28Revised FY11 EPS forecast $0.30- implied EPS upside 7%- PER implied by current share price 9.6Source: RFG & WHTM.Key points:• Our preliminary assessment of RFG’s recent acquisitions includes:(a) FY10 NPAT contribution of $0.4M. This would imply FY10 NPAT(normalised) growth of 13% for the total business (vs our current forecast of11%), which is in line with RFG’s guidance for 10% - 15% growth.(b) FY11 NPAT contribution of $2.3M, which implies ~7% upside to our currentEPS forecast.(c) Potential valuation upside of 5% (to $3.71 p/share).Equities Research – <strong>Retail</strong> <strong>Food</strong> <strong>Group</strong> <strong>Limited</strong> 2
17 February 20101H10 result reviewA summary of the 1H10 result is detailed in the table below.June year-end 1H10 1H09 % Chg WHTM est % Chg vs est.Operating revenue $M 69.3 76.1 (9%) 71.7 (3%)EBIT $M 21.7 20.5 6% 21.7 0%- margin % 31.3% 26.9% n/a 30.2% n/aNPAT (normalised) $M 12.6 11.1 14% 12.7 (1%)NPAT (reported) $M 12.5 10.6 18% 12.7 (2%)EPS (normalised) cps 12.4 11.2 11% 12.6 (1%)DPS cps 5.25 4.5 17% 5.5 (5%)Operating cash flow (OCF) $M 13.9 10.0 39% 10.6 31%Net Debt $M 76.7 105.7 (27%) 79.7 (4%)Key points:• Income statement. NPAT (normalised) of $12.6M (+14%) was in line withguidance of $12.2M - $12.8M and WHTM's forecast of $12.7M. EBIT of $21.7M(+6.0%) was in line with our expectations.• Operating revenue of $69.3M was broadly in line with our expectations. Thedecline on pcp (-9.0%) was primarily due to the conversion of some Michel'sfranchisees to a royalty-based system (from the original wholesale-basedsystem) and the sale of the Central Manufacturing Facility (CMF).• Modest AWS growth (eg. +0.7% in Donut King) reflects the short termheadwinds on organic growth rates from uncertain retail sales conditions and alack of new shopping centre development. However, we caution against placingtoo much emphasis on AWS growth, given RFG’s push into non-traditionalstore sites, which generally have lower AWS.• Despite the weak AWS growth, RFG has sustained solid earnings growth andwe understand franchisee profitability remains intact. A key sign of this is thelow 1H10 store closure rate in Donut King (2.1% v long term average of 2.7%).• Cash flow. Operating cash flow (OCF) of $13.9M was substantially above pcpand our forecast, primarily due to reduced working capital requirements asMichel’s franchisees transition to a fee-based system and improvements inBrumby’s debtors. Capex was negligible, as expected of a low capital-intensivebusiness, which provided substantial free cash flow.• Balance sheet. The strong free cash flow generation assisted a materialreduction in net debt (-27%). EBIT / Net interest expense was a healthy 5.6x.Equities Research – <strong>Retail</strong> <strong>Food</strong> <strong>Group</strong> <strong>Limited</strong> 3
17 February 2010Earnings outlookA summary of our revised earnings forecasts are detailed in the table below.Earnings summaryY/e: 30 June FY08 FY09 FY10e FY11e FY12eSales revenue $M 123.7 142.5 139.3 146.9 155.2- growth % 320% 15% -2% 5% 6%EBITDA $M 33.4 41.9 44.6 48.4 51.9- growth % 174% 25% 7% 8% 7%EBIT $M 32.1 40.5 43.5 47.4 51.2- growth % 168% 26% 7% 9% 8%NPAT (normalised) $M 15.4 23.3 25.9 29.2 32.6- growth % 105% 51% 11% 13% 12%NPAT (reported) $M 17.6 23.5 25.9 29.2 32.6EPS cents 16.5 23.7 25.4 28.5 31.8- growth % 57% 44% 7% 12% 12%DPS cents 8.5 9.3 11.3 14.0 17.0Earnings multiples:EV / EBIT x 12.0 9.3 8.2 7.2 6.2PER x 17.6 12.2 11.4 10.2 9.1Dividend yield % 2.9 3.2 3.9 4.8 5.9Source: RFG & WHTM.Note: FY08 weighted avg shares based on Sept '07 acquisition of Michel's (ie. 10mths).Key points:• We have not yet incorporated RFG’s recent acquisitions into our formalforecasts.• Our underlying forecasts remain essentially unchanged and provide for FY10NPAT (normalised) growth of 11%. Incorporating our preliminary assessment ofa $0.4M NPAT contribution from recent acquisitions increases FY10 NPATgrowth to 13%. This remains within RFG’s guidance for FY10 NPAT(normalised) growth of 10% - 15%.• Organic growth prospects continue to face short term headwinds in the form of:(a) subdued shopping centre foot traffic associated with uncertain retail andeconomic conditions, and (b) a lack of new shopping centre development,which has reduced the pipeline of prospective new store sites.• This headwind is being (partly) offset by small bolt on acquisitions. We continueto believe that larger acquisition targets are available and a transaction is likelyto occur in the medium term. RFG has a proven track record of value creationvia acquisition (eg. Brumby’s).Equities Research – <strong>Retail</strong> <strong>Food</strong> <strong>Group</strong> <strong>Limited</strong> 4
17 February 2010<strong>Retail</strong> <strong>Food</strong> <strong>Group</strong> <strong>Limited</strong> (RFG : $2.90)INVESTMENT FUNDAMENTALSYr Ending June 2008A 2009A 2010E 2011E 2012EEPS Reported (c) 18.9 23.9 25.4 28.5 31.8EPS Normalised (c) 16.5 23.7 25.4 28.5 31.8EPS Growth (%) N/A 43.9% 7.0% 12.2% 11.7%PER Normalised (x) 17.6 12.2 11.4 10.2 9.1DPS (c) 8.5 9.3 11.3 14.0 17.0Payout (%) 45.1% 38.7% 44.4% 49.2% 53.5%Yield (%) 2.9% 3.2% 3.9% 4.8% 5.9%Franking (%) 100% 100% 100% 100% 100%VALUATION DATAYr Ending June 2008A 2009A 2010E 2011E 2012EEV / EBITA (x) 12.4 9.4 8.3 7.2 6.2EV / EBITDA (x) 11.9 9.1 8.1 7.0 6.2CFPS (c) 14.9 24.0 24.1 32.1 35.5Price / CF 19.5 12.1 12.0 9.0 8.2Book Value / Share ($) 1.0 1.1 1.3 1.4 1.6Price / Book (x) 3.0 2.7 2.3 2.1 1.8BALANCE SHEET ($m)Yr Ending June 2008A 2009A 2010E 2011E 2012ECash 4.1 5.4 23.9 43.5 63.5Receivables 15.0 15.0 16.6 17.5 18.5Inventories 1.4 1.9 2.3 2.5 2.6Other 5.2 0.9 1.0 0.0 0.0Current Assets 25.7 23.2 43.9 63.5 84.6Net PPE 9.2 3.3 2.7 2.3 2.0Investments 0.0 0.0 0.0 0.0 0.0Intangibles 192.5 192.8 192.8 192.8 192.8Other 1.2 3.2 8.0 8.1 8.3Non-current Assets 202.9 199.3 203.5 203.2 203.1Total Assets 228.6 222.5 247.5 266.7 287.8Current Payables 10.0 7.7 6.5 6.9 7.3Current Debt 1.6 0.0 85.7 85.7 85.7Non-Current Debt 115.2 95.5 0.0 0.0 0.0Provisions 0.0 0.0 0.0 0.0 0.0Other 7.2 12.3 26.8 29.4 33.3Total Liabilities 134.0 115.5 119.0 121.9 126.3PROFIT & LOSS ($m)Yr Ending June 2008A 2009A 2010E 2011E 2012ESales Revenue 123.7 142.5 139.3 146.9 155.2EBITDA 33.4 41.9 44.6 48.4 51.9Depreciation 1.3 1.3 1.1 0.9 0.8EBITA 32.1 40.5 43.5 47.4 51.2Amortisation 0.0 0.0 0.0 0.0 0.0EBIT 32.1 40.5 43.5 47.4 51.2Net Interest Expense 10.0 8.8 7.1 6.4 5.3Pre-tax Profit 22.1 31.7 36.4 41.1 45.9Tax 6.7 8.4 10.6 11.9 13.3Tax rate (%) 30.4% 26.5% 29.0% 29.0% 29.0%Minorities / pref divs 0.0 0.0 0.0 0.0 0.0Equity accounted NPAT 0.0 0.0 0.0 0.0 0.0Net Profit 15.4 23.3 25.9 29.2 32.6Abn’s / Extraord’s 2.2 0.2 0.0 0.0 0.0Reported Net Profit 17.6 23.5 25.9 29.2 32.6Revenue Growth (%) N/A 15.1% -2.3% 5.5% 5.6%EBIT Growth (%) N/A 26.2% 7.4% 9.0% 7.8%NPAT Growth (%) N/A 51.4% 11.0% 12.7% 11.7%PROFITABILITY RATIOSYr Ending June 2008A 2009A 2010E 2011E 2012EEBIT / Sales (%) 25.9% 28.4% 31.2% 32.3% 33.0%ROA (%) N/A 18.3% 19.8% 21.2% 22.9%ROE (%) N/A 23.1% 22.0% 21.3% 21.3%ROFE (%) N/A 20.0% 22.5% 25.2% 27.6%Equity 78.5 81.0 85.6 85.6 85.6Reserves 0.5 -4.3 -3.1 -3.1 -3.1Retained Profits 15.7 30.3 46.0 62.4 79.1Minorities 0.0 0.0 0.0 0.0 0.0Total Equity 94.6 107.0 128.5 144.8 161.5Total Funds Employed 207.3 197.1 190.2 187.0 183.7LIQUIDITY & LEVERAGE RATIOSYr Ending June 2008A 2009A 2010E 2011E 2012ENet Debt (Cash) ($m) 112.7 90.1 61.7 42.2 22.2Net Debt / Equity (%) 119.1% 84.2% 48.0% 29.1% 13.7%Interest Cover (x) 3.2 4.6 6.2 7.4 9.7Debt / CashFlow (x) 8.4 4.1 3.5 2.6 2.4CASHFLOW ($m)Yr Ending June 2008A 2009A 2010E 2011E 2012EEBIT 32.1 40.5 43.5 47.4 51.2Dep’n and Amort’n 1.3 1.3 1.1 0.9 0.8Net Int Rec’d (Paid) -10.0 -8.8 -7.1 -6.4 -5.3Tax Paid -4.2 -7.9 -9.7 -8.5 -9.5Dec / (Inc) W’kg Cap -5.5 -2.8 -3.3 -0.7 -0.7Other 0.1 1.2 0.0 0.0 0.0Operating Cash Flow 13.9 23.6 24.6 32.9 36.4Capital Expenditure -0.2 5.2 -0.5 -0.5 -0.5Asset Sales 0.0 0.0 0.0 0.0 0.0Investments -82.8 0.8 0.0 0.0 0.0Other Inv. Flows 0.0 0.0 0.0 0.0 0.0Investing Cash Flow -83.0 6.0 -0.5 -0.5 -0.5Equity Raised 43.5 0.4 4.6 0.0 0.0Inc / (Dec) in Loans 32.1 -21.8 0.0 0.0 0.0Dividends Paid -3.9 -6.8 -10.1 -12.8 -15.9Other Fin. Flows 0.0 0.0 0.0 0.0 0.0Financing Cash Flow 71.7 -28.3 -5.5 -12.8 -15.9Net Cash Flow 2.6 1.3 18.5 19.5 20.0Equities Research – <strong>Retail</strong> <strong>Food</strong> <strong>Group</strong> <strong>Limited</strong> 5
17 February 2010Recommendation StructureBUY: Total return +10% or more over a 12 month periodHOLD: Total return expected to be between +10% to -10% over a 12-month periodSELL: Total return expected to be -10% or more over a 12 month periodTOTAL RETURN OR TSR = capital growth in share price + expected dividend yield in that periodOther definitionsCS Coverage Suspended. Wilson HTM Ltd has suspended coverage of this company.NR Not Rated. The recommendation has been suspended temporarily. Such suspension is in line with Wilson HTM Investment<strong>Group</strong> Ltd policies in circumstances where Wilson HTM Corporate Finance Ltd is acting in an advisory capacity in a merger orstrategic transaction involving the company and in certain other situations.DisclaimerWhilst Wilson HTM Ltd believes the information contained in this communication is based on reliable information, no warranty isgiven as to its accuracy and persons relying on this information do so at their own risk. To the extent permitted by law Wilson HTMLtd disclaims all liability to any person relying on the information contained in this communication in respect of any loss or damage(including consequential loss or damage) however caused, which may be suffered or arise directly or indirectly in respect of suchinformation. Any projections contained in this communication are estimates only. Such projections are subject to market influencesand contingent upon matters outside the control of Wilson HTM Ltd and therefore may not be realised in the future.The advice contained in this document is general advice. It has been prepared without taking account of any person’s objectives,financial situation or needs and because of that, any person should, before acting on the advice, consider the appropriateness of theadvice, having regard to the client’s objectives, financial situation and needs. Those acting upon such information without firstconsulting one of Wilson HTM Ltd investment advisors do so entirely at their own risk. This report does not constitute an offer orinvitation to purchase any securities and should not be relied upon in connection with any contract or commitment whatsoever. If theadvice relates to the acquisition, or possible acquisition, of a particular financial product – the client should obtain a ProductDisclosure Statement relating to the product and consider the Statement before making any decision about whether to acquire theproduct. This communication is not to be disclosed in whole or part or used by any other party without Wilson HTM Ltd's prior writtenconsent.Disclosure of Interest. <strong>Retail</strong> <strong>Food</strong> <strong>Group</strong> <strong>Limited</strong>The Directors of Wilson HTM Ltd advise that at the date of this report they and their associates have relevant interests in <strong>Retail</strong> <strong>Food</strong><strong>Group</strong> <strong>Limited</strong>. They also advise that Wilson HTM Ltd and Wilson HTM Corporate Finance Ltd A.B.N. 65 057 547 323 and theirassociates have received and may receive commissions or fees from <strong>Retail</strong> <strong>Food</strong> <strong>Group</strong> <strong>Limited</strong> in relation to advice or dealings insecurities. Some or all of Wilson HTM Ltd authorised representatives may be remunerated wholly or partly by way of commission.In producing research reports, members of Wilson HTM Ltd Research may attend site visits and other meetings hosted by the issuersthe subject of its research reports. In some instances the costs of such site visits or meetings may be met in part or in whole by theissuers concerned if Wilson HTM Ltd considers it is appropriate and reasonable in the specific circumstances relating to the site visitor meeting.BRISBANE SYDNEY MELBOURNE GOLD COASTPh: 07 3212 1333 Ph: 02 8247 6600 Ph: 03 9640 3888 Ph: 07 5509 5500Fax: 07 3212 1399 Fax: 02 8247 6601 Fax: 03 9640 3800 Fax: 07 5509 5599DALBY HERVEY BAY TOWNSVILLE GEELONGPh: 07 4660 8000 Ph: 07 4197 1600 Ph: 07 4725 5787 Ph: 03 5225 1500Fax: 07 4660 4169 Fax: 07 4197 1699 Fax: 07 4725 5104 Fax: 03 5225 1599Our web site: www.wilsonhtm.com.auEquities Research – <strong>Retail</strong> <strong>Food</strong> <strong>Group</strong> <strong>Limited</strong> 6


