Retail Food Group Ltd (RFG) FY'08 above guidance, baked fresh
Retail Food Group Ltd (RFG) FY'08 above guidance, baked fresh
Retail Food Group Ltd (RFG) FY'08 above guidance, baked fresh

Create successful ePaper yourself
Turn your PDF publications into a flip-book with our unique Google optimized e-Paper software.
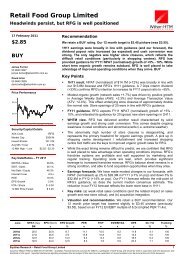
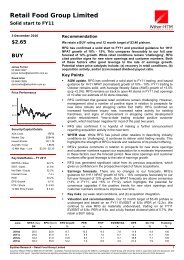
<strong>Retail</strong> <strong>Food</strong> <strong>Group</strong> <strong>Ltd</strong> (<strong>RFG</strong>)<strong>FY'08</strong> <strong>above</strong> <strong>guidance</strong>, <strong>baked</strong> <strong>fresh</strong> 1 September 2008Opinion DataRecommendationRisk RatingBuyMediumCurrent share price $1.3512 month target price $2.60 (from $2.55)Price range - high/low $2.10-$1.12Market capitalisation$120 m<strong>RFG</strong> reported adjusted FY’08 NPAT of $16.9m,<strong>above</strong> the top end of <strong>guidance</strong> ($16.3-$16.8m)and Austock forecasts ($16.4m).Reported NPAT included a $0.8m gain onacquisition of the Brumby’s business, suggesting thebusiness was acquired at an attractive price.Positive Average Weekly Sales and AverageTransaction Value growth across all systemsreinforces our view product demand wasresilient despite sluggish retail conditions.Brumby’s has been integrated a full six-monthsahead of schedule with the business modelproving a good fit for the <strong>RFG</strong> model. We expectBrumby’s is the key driver of the <strong>above</strong> <strong>guidance</strong>result.Michel’s will potentially trial a royalty basedstructure in 1H’09 similar to other <strong>RFG</strong> systems.We see medium term benefits of aligning theMichel’s model with other systems. 1H’09 willalso be the first period of acquisition synergies.Our valuation has benefited from the removal ofthe earn-out entitlement (7.6m shares) payableto previous management.Outlet growth in FY’08 was 24 below <strong>guidance</strong>(currently at 1,052 outlets). FY’09 <strong>guidance</strong>remains healthy calling for >50 new outletcommissionings.FY’09 EBIT <strong>guidance</strong> will be provided at a laterstage – Our numbers call for 22% EPS growth.Investment view:Low working capital and capex requirements,Michel’s synergies to come, good earningsdespite the sluggish retail environment, growthopportunities in China and solid free cash flowgeneration make a compelling Buy story.We upgrade our price target to $2.60/share(from $2.55) in line with our valuation, assistedby the lower forecast shares on issue in FY’09.Earnings ForecastsY/e Jun ($m) 2008A 2009F 2010F 2011FRevenue 113.4 137.5 145.4 153.8EBITDA 34.9 39.6 41.4 43.3EBIT 33.6 38.8 40.9 42.8NPAT (reported) 17.6 20.9 23.4 25.4NPAT (adjusted) 16.9 20.9 23.4 25.4Adjusted EPS (cps) 19.1 23.2 25.6 27.4EPS Growth (%) 83.0% 21.9% 10.4% 6.9%DPS (c) 8.5 11.5 12.5 14.0Dividend Yield (%) 6.3% 8.5% 9.3% 10.4%PE adj. (x) 7.1 5.8 5.3 4.9EV / EBITDA (x) 6.6 5.4 4.8 4.3EV / EBIT (x) 6.6 5.4 4.8 4.3Gearing (%) 54% 47% 40% 32%EBIT Margin (%) 30% 28% 28% 28%Interest Cover (x) 3.4 4.3 5.5 6.6Earnings AdjustmentsY/e Jun ($m) 2008A 2009F 2010FPrevious NPAT ($m) 16.4 22.0 24.4Chg in NPAT (%) 7.5% -5.1% -4.1%Previous EPS (cps) 18.8 20.9 22.8Change in EPS (%) 1.6% 11.4% 12.7%<strong>RFG</strong> Share Price / Volume$2.30$2.00$1.70$1.40$1.10$0.80$0.50011/06 6/07 1/08 8/08Contact Details<strong>RFG</strong>Scott Pullanspullan@austock.com613 8601 2640Vol (m)Thomas Hodsonthodson@austock.com613 8601 2628321Austock Equities Research www.austock.com Austock Securities Limited AFSL 244410
<strong>Retail</strong> <strong>Food</strong> <strong>Group</strong> (<strong>RFG</strong>)Price $1.35 Date1-Sep-08NFPOS 89.8 m Market Cap $120 m Model Update1-Sep-08PROFIT & LOSS ($m)KEY RATIOSY/E 30 Jun 2007A 2008A 2009F 2010F 2011F Y/E 30 Jun 2007A 2008A 2009F 2010F 2011FSales Revenue 23.6 113.4 137.5 145.4 153.8 EBITDA Margin (%) 52.4 30.8 28.8 28.5 28.2EBITDA 12.4 34.9 39.6 41.4 43.3 EBIT Margin (%) 51.6 29.6 28.2 28.1 27.9Depreciation 0.2 1.3 0.8 0.5 0.5 NPAT Margin (%) 31.8 14.9 15.2 16.1 16.5Amortisation 0.0 0.0 0.0 0.0 0.0 ROE (%) 20.4 17.8 19.4 19.1 18.3Net Interest Expense 1.4 10.0 9.0 7.5 6.5 ROA (%) 16.0 15.0 17.4 18.3 19.0PBT 10.7 23.6 29.8 33.4 36.3 NTA per share ($m) nm nm nm nm nmIncome Tax 3.2 6.7 8.9 10.0 10.9 Eff Tax Rate (%) 30.2 28.5 30.0 30.0 30.0Minorities 0.0 0.0 0.0 0.0 0.0 Interest Cover (x) 8.4 3.4 4.3 5.5 6.6NPAT (Adjusted) 7.5 16.9 20.9 23.4 25.4 Gearing (D/ E) 68% 119% 89% 66% 47%Non-Recurring Items 0.0 0.8 0.0 0.0 0.0 Gearing (D/ D+E) 41% 54% 47% 40% 32%BALANCE SHEET ($m)VALUATION PARAMETERSY/E 30 Jun 2007A 2008A 2009F 2010F 2011F Y/E 30 Jun 2007A 2008A 2009F 2010F 2011FCash 1.5 4.1 4.1 4.1 4.1 EPS (cps) 10.4 19.1 23.2 25.6 27.4Intangibles 42.0 162.8 162.8 162.8 162.8 P/E (x) 13.0 7.1 5.8 5.3 4.9PP&E 7.4 9.2 10.2 11.2 12.2Debtors & Inventory 6.1 16.4 15.4 15.0 15.9Investments - - - - - Enterprise Value ($m) 144.7 232.3 215.4 200.0 185.2Other assets 20.5 36.1 34.3 34.1 34.1 EV / Sales (x) 6.1 2.0 1.6 1.4 1.2Total Assets 77.6 228.6 226.9 227.2 229.1 EV / EBITDA (x) 11.7 6.6 5.4 4.8 4.3EV / EBIT (x) 11.9 6.9 5.6 4.9 4.3Borrow ings 26.6 116.8 99.9 84.5 69.7 Price / NTA (x) nm nm nm nm nmTrade Creditors 1.6 10.0 12.1 12.8 13.5 DPS (cps) 6.3 8.5 11.5 12.5 14.0Other Liabilities 12.7 7.2 7.2 7.2 7.2 Dividend Yield (%) 4.6 6.3 8.5 9.3 10.4Total Liabilities 40.8 134.0 119.2 104.5 90.5 Franking (%) 100.0 100.0 100.0 100.0 100.0CFPS (cps) 10.9 23.5 25.4 26.8 28.4NET ASSETS 36.8 94.6 107.7 122.7 138.6 P / CFPS (x) 12.3 5.7 5.3 5.0 4.8CASHFLOW STATEMENT ($m)Y/E 30 Jun 2007A 2008A 2009F 2010F 2011FDCF VALUATION & SENSITIVITYOperating EBITDA 12.4 34.9 39.6 41.4 43.3 Risk Free Rate 6.5%- Interest & Tax Paid 4.5 14.1 16.8 17.0 17.0 Equity Risk Premium 5.0%- Inc in Working Cap. 1.8 1.9 -3.1 -1.1 0.2 PV Perpetuity 330 Equity Beta 2.0Operating CF 6.1 18.9 25.9 25.6 26.2 Cost of Equity 16.5%- Maintenance Capex 0.3 0.6 0.8 0.5 0.5 -15.0 Total 330 D/(D+E) 40.5%Free Cashflow 5.8 18.3 25.1 25.1 25.7 Less Net Debt 96 WACC 11.6%- Ord & Pref Dividends 0.9 3.9 7.1 8.7 9.9 NPV ($m) 234 Terminal WACC 11.6%- Expansion Capex 13.4 -0.4 1.0 1.0 1.0 NPV per share $2.60 Terminal Grow th 3.0%- Borrow ings/ Other 0.0 82.6 0.0 0.0 0.0Net Cashflow -8.5 -67.7 16.9 15.4 14.8T erminal Gro wthR ateTerminal WACC11.1% 11.6% 12.1% 12.6%HALF YEAR SUMMARY 1.5% $ 2.48 $ 2.32 $ 2.18 $ 2.04H107A H207A H108A H208A 2HA-pcp 2.0% $ 2.58 $ 2.41 $ 2.25 $ 2.11Sales 12.4 11.2 50.3 63.1 464% 2.5% $ 2.68 $ 2.50 $ 2.33 $ 2.183.0% $ 2.81 $ 2.60 $ 2.42 $ 2.26EBIT 6.3 5.9 16.0 17.6 200% 3.5% $ 2.94 $ 2.72 $ 2.52 $ 2.35EBIT Margin 50.8% 52.4% 31.8% 27.9% 4.0% $ 3.10 $ 2.85 $ 2.64 $ 2.45Interest 0.8 0.7 4.4 5.6 727% GROWTH PROFILE (YoY)Pre-tax 5.5 5.2 11.6 12.0 132% Y/E 30 Jun 2007A 2008A 2009F 2010F 2011FTax 1.7 1.6 3.5 3.2 102% Sales revenue ($m) 20% 381% 21% 6% 6%NPAT 3.9 3.6 8.1 8.8 145% EBITDA ($m) 16% 183% 13% 5% 5%EBIT ($m) 16% 176% 16% 5% 5%NPAT ($m) 16% 126% 24% 12% 9%DIVISIONAL REVENUE SUMMARY EPS (cps) 12% 83% 22% 10% 7%Y/E 30 Jun 2007A 2008A 2009F 2010F 2011F DPS (cps) nm 36% 35% 9% 12%System sales 158.2 592.6 711.1 782.2 844.8DIRECTORSTony Alford MD & CEO John Cow ley ChairmanStatutory revenue 23.6 113.4 137.5 145.4 153.8 Nigel Nixon Exec DirFranchise fees 11.5 26.5 29.1 31.8 33.8 Gary Best COOInitial fees 1.9 1.9 2.3 2.5 2.0 Damien Peters CFOProduct rebates 3.2 6.2 7.2 8.0 8.9Transfer fees 0.6 0.7 0.7 0.7 0.7 MAJOR SHAREHOLDERSSundry 1.2 1.2 1.2 0.2 0.2 Tony Alford 22.5% Gotham City 7.5%Direct sales 5.3 8.0 8.5 8.6 8.8 Acorn Capital 8.5%Michel's 0.0 68.9 88.5 93.7 99.3 Thorney 10.0% Top 20 Shareholders 86.4%Austock Equities Research - <strong>Retail</strong> <strong>Food</strong> <strong>Group</strong> <strong>Ltd</strong> (<strong>RFG</strong>) Page 2
DirectoryEquities Research TeamMelbournePrivate ClientsMelbourneCraig Stranger 613 8601 2010 Head of Research, Emerging Companies Scott Young 613 8601 2674 Head of Private ClientsPaul Jensz 613 8601 2068Research Strategy, Agribusiness &ChemicalsPeter Atkinson 613 8601 2652 Client AdvisorHeath Andrews 613 8601 2644 Analyst John Axsentieff 613 8601 2042 Senior Client AdvisorJohn Buonaccorsi 613 8601 2661 Diversified Financial Services Analyst Alan Crute 613 8601 2621 Senior Client AdvisorAndrew Chambers 613 8601 2605 Infrastructure Analyst Nick Fitzsimmons 613 8601 2029 Client AdvisorAndrew Cleeland 613 8601 2065 Quantitative Data Analyst Kate Hanrahan 613 8601 2058 Client AdvisorJon Fernie 613 8601 2618 Assistant Analyst Michael Heffernan 613 8601 2053 Senior Client AdvisorDavid Grossman 613 8601 2616 Analyst Peter King 613 8601 2002 Client AdvisorThomas Hodson 613 8601 2628 Analyst Peter Mason 613 8601 2015 Client AdvisorSimon Oaten 613 8601 2671 Oil & Gas Analyst Daniel McFarlane 613 8601 2639 Client AdvisorScott Pullan 613 8601 2640 Assistant Analyst Simon Taylor 613 8601 2069 Client AdvisorMaribel Quiza 613 8601 2085 Assistant Analyst Patrick Trindade 613 8601 2669 Client AdvisorChris Wiltshire 613 8601 2680 Assistant Analyst SydneySydney Alan Birkensleigh 612 9233 9625Head of Private Clients -SydneyTim Gerrard 612 9233 9603 Resources Analyst David Dwyer 612 9233 9643 Client Advisor - OptionsHunter Hillcoat 612 9233 9604 Resources Analyst Josh Graham 612 9233 9645 Client Advisor - OptionsColin McLelland 612 9233 9635 Assistant Resources Analyst Ian Schlipalius 612 9233 9621 Senior Client AdvisorRohan Sundram 612 9233 9638 Analyst Mark Schwarz 612 9233 9642 Client Advisor - OptionsInstitutional SalesMelbourneTony Smith 613 8601 2041 Head of Institutional Research SalesLawry Bugeja 613 8601 2635 Institutional Research SalesPeter Hollick 613 8601 2011 Institutional Research SalesStuart Low 613 8601 2022 Institutional Research SalesEnzo Salvatore 613 8601 2014 Institutional Research SalesChris Walker 613 8601 2038 Institutional Research SalesPeter Ward 613 8601 2099 Institutional Research SalesMatthew White 613 8601 2624 Institutional Research SalesRobert Wood 613 8601 2031 Institutional Sales TradingSydneyLeo Borovilas 612 9233 9606 Institutional Sales TradingRoderick Clarkson 612 9233 9608 Institutional Research SalesDavid Gulson 612 9233 9637 Institutional Sales TradingDesiree Hemberger 612 9233 9652 Institutional Research SalesJock McLean 612 9233 9602 Dealers AssistantStephen Smith 612 9233 9629 Institutional Sales TradingGavin Todd 612 9233 9639 Institutional Research SalesJames Wilson 612 9233 9607 Institutional Research SalesAsiaChris Chia 612 9233 9605 Head of Asian SalesUKRoderick Clarkson 612 9233 9608 Head of UK SalesAustock Equities Research - <strong>Retail</strong> <strong>Food</strong> <strong>Group</strong> <strong>Ltd</strong> (<strong>RFG</strong>) Page 3
OFFICE LOCATIONS AND DISCLOSUREMelbourne Sydney BrisbaneLevel 1, 350 Collins StreetMelbourne VIC 3000Phone: 613 8601 2000Fax: 613 9600 1138Level 9, 56 Pitt StreetSydney NSW 2000Phone: 612 9233 9600Fax: 612 9251 9368Level 3, 100 Eagle StreetBrisbane QLD 4000Phone: 617 3361 3303Fax: 617 3229 4305Recommendation CriteriaInvestment ViewAustock Securities Investment View is based on an absolute 1-year total return equal to capital appreciation plus yield.Buy Hold Sell> 20% 20% - 5% < 5%A Speculative recommendation is when a company has limited experience from which to derive a fundamental investment view.Risk RatingAustock Securities Limited has a four tier Risk Rating System consisting of: Very High, High, Medium and Low. The Risk Rating is asubjective rating based on: Management Track Record, Forecasting Risk, Industry Risk and Financial Risk including cash flow analysis.Disclosure of Economic InterestsThe views expressed in this research report accurately reflect the personal views of Scott Pullan and Thomas Hodson about the subjectissuer and its securities. No part of the analyst’s compensation was, is or will be directly or indirectly related to any recommendation orview expressed in this report.In addition, Scott Pullan and Thomas Hodson certifies that none of the following persons holds an economic interest in the securitiescovered in this report or other securities issued by the subject issuer which may influence the report:• the author of this report;• a member of the immediate family of the author of this report ;• Austock Securities Limited;• an associate of Austock Securities Limited within the meaning of the Corporations Act.Disclaimer/DisclosureThis publication has been prepared solely for the information of the particular person to whom it was supplied by Austock SecuritiesLimited (“Austock”) AFSL 244410. This publication contains general securities advice. In preparing the advice, Austock has not takeninto account the investment objectives, financial situation and particular needs of any particular person. Before making an investmentdecision on the basis of this advice, you need to consider, with or without the assistance of a securities adviser, whether the advice in thispublication is appropriate in light of your particular investment needs, objectives and financial situation. Austock and its associates withinthe meaning of the Corporations Act may hold securities in the companies referred to in this publication. Austock believes that the adviceand information herein is accurate and reliable, but no warranties of accuracy, reliability or completeness are given (except insofar asliability under any statute cannot be excluded). No responsibility for any errors or omissions or any negligence is accepted by Austock orany of its directors, employees or agents. This publication must not to be distributed to retail investors outside of Australia.Disclosure of Corporate InvolvementAustock Securities Limited has in the previous 12 months been involved in a publicly-announced transaction involving the payment of afee to Austock Securities Limited by the corporate issuer described in this report. Austock Securities does and seeks to do business withcompanies covered in its research.An associate of Austock has in the previous 12 months been involved in a publicly-announced transaction involving the payment ofcorporate fees to Austock by <strong>Retail</strong> <strong>Food</strong> <strong>Group</strong> <strong>Ltd</strong> (<strong>RFG</strong>). The total corporate fees received by Austock and its associates from thelisted entity described in this report during the previous 12 months amount to 525,000. That remuneration might reasonably be expectedto be capable of influencing Austock in providing the general advice in this publication.Austock Corporate Finance, a related entity of Austock Securities Limited, has in the last 12 months managed a placement of shares for<strong>Retail</strong> <strong>Food</strong> <strong>Group</strong> <strong>Ltd</strong> (<strong>RFG</strong>).Austock Securities reports are available on Bloomberg, Reuters, FactSet, Capital IQ and www.austock.comAustock Equities Research - <strong>Retail</strong> <strong>Food</strong> <strong>Group</strong> <strong>Ltd</strong> (<strong>RFG</strong>) Page 4