Retail Food Group Limited
Retail Food Group Limited
Retail Food Group Limited

Create successful ePaper yourself
Turn your PDF publications into a flip-book with our unique Google optimized e-Paper software.
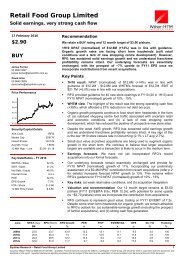
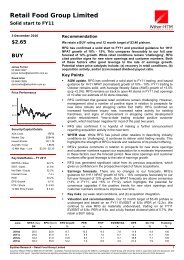
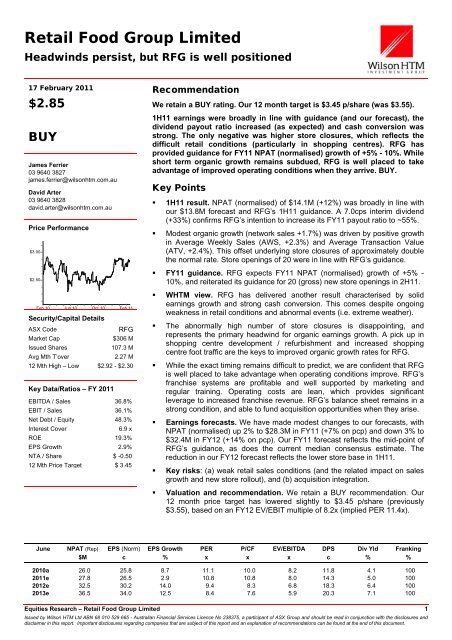
<strong>Retail</strong> <strong>Food</strong> <strong>Group</strong> <strong>Limited</strong>Headwinds persist, but RFG is well positionedDN17 February 2011$2.85BUYJames Ferrier03 9640 3827james.ferrier@wilsonhtm.com.auDavid Arter03 9640 3828david.arter@wilsonhtm.com.auPrice Performance$3.00$2.50Feb 10Jun 10Oct 10Security/Capital DetailsFeb 11ASX CodeRFGMarket Cap$306 MIssued Shares107.3 MAvg Mth T’over2.27 M12 Mth High – Low $2.92 - $2.30Key Data/Ratios – FY 2011EBITDA / Sales 36.8%EBIT / Sales 36.1%Net Debt / Equity 48.3%Interest Cover6.9 xROE 19.3%EPS Growth 2.9%NTA / Share $ -0.5012 Mth Price Target $ 3.45RecommendationWe retain a BUY rating. Our 12 month target is $3.45 p/share (was $3.55).1H11 earnings were broadly in line with guidance (and our forecast), thedividend payout ratio increased (as expected) and cash conversion wasstrong. The only negative was higher store closures, which reflects thedifficult retail conditions (particularly in shopping centres). RFG hasprovided guidance for FY11 NPAT (normalised) growth of +5% - 10%. Whileshort term organic growth remains subdued, RFG is well placed to takeadvantage of improved operating conditions when they arrive. BUY.Key Points• 1H11 result. NPAT (normalised) of $14.1M (+12%) was broadly in line withour $13.8M forecast and RFG’s 1H11 guidance. A 7.0cps interim dividend(+33%) confirms RFG’s intention to increase its FY11 payout ratio to ~55%.• Modest organic growth (network sales +1.7%) was driven by positive growthin Average Weekly Sales (AWS, +2.3%) and Average Transaction Value(ATV, +2.4%). This offset underlying store closures of approximately doublethe normal rate. Store openings of 20 were in line with RFG’s guidance.• FY11 guidance. RFG expects FY11 NPAT (normalised) growth of +5% -10%, and reiterated its guidance for 20 (gross) new store openings in 2H11.• WHTM view. RFG has delivered another result characterised by solidearnings growth and strong cash conversion. This comes despite ongoingweakness in retail conditions and abnormal events (i.e. extreme weather).• The abnormally high number of store closures is disappointing, andrepresents the primary headwind for organic earnings growth. A pick up inshopping centre development / refurbishment and increased shoppingcentre foot traffic are the keys to improved organic growth rates for RFG.• While the exact timing remains difficult to predict, we are confident that RFGis well placed to take advantage when operating conditions improve. RFG’sfranchise systems are profitable and well supported by marketing andregular training. Operating costs are lean, which provides significantleverage to increased franchise revenue. RFG’s balance sheet remains in astrong condition, and able to fund acquisition opportunities when they arise.• Earnings forecasts. We have made modest changes to our forecasts, withNPAT (normalised) up 2% to $28.3M in FY11 (+7% on pcp) and down 3% to$32.4M in FY12 (+14% on pcp). Our FY11 forecast reflects the mid-point ofRFG’s guidance, as does the current median consensus estimate. Thereduction in our FY12 forecast reflects the lower store base in 1H11.• Key risks: (a) weak retail sales conditions (and the related impact on salesgrowth and new store rollout), and (b) acquisition integration.• Valuation and recommendation. We retain a BUY recommendation. Our12 month price target has lowered slightly to $3.45 p/share (previously$3.55), based on an FY12 EV/EBIT multiple of 8.2x (implied PER 11.4x).JuneNPAT (Rep)$MEPS (Norm)cEPS Growth%PERxP/CFxEV/EBITDAxDPScDiv Yld%Franking%2010a 26.0 25.8 8.7 11.1 10.0 8.2 11.8 4.1 1002011e 27.8 26.5 2.9 10.8 10.8 8.0 14.3 5.0 1002012e 32.5 30.2 14.0 9.4 8.3 6.8 18.3 6.4 1002013e 36.5 34.0 12.5 8.4 7.6 5.9 20.3 7.1 100Equities Research – <strong>Retail</strong> <strong>Food</strong> <strong>Group</strong> <strong>Limited</strong> 1Issued by Wilson HTM Ltd ABN 68 010 529 665 - Australian Financial Services Licence No 238375, a participant of ASX <strong>Group</strong> and should be read in conjunction with the disclosures anddisclaimer in this report. Important disclosures regarding companies that are subject of this report and an explanation of recommendations can be found at the end of this document.
17 February 2011Investment viewValuation and recommendationWe retain a BUY rating, with a 12 month price target of $3.45 p/share (was $3.55).Our price target is based on an FY12 EV/EBIT of 8.2x (implied PER of 11.4x),reflecting a modest discount to the WHTM Small Industrials Index, but in line withthe EV/EBIT range we have historically used to value RFG (ie. 8.0x – 8.5x).RFG remains undervalued in our view, trading on an FY12 EV/EBIT of 6.9x andPER of 9.4x, and supported by a forecast FY11 fully franked dividend yield of 5.0%.Valuation summaryY/e: 30 June RFG FY09 FY10 FY11e FY12e FY13eShare price (current) $ $2.85- EV / EBIT x 9.1x 8.2x 8.1x 6.9x 5.3x- PER x 12.0x 11.1x 10.7x 9.4x 8.4x- Yield % 3.2% 4.1% 5.0% 6.4% 7.1%WHTM Small Industrials Index- EV / EBIT x 10.7x 11.3x 9.9x 8.6x 7.8x- PER x 12.9x 15.9x 13.7x 11.5x 10.2x- Yield % 3.4% 3.1% 4.0% 4.5% 5.3%WHTM valuation $ $3.45- EV / EBIT x 10.6x 9.6x 9.5x 8.2x 7.1x- PER x 14.6x 13.4x 13.0x 11.4x 10.1x- Yield % 2.7% 3.4% 4.1% 5.3% 5.9%- 12 month TSR % 26%Source: RFG & WHTM.We remain attracted to RFG for the following reasons:1. Strong earnings throughout difficult trading conditions.RFG continues to deliver earnings growth and strong cash conversion in spiteof difficult and volatile trading conditions, reflecting the resilience of its businessmodel and strength of its management team.2. Organic growth prospects.RFG’s short term organic growth (particularly new store rollout) continues toface headwinds, with challenging economic conditions driving reduced new siteavailability and franchisee commitment. This is further compounded by recentextreme weather events.Despite this, we retain a positive view on RFG’s long term organic growthprospects, supported by a cyclical recovery in shopping centre development (ie.new store availability), and a return to more normal retail conditions (ie.shopping centre foot traffic). This should boost growth in store numbers anddrive increased conversion of RFG franchisee enquiries, which we understandremain strong.3. Further acquisition opportunities.RFG continues to evaluate complementary retail food franchise systems, andhas considerable capacity to fund further acquisitions. The recent acquisition ofEsquires highlights RFG’s appetite and capability to execute strategicallyimportant and earnings accretive acquisitions, while the Brumby’s and Michel’sacquisitions provide a track record of successful integration.Equities Research – <strong>Retail</strong> <strong>Food</strong> <strong>Group</strong> <strong>Limited</strong> 2
17 February 20114. Increased dividends.In the absence of additional acquisition opportunities, we assess RFG has thecapacity to fund a significantly higher dividend payout ratio from its strong cashflow.Earnings revisionsA summary of the changes to our forecasts is provided in the table below.Earnings revisionsY/E: 30 June FY11e FY12e FY13eEBIT - old $M 45.9 53.5 58.8EBIT - new $M 46.7 52.2 57.4- % chg % 2% -2% -2%- % growth % 5% 12% 10%NPAT - old $M 27.8 33.5 37.8NPAT - new $M 28.3 32.4 36.5- % chg % 2% -3% -3%- % growth % 7% 14% 13%EPS - old $M 26.0 31.2 35.2EPS - new $M 26.5 30.2 34.0- % chg % 2% -3% -3%- % growth % 3% 14% 13%DPS - old $M 14.0 18.5 20.8DPS - new $M 14.3 18.3 20.3- % chg % 2% -1% -2%Source: WHTM.Key points:• RFG guidance. RFG has provided guidance for FY11 NPAT (normalised)growth of between +5% - 10%, with previous guidance for 40 (gross) new storeopenings in FY11 (20 in 2H11) remaining unchanged.• RFG reaffirmed its intention to raise its dividend payout ratio to 55% in FY11and 60% in FY12.• WHTM forecasts. We have modestly increased our FY11 NPAT forecast (i.e.+2%), primarily reflecting the higher earnings in 1H11. Our revised NPATforecast of $28.3M (+7%) reflects the mid-point of RFG’s guidance range.• Our underlying forecast assumptions in FY12 and FY13 are essentiallyunchanged, with the ~3% reduction in NPAT reflecting the lower store networkbase in 1H11 (resulting from higher than normal store closures).Equities Research – <strong>Retail</strong> <strong>Food</strong> <strong>Group</strong> <strong>Limited</strong> 3
17 February 20111H11 result reviewA summary of RFG’s 1H11 result is provided below.Earnings summaryY/E: 30 June 1H10 1H11 % Chg WHTM est % Chg vs est.Operating revenue $M 69.3 67.3 (3%) 57.5 17%EBIT $M 21.7 23.0 6% 22.9 0%- margin % 31.2% 34.2% n/a 39.9% n/aNPAT (normalised) $M 12.6 14.1 12% 13.8 2%NPAT (reported) $M 12.5 13.6 9% 13.8 (2%)EPS (normalised) cps 12.4 13.3 7% 13.0 2%DPS cps 5.25 7.0 33% 6.5 8%Operating cash flow (OCF) $M 13.8 13.4 (3%) 17.0 (21%)Net Debt $M 76.7 67.7 (12%) 64.1 6%Source: RFG & WHTM.Key points:• Income statement. 1H11 NPAT (normalised) of $14.1M (+12%) was broadly inline with our forecast and RFG’s guidance for growth at the lower end of itsoriginal 1H11 guidance range of 10% - 15%.• EBIT of $23.0M (+6%) was in line with our forecast, and was driven by modestorganic growth (ie. network sales +1.7% on pcp), contributions and synergiesfrom recent acquisitions, increased coffee demand from franchisees, improvedpurchasing (i.e. higher gross margins), and a continued focus on cost control.• The decline in revenue is due to the conversion of Michel’s franchises from awholesale-based model to a royalty-based model.• Modest organic growth (network sales +1.7%) was driven by positive growth inAverage Weekly Sales (AWS, +2.3%) and Average Transaction Value (ATV,+2.4%). This offset a reduction in store numbers. The fact that the rate of AWSgrowth was broadly similar to ATV growth confirmed that the rate of customerdecline (associated with shopping centre foot traffic) is slowing.• RFG closed 40 stores during the period, which was materially above ourforecast of 19. Of the 40 outlet closures (9 Donut King, 2 BB’s, 7 Brumby’s, 9Michel’s and 13 Big Dad’s Pies), 7 of the Big Dad’s Pies closures relate to anabnormal event of insolvency of a franchisee. Therefore, the underlying storeclosures of 33 represent approximately double the normal level of closuresexpected in any period (ie. ~15 or ~2.7% of stores). This highlights the difficulttrading environment for RFG and its franchisees.• Dividend. A fully franked 7.0cps interim dividend was declared (1H10: 5.3cps),~8% ahead of our forecast, and reflecting an increased payout ratio of 55%(1H10: 43%). RFG reconfirmed it is targeting a 55% payout ratio in FY11.• Cash flow. Operating cash flow of $13.4M (-3%) continued RFG’s strongrecord of cash conversion, but was below our forecast due higher than forecastcash interest and tax payments, and working capital. Capex of $3.3M reflectedthe purchase of a new head office.• Balance sheet. Gearing remains moderate with 1H11 net debt of $68M(ND/ND+E: 31%). Net debt was $76M as at 17 February 2011, followingcompletion of the Esquires acquisition (for $8.8M).Equities Research – <strong>Retail</strong> <strong>Food</strong> <strong>Group</strong> <strong>Limited</strong> 4
17 February 2011Earnings outlookOur revised forecasts for RFG are detailed in the table below.Profit & lossBalance sheetY/E: 30 June FY09 FY10 FY11e FY12e FY13e Y/E: 30 June FY09 FY10 FY11e FY12e FY13eSales revenue $M 142.5 133.8 129.4 105.8 111.3 Working capital $M 9.2 7.9 8.2 8.0 8.4EBITDA $M 41.9 45.6 47.7 53.4 58.4 Property, Plant & Equipment $M 3.3 2.7 10.9 10.7 10.7Dep'n & Amort'n $M (1.3) (1.1) (1.0) (1.2) (1.0) Intangibles $M 192.8 207.1 207.1 207.1 207.1EBIT $M 40.5 44.5 46.7 52.2 57.4 Other Assets / (Liabilities) $M (8.2) (6.2) 4.3 1.5 (1.5)Net interest expense $M (8.8) (7.5) (6.8) (6.5) (5.9) Total capital employed $M 197.1 211.6 230.5 227.3 224.7Tax expense $M (8.4) (10.6) (11.6) (13.3) (14.9) Net debt $M 90.1 72.7 75.0 56.3 37.8Minorities $M - - - - - Total equity $M 107.0 138.8 155.5 171.0 186.8NPAT (normalised) $M 23.3 26.5 28.3 32.4 36.5Abnormals $M 0.2 (0.5) (0.5) - - Net debt $M 90.1 72.7 75.0 56.3 37.8NPAT (reported) $M 23.5 26.0 27.8 32.4 36.5 ND / ND + E % 46% 34% 33% 25% 17%EPS (normalised) cents 23.7 25.8 26.5 30.2 34.0 ND / EBITDA x 2.2x 1.6x 1.6x 1.1x 0.6xDPS cents 9.3 11.8 14.3 18.3 20.3 EBIT / Net interest expense x 4.6x 6.0x 6.9x 8.0x 9.7xNTA p/share $ -$0.89 -$0.66 -$0.50 -$0.35 -$0.20Sales growth % 15% (6%) (3%) (18%) 5%EBITDA growth % 25% 9% 4% 12% 9% Cash flowEBIT growth % 26% 10% 5% 12% 10% Y/E: 30 June FY09 FY10 FY11e FY12e FY13eEPS growth % 44% 9% 3% 14% 13% EBITDA $M 41.9 45.6 47.7 53.4 58.4EBIT margin % 28% 33% 36% 49% 52% Less net interest expense $M (9.1) (6.7) (6.8) (6.5) (5.9)ROCE % 20% 22% 21% 23% 25% Less tax expense $M (7.9) (8.0) (12.1) (10.4) (11.9)ROE % 25% 25% 20% 21% 21% Dec / (Inc) working capital $M (2.8) 1.3 (0.2) 0.2 (0.4)Dividend payout ratio % 39% 48% 55% 60% 60% Other $M 1.5 (2.8) (0.4) - -Operating Cash Flow $M 23.6 29.4 28.2 36.7 40.2Valuation Capex $M 5.2 (0.6) (9.2) (1.0) (1.0)Y/E: 30 June FY09 FY10 FY11e FY12e FY13e Acquisition / divestment $M 0.8 (11.5) (8.8) - -Weighted avg shares M 98.4 102.9 106.9 107.4 107.5 Investing Cash Flow $M 6.0 (12.1) (18.0) (1.0) (1.0)Enterprise value $M 370.4 366.1 379.7 362.5 306.3 Equity raised $M 0.4 9.8 1.9 0.5 -EV / EBITDA x 8.8x 8.0x 8.0x 6.8x 5.2x Inc / (dec) in debt $M (21.8) (10.5) (1.0) - -EV / EBITA x 9.1x 8.2x 8.1x 6.9x 5.3x Dividends paid $M (6.8) (8.9) (14.4) (17.5) (20.7)EV / EBIT x 9.1x 8.2x 8.1x 6.9x 5.3x Other $M - - - - -PER x 12.0x 11.1x 10.7x 9.4x 8.4x Financing Cash Flow $M (28.3) (9.6) (13.5) (17.0) (20.7)Yield % 3.2% 4.1% 5.0% 6.4% 7.1% Net Cash Flow $M 1.3 7.7 (3.3) 18.7 18.5Source: RFG & WHTMEquities Research – <strong>Retail</strong> <strong>Food</strong> <strong>Group</strong> <strong>Limited</strong> 5
17 February 2011Recommendation StructureBUY: Total return +10% or more over a 12 month periodHOLD: Total return expected to be between +10% to -10% over a 12-month periodSELL: Total return expected to be -10% or more over a 12 month periodTOTAL RETURN OR TSR = capital growth in share price + expected dividend yield in that periodOther definitionsCS Coverage Suspended. Wilson HTM Ltd has suspended coverage of this company.NR Not Rated. The recommendation has been suspended temporarily. Such suspension is in line with Wilson HTM Investment<strong>Group</strong> Ltd policies in circumstances where Wilson HTM Corporate Finance Ltd is acting in an advisory capacity in a merger orstrategic transaction involving the company and in certain other situations.DisclaimerWhilst Wilson HTM Ltd believes the information contained in this communication is based on reliable information, no warranty isgiven as to its accuracy and persons relying on this information do so at their own risk. To the extent permitted by law Wilson HTMLtd disclaims all liability to any person relying on the information contained in this communication in respect of any loss or damage(including consequential loss or damage) however caused, which may be suffered or arise directly or indirectly in respect of suchinformation. Any projections contained in this communication are estimates only. Such projections are subject to market influencesand contingent upon matters outside the control of Wilson HTM Ltd and therefore may not be realised in the future.The advice contained in this document is general advice. It has been prepared without taking account of any person’s objectives,financial situation or needs and because of that, any person should, before acting on the advice, consider the appropriateness of theadvice, having regard to the client’s objectives, financial situation and needs. Those acting upon such information without firstconsulting one of Wilson HTM Ltd investment advisors do so entirely at their own risk. This report does not constitute an offer orinvitation to purchase any securities and should not be relied upon in connection with any contract or commitment whatsoever. If theadvice relates to the acquisition, or possible acquisition, of a particular financial product – the client should obtain a ProductDisclosure Statement relating to the product and consider the Statement before making any decision about whether to acquire theproduct. This communication is not to be disclosed in whole or part or used by any other party without Wilson HTM Ltd's prior writtenconsent.Disclosure of Interest. <strong>Retail</strong> <strong>Food</strong> <strong>Group</strong> <strong>Limited</strong>The Directors of Wilson HTM Ltd advise that at the date of this report they and their associates have relevant interests in <strong>Retail</strong> <strong>Food</strong><strong>Group</strong> <strong>Limited</strong>. They also advise that Wilson HTM Ltd and Wilson HTM Corporate Finance Ltd A.B.N. 65 057 547 323 and theirassociates have received and may receive commissions or fees from <strong>Retail</strong> <strong>Food</strong> <strong>Group</strong> <strong>Limited</strong> in relation to advice or dealings insecurities. Some or all of Wilson HTM Ltd authorised representatives may be remunerated wholly or partly by way of commission.In producing research reports, members of Wilson HTM Ltd Research may attend site visits and other meetings hosted by the issuersthe subject of its research reports. In some instances the costs of such site visits or meetings may be met in part or in whole by theissuers concerned if Wilson HTM Ltd considers it is appropriate and reasonable in the specific circumstances relating to the site visitor meeting.BRISBANE SYDNEY MELBOURNE GOLD COASTPh: 07 3212 1333 Ph: 02 8247 6600 Ph: 03 9640 3888 Ph: 07 5509 5500Fax: 07 3212 1399 Fax: 02 8247 6601 Fax: 03 9640 3800 Fax: 07 5509 5599DALBY HERVEY BAY TOWNSVILLEPh: 07 4660 8000 Ph: 07 4197 1600 Ph: 07 4725 5787Fax: 07 4660 4169 Fax: 07 4197 1699 Fax: 07 4725 5104Our web site: www.wilsonhtm.com.auEquities Research – <strong>Retail</strong> <strong>Food</strong> <strong>Group</strong> <strong>Limited</strong> 7