elevant and current data that each entity involved hadto offer. The selected data were <strong>the</strong>n put into anexperimental product using a new drought classificationsystem approach. The first experimental droughtmap was put out for internal review and comment inMay 1999. An e-mail exploder group was set up andis maintained at <strong>the</strong> NDMC. This allows all reviewersand authors of <strong>the</strong> product to discuss and share <strong>the</strong>irrelevant expertise, viewpoints, and concerns.The experimental tag was short-lived. The<strong>Drought</strong> Monitor quickly evolved into a more permanentproduct as a result of <strong>the</strong> efficient partnershipsbetween USDA, NOAA, NDMC, RCCs, and a fewstate climatologists. No doubt <strong>the</strong> drought in <strong>the</strong>Nor<strong>the</strong>ast in summer 1999 provided an extra incentivefor <strong>the</strong> map. The <strong>Drought</strong> Monitor was officiallylaunched at a joint White House press conferencebetween <strong>the</strong> Department of Commerce (NOAA) andUSDA in August 1999. The <strong>Drought</strong> Monitor hadgone from an experimental bi-weekly map to a fullfledgedoperational product in a few months. With <strong>the</strong>support of USDA’s chief meteorologist, <strong>the</strong> <strong>National</strong><strong>Drought</strong> <strong>Mitigation</strong> <strong>Center</strong> at <strong>the</strong> University of Nebraska–Lincolnagreed to set up and maintain <strong>the</strong>home page for <strong>the</strong> <strong>Drought</strong> Monitor (http://enso.unl.edu/monitor/monitor.html).Since its unveiling, <strong>the</strong> <strong>Drought</strong> Monitor has beenwell received by people from a wide variety ofbackgrounds and trades. The media has been especiallyquick to pick up on and use <strong>the</strong> new product toinform <strong>the</strong>ir readers and listeners. Producers, commoditybrokers, congressional delegations, and federal/stateagencies also are using this product. Theyseem to like <strong>the</strong> simplicity and ease of use of <strong>the</strong>product (see Figure 1), ra<strong>the</strong>r than having to learnabout ano<strong>the</strong>r new index.The ConceptThe <strong>Drought</strong> Monitor consists of a color map,showing which parts of <strong>the</strong> United States are sufferingfrom various degrees of drought, and accompanyingtext. The text describes <strong>the</strong> drought’s currentimpacts, future threats, and prospects for improvement.The <strong>Drought</strong> Monitor is a syn<strong>the</strong>sis of severaldifferent scientific drought indices. It is by far <strong>the</strong>most user-friendly national drought monitoring product,and it is particularly well suited for use bymainstream media because it represents state-of-<strong>the</strong>artscientific expertise and is packaged as a timely,colorful, unambiguous map. Currently, <strong>the</strong> WorldWide Web is <strong>the</strong> main means of distributing <strong>the</strong><strong>Drought</strong> Monitor. NOAA also distributes <strong>the</strong> mapthrough <strong>the</strong>ir internal channels. The obvious advantagesto using <strong>the</strong> web are that <strong>the</strong>re are no distributioncosts and <strong>the</strong> information is instantly available andalways current. The obvious disadvantage is that noteveryone has access to <strong>the</strong> web. Our focus to thispoint has been how to best disseminate <strong>the</strong> product in<strong>the</strong> most timely manner.No single definition of drought works in allcircumstances, so water planners rely on indices ordata in various forms, and most often depicted in mapor graphic form, to recognize droughts. The authorsof <strong>the</strong> <strong>Drought</strong> Monitor also rely on <strong>the</strong> input ofseveral key indices and ancillary indicators fromdifferent agencies to create <strong>the</strong> final map, which isposted each Thursday. The seven key parametersmaking up <strong>the</strong> current scheme are <strong>the</strong> Palmer <strong>Drought</strong>Index, Crop Moisture Index, CPC Soil MoistureModel (percentiles), USGS Daily Streamflow (percentiles),Percent of Normal Precipitation, USDA/NASS Topsoil Moisture (percent short and veryshort), and a remotely sensed Satellite VegetationHealth Index. The final color map summarizes all ofthis information in an easy-to-read format that showswhere drought is emerging, lingering, and subsiding.Classification: D0–D4The idea is to classify droughts on a scale fromzero to four (D0–D4), with zero indicating an abnormallydry area and four reflecting a region experiencingan exceptional drought event (likened to a droughtof record). The drought intensity categories are basedon six key indicators and many supplementary indicators.The <strong>Drought</strong> Monitor summary map andnarrative identify general drought areas, labelingdroughts by intensity from least to most intense. D0areas (abnormally dry) are ei<strong>the</strong>r drying out and16 Vol. 12, No. 1, Winter 1999–Spring 2000
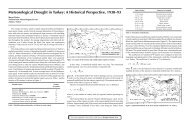
February 8, 2000 Valid 7 a.m. ESTU.S. <strong>Drought</strong> MonitorD1(A)Map focuses on widespread drought.Local conditions may vary.D rought type: used onlyw hen impacts differDEPARTMENT OF COMMERCEUNITED STATES OF AMERICAA = AgricultureW = WaterF = W ildfire dangerP lus (+) = Forecast to intensify next two weeksM inus (-) = Forecast to diminish next two weeksN o sig n = No chang e in drought classification forecastReleased Thursday, Feb. 10, 2000Figure 1. The <strong>Drought</strong> Monitor (http://enso.unl.edu/monitor/monitor.html).<strong>Drought</strong> Network News17