Did you know . . . - the National Drought Mitigation Center
Did you know . . . - the National Drought Mitigation Center
Did you know . . . - the National Drought Mitigation Center

Create successful ePaper yourself
Turn your PDF publications into a flip-book with our unique Google optimized e-Paper software.
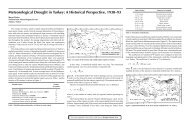
90Percentage Occurrence80706050403020100ExtremeSevereModerateMildNo <strong>Drought</strong>AgnewMcKeeFigure 3. <strong>Drought</strong> classes (McKee et al., 1995, and author) for annual rainfalls in <strong>the</strong> continental Sahel region between 1931and 1990, based on <strong>the</strong> 1961–90 averaging period.1992). Claussen (1995) summarized <strong>the</strong> statisticalapproaches for low flow determination in gaugedcatchments:• 7-day minimum (annual and 10-year minimum)• 1-day minimum (median annual)• 90% and 95% percentile exceedance• Base flow index (ratio of baseflow to total flow)The Q95(1) (<strong>the</strong> 95 percentile from <strong>the</strong> 1-dayflow duration curve) is commonly used and is calculatedhere for two drought-prone rivers, <strong>the</strong> Gade and<strong>the</strong> Bulbourne, which flow in catchments some 40km north of London. The Environment Agency(1997, p. 54) described conditions in this region:The cause of low flows in rivers is attributable to acombination of factors, which include lack of rainfall. . . seasonal fluctuations in <strong>the</strong> chalk water table, andwater abstraction . . . Over <strong>the</strong> period October 1996 toSeptember 1997, rainfall and groundwater rechargein <strong>the</strong> East Chilterns [were] 88% and 51% of <strong>the</strong> longtermaverage respectively.Figure 2 shows <strong>the</strong> 1990s increase in low flows in<strong>the</strong>se rivers and <strong>the</strong> use of <strong>the</strong> Q95 threshold todemarcate abnormal deficits (curiously, annual rainfallshave been increasing in this region during <strong>the</strong>20 th century, but <strong>the</strong> winter to summer rainfall ratiohas also increased, as low rainfalls in summer are nowmore frequent). It is suggested that climatologistsshould learn from <strong>the</strong>ir hydrologist colleagues andemploy a threshold similar to Q95 for defining meteorologicaldrought.The SPI drought thresholds recommended here<strong>the</strong>refore correspond to 5%, 10%, and 20% probabilities.Hence drought is only expected 2 years in 10 andextreme drought only 1 year in 20. This, it is believed,is a more realistic drought frequency than that used byKomuscu, and it corresponds to <strong>the</strong> employment of<strong>the</strong> term abnormal occurrence, as used in o<strong>the</strong>rbranches of environmental science.The impacts of changing <strong>the</strong> drought class boundariesare exemplified in Figure 3, based on <strong>the</strong> dataused to draw Figure 1. It is evident that little changeis made for extreme drought conditions, but <strong>the</strong> mostimportant effect is to reduce <strong>the</strong> incidence of mildmeteorological droughts. It may seem curious that<strong>the</strong>re are a large number of no-drought years (68% or86% for McKee et al. [1995] or <strong>the</strong> author’s classes,respectively) given <strong>the</strong> widespread reports of drought<strong>Drought</strong> Network News9