Chapter 8: Air pressure, Forces, and Winds - Ahlquist Web
Chapter 8: Air pressure, Forces, and Winds - Ahlquist Web
Chapter 8: Air pressure, Forces, and Winds - Ahlquist Web
- No tags were found...

You also want an ePaper? Increase the reach of your titles
YUMPU automatically turns print PDFs into web optimized ePapers that Google loves.
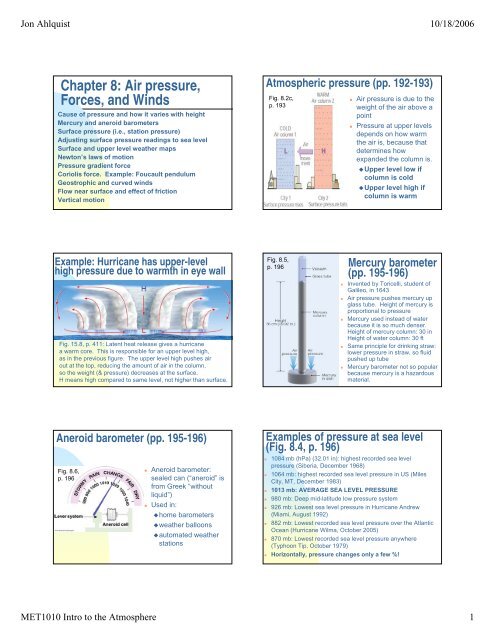
Jon <strong>Ahlquist</strong> 10/18/2006<strong>Chapter</strong> 8: <strong>Air</strong> <strong>pressure</strong>,<strong>Forces</strong>, <strong>and</strong> <strong>Winds</strong>Cause of <strong>pressure</strong> <strong>and</strong> how it varies with heightMercury <strong>and</strong> aneroid barometersSurface <strong>pressure</strong> (i.e., station <strong>pressure</strong>)Adjusting surface <strong>pressure</strong> readings to sea levelSurface <strong>and</strong> upper level weather mapsNewton’s laws of motionPressure gradient forceCoriolis force. Example: Foucault pendulumGeostrophic <strong>and</strong> curved windsFlow near surface <strong>and</strong> effect of frictionVertical motionAtmospheric <strong>pressure</strong> (pp. 192-193)Fig. 8.2c,p. 193• <strong>Air</strong> <strong>pressure</strong> is due to theweight of the air above apoint• Pressure at upper levelsdepends on how warmthe air is, because thatdetermines howexp<strong>and</strong>ed the column is.Upper level low ifcolumn is coldUpper level high ifcolumn is warmExample: Hurricane has upper-levelhigh <strong>pressure</strong> due to warmth in eye wallFig. 15.8, p. 411: Latent heat release gives a hurricanea warm core. This is responsible for an upper level high,as in the previous figure. The upper level high pushes airout at the top, reducing the amount of air in the column,so the weight (& <strong>pressure</strong>) decreases at the surface.H means high compared to same level, not higher than surface.Fig. 8.5,p. 196Mercury barometer(pp. 195-196)• Invented by Toricelli, student ofGalileo, in 1643• <strong>Air</strong> <strong>pressure</strong> pushes mercury upglass tube. Height of mercury isproportional to <strong>pressure</strong>• Mercury used instead of waterbecause it is so much denser.Height of mercury column: 30 inHeight of water column: 30 ft• Same principle for drinking straw:lower <strong>pressure</strong> in straw, so fluidpushed up tube• Mercury barometer not so popularbecause mercury is a hazardousmaterial.Aneroid barometer (pp. 195-196)Fig. 8.6,p. 196• Aneroid barometer:sealed can (“aneroid” isfrom Greek “withoutliquid”)• Used in:home barometersweather balloonsautomated weatherstationsExamples of <strong>pressure</strong> at sea level(Fig. 8.4, p. 196)• 1084 mb (hPa) (32.01 in): highest recorded sea level<strong>pressure</strong> (Siberia, December 1968)• 1064 mb: highest recorded sea level <strong>pressure</strong> in US (MilesCity, MT, December 1983)• 1013 mb: AVERAGE SEA LEVEL PRESSURE• 980 mb: Deep mid-latitude low <strong>pressure</strong> system• 926 mb: Lowest sea level <strong>pressure</strong> in Hurricane Andrew(Miami, August 1992)• 882 mb: Lowest recorded sea level <strong>pressure</strong> over the AtlanticOcean (Hurricane Wilma, October 2005)• 870 mb: Lowest recorded sea level <strong>pressure</strong> anywhere(Typhoon Tip, October 1979)• Horizontally, <strong>pressure</strong> changes only a few %!MET1010 Intro to the Atmosphere 1
Jon <strong>Ahlquist</strong> 10/18/2006Adjusting surface <strong>pressure</strong> readingsto sea level (pp. 196-198)• Pressure changes much more vertically thanhorizontally• Near the surface, going up 100 meters decreases<strong>pressure</strong> by 10 mb (1%). (Ears are an aneroidbarometer. Your ears are uncomfortable in elevatoror plane takeoff.)• Horizontally, a <strong>pressure</strong> difference of 10 mb mayoccur over 1000 km (600 miles)• Difference in surface <strong>pressure</strong> between 2 cities ismainly due to difference in elevation.• To see horizontal <strong>pressure</strong> differences, <strong>pressure</strong>readings are adjusted to common altitude: sea level.Adjusting surface <strong>pressure</strong> readingsto sea level (pp. 196-198)• Surface <strong>pressure</strong> readings are adjustedmathematically to estimate <strong>pressure</strong> at sealevel, as if the barometer were placed in amine shaft that extended down to sea level.• Removing altitude effect leaves weathereffects on air <strong>pressure</strong>• <strong>Air</strong> <strong>pressure</strong> reported on radio or TV is always“reduced to sea level.”Surface weather map (p. 198)Fig. 8.9b, p. 198• All surface <strong>pressure</strong>sare “reduced to sealevel” before plotting• Isobars (lines ofconstant <strong>pressure</strong>, iso =same, bar = <strong>pressure</strong>)are drawn every 4 mb.• Trough or ridge:elongated region of lowor high <strong>pressure</strong>• Identify a ridge <strong>and</strong> 2troughs in this figure.Upper-level charts (The material belowreplaces pp. 199-200)• Needed as most weather is above the surface• Get info mainly from weather balloons, satellites, &commercial aircraft carrying automated equipment.• Weather maps drawn for levels throughouttroposphere• Fastest wind (jet stream) is in upper troposphere(maximum at 30,000-40,000 feet, 300-200 mb)• Middle troposphere: 18,000 feet, 500 mb• Most moisture is moved in lower troposphere(maximum at 5000 - 10,000 feet, 850-700 mb)• Water vapor satellite image shown on TV depictsUPPER tropospheric moisture. Also helps showhow air is moving in cloud-free areas.Newton’s Laws of Motion (pp. 202-203)• 1 st law: Object at rest will stay at rest <strong>and</strong> an objectin motion will stay in motion as long as no force isexerted on object• 2 nd law: Force exerted on object will produce anacceleration given by a = F/m, wherea=acceleration, F=force, <strong>and</strong> m=mass of object.• Acceleration involves change of speed <strong>and</strong> ordirection• Let’s explore the forces responsible for the windPressure Gradient Force (p. 203-204)• Pressure gradient = (<strong>pressure</strong> difference) / distance• Isobar = line of constant <strong>pressure</strong>.On maps of sea level <strong>pressure</strong>, isobars are drawn every 4mb.• Pressure gradient large where isobars are close• Pressure gradient force pushes on air, causing wind to blow. Proportional to <strong>pressure</strong> gradient Points from high to low <strong>pressure</strong>Fig. 8.18p. 204WestEastOn west side of high,<strong>pressure</strong> gradient =4mb/200 km = 2mb/100kmOn east side of high,<strong>pressure</strong> gradient =4mb/400km = 1mb/100kmThus, twice the force on air onthe west side versus east side.MET1010 Intro to the Atmosphere 2
Jon <strong>Ahlquist</strong> 10/18/2006Coriolis Force (pp. 204-206)• Coriolis force: apparent force (“pseudo-force”) weobserve because we are riding on a rotating Earth.• Appears to push an object to the side withoutchanging its speed• Ball movesstraight on a nonrotatingplatform.Ball appears tocurve to side onrotating platform,even though actualpath is straight.Fig. 8.20, p. 205Coriolis Force (continued)• As we ride with rotating Earth, Coriolis force appearsto push wind toward right of direction of motion inNorthern Hemisphere, toward left in SouthernHemisphere.• The push sideways is greater:the faster the object movesthe closer to the North or South Pole the object is• Coriolis force due to Earth’s rotation is very weak.Only important when all other forces are weak.• Two slides ago, we looked at a 4 mb <strong>pressure</strong>difference across 200-400 km horizontally.That is a weak force, so Coriolis force matters.Coriolis Force (continued)• Coriolis force is too weak to matter in day-to-day life.• Very fast pitcher can throw baseball at 100 mph(45 m/s) for distance of 60.5 feet (18.4 m) frompitcher’s mound to home plate. This takes 0.4seconds. The ball is deflected to right only about0.4 mm by Coriolis force.• Puzzle: If you are locked below deck in a ship thatsails throughout ocean, how can you tell whathemisphere you are in? Supposed answer of seeingwhether water spirals down drain in clockwise orcounterclockwise direction is WRONG. Coriolisforce is about 10,000 times too weak to account foracceleration of water rotating around a drain.Coriolis example: Foucault pendulum• Foucault pendulum, seen at science museums.Long pendulum swings back <strong>and</strong> forth from highceiling. Earth rotates, but pendulum’s plane ofswing does not. Because we’re on the rotatingEarth, it is seems to us that we are stationary <strong>and</strong>that the plane of the pendulum’s swing is rotatingslowly.• Foucault pendulum knocks down dominos or littlebowling pins placed in circle around pendulum.• For more information, do a <strong>Web</strong> search on“Foucault pendulum” For example, see:http://www.calacademy.org/products/pendulum/index.htmlCoriolis example: Foucault pendulum• Coriolis force greatest atpoles, so for the fun of it,Foucault pendulum wasset up at South Pole inwinter 2001. See:http://www.physastro.sonoma.edu/people/students/baker/SouthPoleFoucault.html• Conditions forexperiment: -90°F,11,000 ft elevation,p=660mbGeostrophic wind (pp. 206-208)• Geostrophic wind: Wind in which Coriolis force is equal<strong>and</strong> opposite to <strong>pressure</strong> gradient force. Geostrophic windblows straight <strong>and</strong> is PARALLEL to isobars.• More than a few 100 m above surface, the actual wind isnearly geostrophic. (Near surface, there is also friction.)• In Northern Hemisphere, low <strong>pressure</strong> to left of wind.Application: Look at moving clouds. At cloud level, low<strong>pressure</strong> lies to left of cloud motion.GeostrophicFig. 8.23, p. 207: <strong>Air</strong> pushedfrom high toward low <strong>pressure</strong>(red arrows). Coriolis forcepushes air to right (blue arrows).Ultimately, wind (purple) blowsparallel to isobars, low <strong>pressure</strong>to left: geostrophic wind.MET1010 Intro to the Atmosphere 3
Jon <strong>Ahlquist</strong> 10/18/2006Curved winds (pp. 208-210)• If <strong>pressure</strong> gradient force (push toward low <strong>pressure</strong>)<strong>and</strong> Coriolis force (push toward right) are not quite inbalance, air is pushed to the side of the greater force<strong>and</strong> air flow moves in curved path.• Wind is parallel to isobars with low <strong>pressure</strong> to left inNorthern Hemisphere. Thus, CCW flow around low(cyclone),CW aroundhigh (anticyclone).<strong>Winds</strong> Near Surface (pp. 212-214)• Friction strongest near surface, gets weaker withheight. Typically negligible above 1000 m.• Friction slows wind, so Coriolis force (proportional towind speed) is reduced <strong>and</strong> does not match <strong>pressure</strong>gradient force’s push toward low <strong>pressure</strong>.• Because of friction, surface wind blows across isobarsat an angle from high toward low <strong>pressure</strong>.Fig. 8.29a,p. 213Fig. 8.26,p. 210Wind Summary (p. 213)• Upper level winds blow parallel to isobars.• Surface winds spiral into lows, out of highs.• In Northern Hemisphere, low <strong>pressure</strong> lies to left.<strong>Winds</strong> in Southern Hemisphere (p. 213)In Southern Hemisphere, upper level flow is still parallelto isobars, but winds have low <strong>pressure</strong> to the RIGHT ofthe direction of the wind flow. Fig. 8.30, p. 213Fig. 8.29b, p. 213As in Northern Hemisphere, winds spiral clockwiseINTO low <strong>and</strong> spiral counterclockwise OUT OF high.Vertical Motion (pp. 215-216)• Convergence: air coming togetherDivergence: air spreading out• Generally, there is convergence into surface lowwith rising air above & divergence out of surfacehigh with sinking air aboveFig. 8.33p. 243MET1010 Intro to the Atmosphere 4