Meeting Measurement Challenges For Low-Power, Pulsed, Or ...
Meeting Measurement Challenges For Low-Power, Pulsed, Or ...
Meeting Measurement Challenges For Low-Power, Pulsed, Or ...
- No tags were found...

Create successful ePaper yourself
Turn your PDF publications into a flip-book with our unique Google optimized e-Paper software.
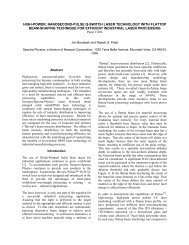
<strong>Meeting</strong> <strong>Measurement</strong> <strong>Challenges</strong><strong>For</strong> <strong>Low</strong>-<strong>Power</strong>, <strong>Pulsed</strong>,<strong>Or</strong> Modulated Light SourcesBy Denise Ullery, Sylvia Tan, and Jay Jeong, Newport Corporation (www.newport.com)Traditionally, power meters have been used for continuous-wave (CW) light sources in conjunction withphotodiode or thermopile detectors for average power measurements, while energy meters andpyroelectric detectors have been used for pulsed laser beam applications.Recent advancements in photonics technologies have broadened the applications horizon into manydifferent areas. An increasingly larger number of complex and diverse forms of light sources aredesigned into various systems and experimental setups. These complex light sources drive the need formore sensitive and versatile power measurement capabilities with unprecedented accuracy.It is particularly challenging to measure a low-average-power pulsed light source, such as an LED or alow-power laser diode, especially when the electrical designers do not know the detailed opticalcharacteristics of the light source. In addition to average optical power, many other parameters aboutthe light source are important to obtain. <strong>For</strong> instance, what does the optical signal look like? Keyinformation such as shape, frequency, and power level is needed to determine the system powerbudget and the overall system performance, as well as to validate the effectiveness of lower costcomponents. It is also important to identify which signal characteristics the detector or the detectionsystem will measure. Researchers and engineers are interested in the pulse width and pulse shape ofthe signal.Typically, one would use an optical power meter to measure the pulse energy or the average power byusing a meter and a National Institute of Standards and Technology (NIST)-calibrated detector. A biaseddetector, connected to an oscilloscope, would be used to determine the pulse shape and to measurefrequency and other temporal information.As seen in the 11/16/11 edition of the Photonics Online (www.photonicsonline.com) newsletter.
Recent developments in power meter technology have now enabled decent temporal signalmeasurements, eliminating the need for multiple instruments. One of the most advanced power metersin the market has been designed by Newport Corporation, Model 2936-C. This state-of-the-art, dualchanneloptical power meter has several sophisticated features that allow the user to achieve variousmeasurements, including frequency measurements of pulses up to 250 kHz (see figure 1).Figure 1: Newport Corporation’s optical power meter Model 2936-C with the 918D Series Photodiodes allowsvarious measurements for pulsed or modulated light input as well as continuous wave.Analog And Digital FilteringThe analog filter is an electronic, low-pass filter implemented on an optical power meter while thedigital filter averages the most recent 10, 100, 1,000, or 10,000 samples. The 2936-C optical powermeter has selectable 5 Hz, 1 kHz, 12.5 kHz, and 250 kHz low-pass filters. An optical power meter isessentially an amp meter with very low noise and high accuracy. Therefore, the proper filter settingwould make a huge impact on the signal response of the optical meter. <strong>For</strong> the best CW measurementor average power measurement of a modulated/pulsed light source, the heaviest filtering would beutilized, i.e., the 10,000 point digital filter with the 5 Hz analog filter. <strong>For</strong> a modulated or pulsed signal,an appropriate analog filter must be selected to obtain the best waveform, while the digital filter mustnot be used at all. Moreover, applying the digital and the analog filters on the pulsed or modulated inputsignal effectively averages out the signal.As seen in the 11/16/11 edition of the Photonics Online (www.photonicsonline.com) newsletter.
Statistics And Time PlotRobust statistical measurement capability, such as average, minimum, maximum, and standarddeviation is a standard feature in many optical power meters nowadays. With a photodiode detector,Newport’s 2936-C power meter can log a data point every 0.1 msec, up to 250,000 data samples perchannel, which can be easily stored on a USB thumb drive for further analysis using a spreadsheetprogram like Excel. In addition, the collected data can be viewed in a scope-like time plot directly fromthe meter display, as shown in figure 2. One can easily see whether the input signal is the expected formor if it is distorted due to overly heavy analog filtering, excessive noise, or any other external influences.Figure 2: The time plot of the data stored by the internal sample storage.Peak-To-Peak And RMS <strong>Measurement</strong>With the fast 250 kHz sampling rate of the 2936-C, modulated and pulsed signals can be measured in thePeak-to-Peak Mode. The power meter will determine the difference between the maximum and theminimum value within the given time window, which can be defined by the user. <strong>For</strong> differentmeasurement ranges of the power meter, there are trade-offs between bandwidth and noise level.Therefore, when using large bandwidth ranges, it is important that the signal being measured has largeenough power to ensure a good signal-to-noise ratio. The RMS (root mean square) measurement isanother measurement mode available in the 2936-C optical power meter.As seen in the 11/16/11 edition of the Photonics Online (www.photonicsonline.com) newsletter.
TriggeringTriggering is an especially useful feature when synchronizing the measurement with an external event.Typically, an external event generates a pulsed light output, whose value can be measured in the CW orPeak-to-Peak mode. In the Newport 2936-C power meter, it is possible to set the trigger to beresponsive to an external transistor-transistor logic (TTL) signal, the press of a soft key trigger by theuser, or to a computer command.Testing And ResultsTo illustrate some of the features and capabilities available with the Newport optical power meter, aseries of tests were run with a 50% duty cycle to compare the performance of a Newport 818-BB-21fast-biased detector to a Newport 818-SL/DB semiconductor detector. The repetition rate for all testswas 1 kHz with a pulse width of 500 μs.We connected the 818-BB-21 detector directly to channel 1 of the oscilloscope. The 818-SL/DB detectorwas connected to the 2936-C optical power meter. We then connected the analog output of the 2936-Cto channel 2 of the oscilloscope.With a 50% duty cycle we noticed nearly identical waveforms when comparing the output of the 818-BB-21 to that of the analog output of the 2936-C (see figure 3). To measure CW power, we used the2936-C digital filter set to 10,000 samples and the analog filter set to 5 Hz. The 2936-C measured a CWpower of 67.76 μW and peak-to-peak power of 134.5 μW. The peak power as measured by the 2936-C(no filters, manual range mode) is in close agreement with the theoretical peak power.As seen in the 11/16/11 edition of the Photonics Online (www.photonicsonline.com) newsletter.
Figure 3: <strong>Measurement</strong> comparison of a pulsed optical signal, 1 kHz repetition rate with a 50% duty cycle, asmeasured by a Newport Model 818-BB-21 biased detector (top waveform) and an 818-SL/DB (bottom waveform)silicon photodiode detector.In conclusion, recent improvements in optical power meter technology enable more complexmeasurements, such as power measurement of low-power pulsed or modulated light sources. Weconstructed a simple pulsed light source measurement using a Newport optical power meter and a fastbiaseddetector. Comparable pulse shapes and the resultant NIST-traceable average optical power in theCW measurement mode and the amplitude in the Peak-to-Peak mode were clearly demonstrated.As seen in the 11/16/11 edition of the Photonics Online (www.photonicsonline.com) newsletter.