Techniques in oscillatory shear rheology - Indian Institute of ...
Techniques in oscillatory shear rheology - Indian Institute of ...
Techniques in oscillatory shear rheology - Indian Institute of ...

You also want an ePaper? Increase the reach of your titles
YUMPU automatically turns print PDFs into web optimized ePapers that Google loves.
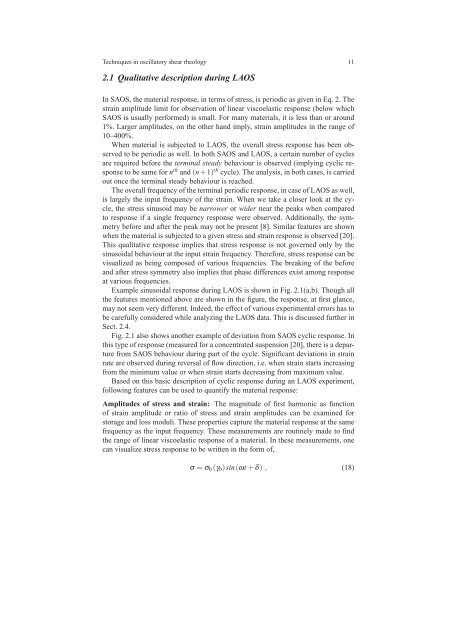
<strong>Techniques</strong> <strong>in</strong> <strong>oscillatory</strong> <strong>shear</strong> <strong>rheology</strong> 112.1 Qualitative description dur<strong>in</strong>g LAOSIn SAOS, the material response, <strong>in</strong> terms <strong>of</strong> stress, is periodic as given <strong>in</strong> Eq. 2. Thestra<strong>in</strong> amplitude limit for observation <strong>of</strong> l<strong>in</strong>ear viscoelastic response (below whichSAOS is usually performed) is small. For many materials, it is less than or around1%. Larger amplitudes, on the other hand imply, stra<strong>in</strong> amplitudes <strong>in</strong> the range <strong>of</strong>10–400%.When material is subjected to LAOS, the overall stress response has been observedto be periodic as well. In both SAOS and LAOS, a certa<strong>in</strong> number <strong>of</strong> cyclesare required before the term<strong>in</strong>al steady behaviour is observed (imply<strong>in</strong>g cyclic responseto be same for n th and (n+1) th cycle). The analysis, <strong>in</strong> both cases, is carriedout once the term<strong>in</strong>al steady behaviour is reached.The overall frequency <strong>of</strong> the term<strong>in</strong>al periodic response, <strong>in</strong> case <strong>of</strong> LAOS as well,is largely the <strong>in</strong>put frequency <strong>of</strong> the stra<strong>in</strong>. When we take a closer look at the cycle,the stress s<strong>in</strong>usoid may be narrower or wider near the peaks when comparedto response if a s<strong>in</strong>gle frequency response were observed. Additionally, the symmetrybefore and after the peak may not be present [8]. Similar features are shownwhen the material is subjected to a given stress and stra<strong>in</strong> response is observed [20].This qualitative response implies that stress response is not governed only by thes<strong>in</strong>usoidal behaviour at the <strong>in</strong>put stra<strong>in</strong> frequency. Therefore, stress response can bevisualized as be<strong>in</strong>g composed <strong>of</strong> various frequencies. The break<strong>in</strong>g <strong>of</strong> the beforeand after stress symmetry also implies that phase differences exist among responseat various frequencies.Example s<strong>in</strong>usoidal response dur<strong>in</strong>g LAOS is shown <strong>in</strong> Fig. 2.1(a,b). Though allthe features mentioned above are shown <strong>in</strong> the figure, the response, at first glance,may not seem very different. Indeed, the effect <strong>of</strong> various experimental errors has tobe carefully considered while analyz<strong>in</strong>g the LAOS data. This is discussed further <strong>in</strong>Sect. 2.4.Fig. 2.1 also shows another example <strong>of</strong> deviation from SAOS cyclic response. Inthis type <strong>of</strong> response (measured for a concentrated suspension [20], there is a departurefrom SAOS behaviour dur<strong>in</strong>g part <strong>of</strong> the cycle. Significant deviations <strong>in</strong> stra<strong>in</strong>rate are observed dur<strong>in</strong>g reversal <strong>of</strong> flow direction, i.e. when stra<strong>in</strong> starts <strong>in</strong>creas<strong>in</strong>gfrom the m<strong>in</strong>imum value or when stra<strong>in</strong> starts decreas<strong>in</strong>g from maximum value.Based on this basic description <strong>of</strong> cyclic response dur<strong>in</strong>g an LAOS experiment,follow<strong>in</strong>g features can be used to quantify the material response:Amplitudes <strong>of</strong> stress and stra<strong>in</strong>: The magnitude <strong>of</strong> first harmonic as function<strong>of</strong> stra<strong>in</strong> amplitude or ratio <strong>of</strong> stress and stra<strong>in</strong> amplitudes can be exam<strong>in</strong>ed forstorage and loss moduli. These properties capture the material response at the samefrequency as the <strong>in</strong>put frequency. These measurements are rout<strong>in</strong>ely made to f<strong>in</strong>dthe range <strong>of</strong> l<strong>in</strong>ear viscoelastic response <strong>of</strong> a material. In these measurements, onecan visualize stress response to be written <strong>in</strong> the form <strong>of</strong>,σ = σ 0 (γ 0 )s<strong>in</strong>(ωt + δ) , (18)