Statistics Terminology
Statistics Terminology
Statistics Terminology

Create successful ePaper yourself
Turn your PDF publications into a flip-book with our unique Google optimized e-Paper software.
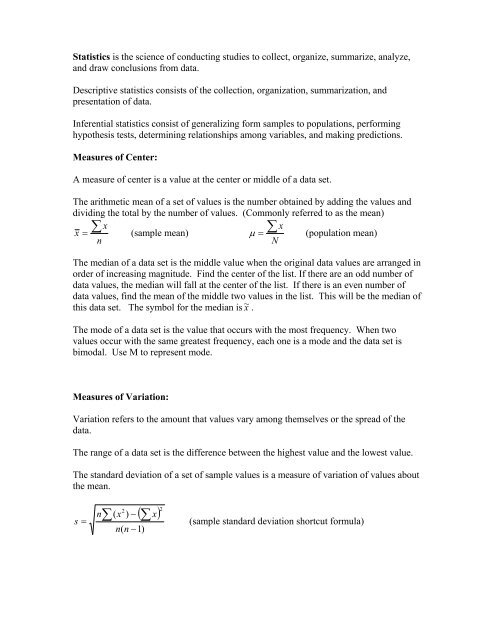
<strong>Statistics</strong> is the science of conducting studies to collect, organize, summarize, analyze,and draw conclusions from data.Descriptive statistics consists of the collection, organization, summarization, andpresentation of data.Inferential statistics consist of generalizing form samples to populations, performinghypothesis tests, determining relationships among variables, and making predictions.Measures of Center:A measure of center is a value at the center or middle of a data set.The arithmetic mean of a set of values is the number obtained by adding the values anddividing the total by the number of values. (Commonly referred to as the mean)∑ xx = (sample mean)∑ xµ = (population mean)nNThe median of a data set is the middle value when the original data values are arranged inorder of increasing magnitude. Find the center of the list. If there are an odd number ofdata values, the median will fall at the center of the list. If there is an even number ofdata values, find the mean of the middle two values in the list. This will be the median ofthis data set. The symbol for the median is x ~ .The mode of a data set is the value that occurs with the most frequency. When twovalues occur with the same greatest frequency, each one is a mode and the data set isbimodal. Use M to represent mode.Measures of Variation:Variation refers to the amount that values vary among themselves or the spread of thedata.The range of a data set is the difference between the highest value and the lowest value.The standard deviation of a set of sample values is a measure of variation of values aboutthe mean.2n∑(x ) − ( ∑x)=2s (sample standard deviation shortcut formula)n(n −1)
∑ x − µσ =(population standard deviation)NRound off rule—Carry one decimal place more than the original data set formeasure of central tendency, two places for variation. (standard deviation is aminimum of 2 decimal places)Pictures of Data:Distribution is the nature or the shape of the distribution of the data. Terms like bimodal,skewed, bell-shaped, uniform are types of distributions.A distribution of data is skewed if is not symmetric and if it extends more to one sidethan the other. (think histogram)Data skewed to the left are negatively skewed; generally the mean is to the left of themedian. Data skewed to the right are positively skewed; generally the mean is to the rightof the median.A histogram is a bar graph in which the horizontal axis represents classes and the verticalaxis represents frequencies. The heights of the bars correspond to the frequency values,and the bars are drawn adjacent to each other (without gaps unless a class has a frequencyof zero).To construct a histogram, the date must be organized into a frequency table. A frequencytable lists classes of values along with their frequency (count) of the number of values ineach class.Lower class limits are the smallest numbers that belong to each class.Upper class limits are the largest numbers that belong to each class.Class boundaries are the number used to separate classes, but do so without gaps. (usuallyadd 0.5 to upper and subtract 0.5 from lower)Class width≈highvalue − lowvalue# ofclasseslowerclass limit+ upperclasslimitClass midpoint=2
Guide for constructing frequency tables:1) Be sure that are classes are mutually exclusive (values belong to only 1 class)2) Include all classes, even if frequency is zero.3) Try to use the same width for classes.4) Select convenient numbers for class limits.5) Use between 5 and 20 classes6) The sum of the class frequencies must equal the number of original data values.Probability Distributions:A continuous random variable has infinitely many values, and those values are oftenassociated with measurements on a continuous scale with no gaps or interruptions.If a continuous random variable has a distribution with a graph that is symmetric andbell-shaped, we say it has a normal distribution.The standard normal distribution is a normal probability distribution that has a mean of 0and standard deviation of 1.Z-score (or standard score): the distance along the horizontal scale of the standard normaldistribution.A z- score represents the number of deviations from the mean the value is located. Ifvalues are converted to standard scores, then the procedure for working with all normaldistributions are the same as those for the standard normal distribution.x − Xz = (sample)σz = x − µ (population) x = µ + ( z •σ )σIf we convert values to standard scores (z scores), then the procedure for working with allnormal distributions are the same as those for the standard normal distribution.Although a z-score can be negative, the area under the curve (or the correspondingprobability) can NEVER be negative.The probability of the z-score is the area under the curve or the chance the event willhappen.
Notation:P ( a < z < b) denotes the probability that the z score is between a and b.P ( z > a) denotes the probability that the z score is greater than a.P ( z < a) denotes the probability that the z score is less than z.Using a table:1) Draw the bell-shaped curve, draw the centerline and identify the shaded regionunder the curve.2) Using the given x, find the corresponding z to find the probability that representsthe shaded area.3) Find the probability from the table (remember it represents from zero to the value)and perform the correct operation to find the required shaded region.Central Limit Theorem:Given;1) The random variable x has a distribution (which may or may not be normal) with amean µ and standard deviation σ.2) Samples all of the same size η are randomly selected from the population ofx values. (The samples are selected so that all possible samples are equally likely)Conclusions:1) The distributions of sample means x will as the sample size increase, approach anormal distribution.2) The mean of the sample means will approach the population mean µ.3) The standard deviation of the sample means will approach σ / n .Practical Rules:1) For sample of size η larger than 30, the distribution of the sample means can beapproximated reasonably well by a normal distribution. As sample size increases,the better the approximation becomes.2) If the original population is itself normally distributed, then the sample means willbe normally distributed regardless of η.Notation:If all possible random samples of size η are selected from a population with mean µ andstandard deviation σ, the mean of the sample means is denoted by µµx= µThe standard deviation of them sample means is denoted by σx,σσx= is also known as the standard error of the meannx
Hypothesis Testing:In statistics, a hypothesis is a claim or statement about a property of apopulation. A statistical hypothesis is a conjecture about a populationparameter.*This conjecture or claim may or may not be true.Two types of hypotheses:The null hypothesis, H 0, is a statistical hypothesis that states that there isno difference between a parameter and a specific value or that there is nodifference between two parameters.***The null hypothesis MUST contain a condition of equality!The alternative hypothesis, H 1, is a statistical hypothesis that states aspecific difference between a parameter and a specific values or states thatthere is a difference between two parameters.A test statistic uses the data obtained from a sample to make a decisionabout whether or not the null hypothesis should be rejected.A decision is made to reject or fail to reject the null hypotheses on thebasis is the value obtained from the test statistic. If the difference issignificant, the null hypothesis is rejected, otherwise, fail to reject the nullhypothesis.A type I error occurs if one rejects the null hypothesis when it is true.A type II error occurs if one fails to reject the null hypothesis when it isfalse.***The decision to reject or fail to reject the null hypothesis DOES NOTPROVE ANYTHING. The only way to prove anything statistically is touse the entire population.Decisions are made based on the difference between the probabilities ofthe mean obtained and the hypothesized mean.The level of significance is the maximum probability of committing a typeI error. ( α )α = 0.05 implies there is 5% chance for rejecting a true nullα = 0.01 implies there is a 1% chance of rejecting a true null
Z – testFinding the critical values:The critical value(s) separate the critical region from the non-criticalregion.The critical region or rejection region is the range of values of the testvalue that indicates there is a significant difference and that the nullhypothesis should be rejected.The non-critical region or non-rejection region is the range of values of thetest values that indicates the difference was probably due to chance andthe null hypothesis should not be rejected.Testing a Claim about a mean: large sampleAssumptions:1) The sample is a simple random sample.Careless samples are useless2) The sample is large (n > 30).Allows us to use the central limit theoremNo requirement for population to be approximatelynormally distributed3) The sample standard deviation is used of the populationstandard deviation is unknown.Traditional Method(test statistic)x − µz =σnReject the null hypothesis if the test statistic is in the critical region.Fail to reject the null hypothesis if the test statistic is not in the criticalregion.P-ValueA P-value (or probability value) is the probability of getting a value of thesample test statistic that is at least as extreme as the one found from thesample data, assuming the null hypothesis is true.Keep in mind that you are deciding whether a sample result is unusual.Small P-values (smaller that given α ) give unusual sample results andhave a significant difference. Reject the null hypothesis if the P-value isless that or equal to the significance level ( α ) .
Correlation and Regression:A correlation exists between two variables when one of them is related tothe other in some way.Assumptions:1) The sample of paired data (x, y) is a random sample.2) The pairs of (x, y) data have a bivariate normal distribution.(each x corresponds with a y to give a normal curve)A scatter plot is a graph in which the paired sample data, (x, y) are plottedwith x as the horizontal axis and y as the vertical axis.Linear Correlation Coefficient:The linear correlation coefficient, r, measures the strength of thelinear relationship between the paired x and y values of a sample.Pearson Product Moment Correlation Coefficientr =nn∑xy− ( ∑ x)( ∑y)222( ∑ x ) − ( ∑ x) n( ∑ y ) − ( ∑ y) 2n = number of pairs of datar = linear correlation coefficient for a sampleρ = linear correlation coefficient for a populationProperties of the Linear Correlation Coefficient:1) The value of r is always between -1 and 1 inclusive.2) The value of r does not change if all the values of eithervariable are converted to a different scale.3) The value of r is not affected by the choice of x or y4) R is this form measures the strength of a linear relationshiponly!Formal Hypothesis TestingUsing Method 1HH01: ρ = 0: ρ ≠ 0linear correlation when ρ ≠ 0
Test statistic for Linear Correlationt=r21−rn − 2If the absolute value of the test statistic exceeds the critical values, rejectthe null hypothesis. Otherwise fail to reject the null and there is not alinear correlation.RegressionGiven a collection of paired sample data, the regression equationy = b0 + b1xAlgebraically describes the relationship between the two variables. Thegraph of the regression equation is called the regression line or the line ofbest fit.x = independent variable or predictor variableŷ = dependent variable or response variable1∑xy− ( ∑ x)( ∑y)2n( ∑ x ) − ( ∑ x) 2nb =(slope) = y b x (y-intercept)Given a collection of paired data (x, y), ( y)b0 −1x, is the centroid. (Find theaverage of the x’s and the average of the y’s)The regression line best fits the sample data points.