Statistics Terminology
Statistics Terminology
Statistics Terminology

You also want an ePaper? Increase the reach of your titles
YUMPU automatically turns print PDFs into web optimized ePapers that Google loves.
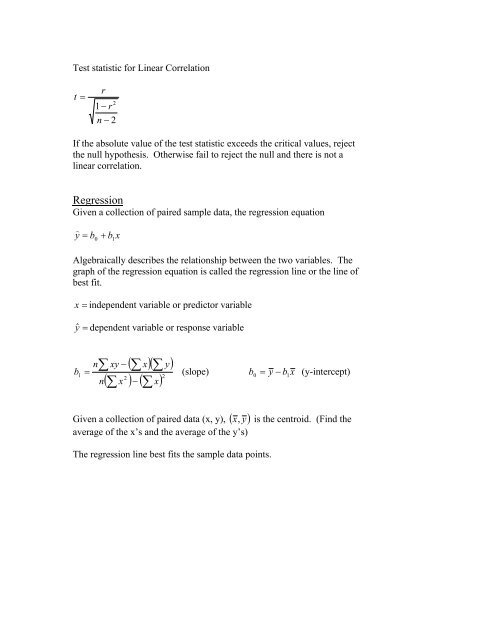
Test statistic for Linear Correlationt=r21−rn − 2If the absolute value of the test statistic exceeds the critical values, rejectthe null hypothesis. Otherwise fail to reject the null and there is not alinear correlation.RegressionGiven a collection of paired sample data, the regression equationy = b0 + b1xAlgebraically describes the relationship between the two variables. Thegraph of the regression equation is called the regression line or the line ofbest fit.x = independent variable or predictor variableŷ = dependent variable or response variable1∑xy− ( ∑ x)( ∑y)2n( ∑ x ) − ( ∑ x) 2nb =(slope) = y b x (y-intercept)Given a collection of paired data (x, y), ( y)b0 −1x, is the centroid. (Find theaverage of the x’s and the average of the y’s)The regression line best fits the sample data points.