Statistics Terminology
Statistics Terminology
Statistics Terminology

Create successful ePaper yourself
Turn your PDF publications into a flip-book with our unique Google optimized e-Paper software.
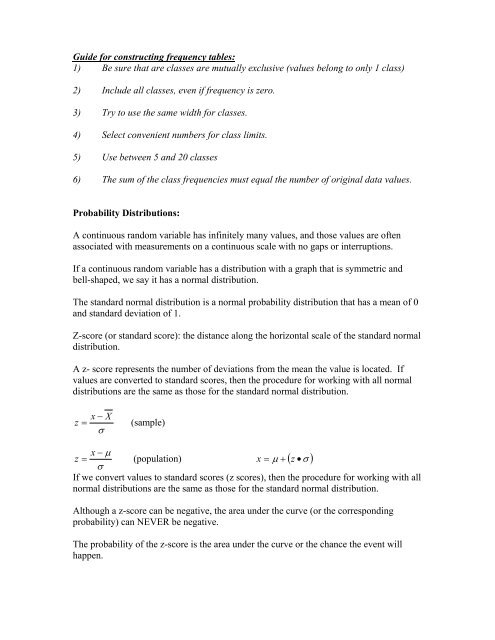
Guide for constructing frequency tables:1) Be sure that are classes are mutually exclusive (values belong to only 1 class)2) Include all classes, even if frequency is zero.3) Try to use the same width for classes.4) Select convenient numbers for class limits.5) Use between 5 and 20 classes6) The sum of the class frequencies must equal the number of original data values.Probability Distributions:A continuous random variable has infinitely many values, and those values are oftenassociated with measurements on a continuous scale with no gaps or interruptions.If a continuous random variable has a distribution with a graph that is symmetric andbell-shaped, we say it has a normal distribution.The standard normal distribution is a normal probability distribution that has a mean of 0and standard deviation of 1.Z-score (or standard score): the distance along the horizontal scale of the standard normaldistribution.A z- score represents the number of deviations from the mean the value is located. Ifvalues are converted to standard scores, then the procedure for working with all normaldistributions are the same as those for the standard normal distribution.x − Xz = (sample)σz = x − µ (population) x = µ + ( z •σ )σIf we convert values to standard scores (z scores), then the procedure for working with allnormal distributions are the same as those for the standard normal distribution.Although a z-score can be negative, the area under the curve (or the correspondingprobability) can NEVER be negative.The probability of the z-score is the area under the curve or the chance the event willhappen.