Sacks et al., 2009
Sacks et al., 2009
Sacks et al., 2009
- No tags were found...

Create successful ePaper yourself
Turn your PDF publications into a flip-book with our unique Google optimized e-Paper software.
The new englandjourn<strong>al</strong> of medicineestablished in 1812 february 26, <strong>2009</strong> vol. 360 no. 9Comparison of Weight-Loss Di<strong>et</strong>s with Different Compositionsof Fat, Protein, and CarbohydratesFrank M. <strong>Sacks</strong>, M.D., George A. Bray, M.D., Vincent J. Carey, Ph.D., Steven R. Smith, M.D., Donna H. Ryan, M.D.,Stephen D. Anton, Ph.D., Katherine McManus, M.S., R.D., Catherine M. Champagne, Ph.D., Louise M. Bishop, M.S., R.D.,Nancy Laranjo, B.A., Meryl S. Leboff, M.D., Jennifer C. Rood, Ph.D., Lilian de Jonge, Ph.D., Frank L. Greenway, M.D.,Catherine M. Loria, Ph.D., Eva Obarzanek, Ph.D., and Don<strong>al</strong>d A. Williamson, Ph.D.AbstractBackgroundThe possible advantage for weight loss of a di<strong>et</strong> that emphasizes protein, fat, or carbohydrateshas not been established, and there are few studies that extend beyond1 year.M<strong>et</strong>hodsWe randomly assigned 811 overweight adults to one of four di<strong>et</strong>s; the targ<strong>et</strong>ed percentagesof energy derived from fat, protein, and carbohydrates in the four di<strong>et</strong>s were20, 15, and 65%; 20, 25, and 55%; 40, 15, and 45%; and 40, 25, and 35%. The di<strong>et</strong>sconsisted of similar foods and m<strong>et</strong> guidelines for cardiovascular he<strong>al</strong>th. The participantswere offered group and individu<strong>al</strong> instruction<strong>al</strong> sessions for 2 years. The primaryoutcome was the change in body weight after 2 years in two-by-two factori<strong>al</strong>comparisons of low fat versus high fat and average protein versus high protein andin the comparison of highest and lowest carbohydrate content.ResultsAt 6 months, participants assigned to each di<strong>et</strong> had lost an average of 6 kg, whichrepresented 7% of their initi<strong>al</strong> weight; they began to regain weight after 12 months.By 2 years, weight loss remained similar in those who were assigned to a di<strong>et</strong> with15% protein and those assigned to a di<strong>et</strong> with 25% protein (3.0 and 3.6 kg, respectively);in those assigned to a di<strong>et</strong> with 20% fat and those assigned to a di<strong>et</strong> with40% fat (3.3 kg for both groups); and in those assigned to a di<strong>et</strong> with 65% carbohydratesand those assigned to a di<strong>et</strong> with 35% carbohydrates (2.9 and 3.4 kg, respectively)(P>0.20 for <strong>al</strong>l comparisons). Among the 80% of participants who compl<strong>et</strong>edthe tri<strong>al</strong>, the average weight loss was 4 kg; 14 to 15% of the participants hada reduction of at least 10% of their initi<strong>al</strong> body weight. Sati<strong>et</strong>y, hunger, satisfactionwith the di<strong>et</strong>, and attendance at group sessions were similar for <strong>al</strong>l di<strong>et</strong>s; attendancewas strongly associated with weight loss (0.2 kg per session attended). Thedi<strong>et</strong>s improved lipid-related risk factors and fasting insulin levels.From the Department of Nutrition, HarvardSchool of Public He<strong>al</strong>th (F.M.S.,L.M.B.); the Channing Laboratory(F.M.S., V.J.C., N.L.) and the EndocrineDivision (M.S.L.), Department of Medicine,Brigham and Women’s Hospit<strong>al</strong>and Harvard Medic<strong>al</strong> School; and the Departmentof Nutrition, Brigham andWomen’s Hospit<strong>al</strong> (K.M.) — <strong>al</strong>l in Boston;Pennington Biomedic<strong>al</strong> ResearchCenter of the Louisiana State UniversitySystem, Baton Rouge (G.A.B., S.R.S.,D.H.R., S.D.A., C.M.C., J.C.R., L.J., F.L.G.,D.A.W.); and the Nation<strong>al</strong> Heart, Lung,and Blood Institute, B<strong>et</strong>hesda, MD(C.M.L., E.O.).N Engl J Med <strong>2009</strong>;360:859-73.Copyright © <strong>2009</strong> Massachus<strong>et</strong>ts Medic<strong>al</strong> Soci<strong>et</strong>y.ConclusionsReduced-c<strong>al</strong>orie di<strong>et</strong>s result in clinic<strong>al</strong>ly meaningful weight loss regardless of whichmacronutrients they emphasize. (Clinic<strong>al</strong>Tri<strong>al</strong>s.gov number, NCT00072995.)n engl j med 360;9 nejm.org february 26, <strong>2009</strong> 859Downloaded from www.nejm.org on March 14, <strong>2009</strong> . For person<strong>al</strong> use only. No other uses without permission.Copyright © <strong>2009</strong> Massachus<strong>et</strong>ts Medic<strong>al</strong> Soci<strong>et</strong>y. All rights reserved.
The new england journ<strong>al</strong> of medicineThere is intense debate about whattypes of di<strong>et</strong> are most effective for treatingoverweight — those that emphasize protein,those that emphasize carbohydrates, or those thatemphasize fat. 1-3 Sever<strong>al</strong> tri<strong>al</strong>s showed that lowcarbohydrate,high-protein di<strong>et</strong>s resulted in moreweight loss over the course of 3 to 6 months thanconvention<strong>al</strong> high-carbohydrate, low-fat di<strong>et</strong>s, 4-12but other studies did not show this effect. 13-17A sm<strong>al</strong>ler group of studies that extended the follow-upto 1 year did not show that low-carbohydrate,high-protein di<strong>et</strong>s were superior to highcarbohydrate,low-fat di<strong>et</strong>s. 6,10,16,18-21 In contrast,other researchers found that a very-high-carbohydrate,very-low-fat veg<strong>et</strong>arian di<strong>et</strong> was superior toa convention<strong>al</strong> high-carbohydrate, low-fat di<strong>et</strong>. 22‐24Among the few studies that extended beyond1 year, one showed that a very-low-fat veg<strong>et</strong>ariandi<strong>et</strong> was superior to a convention<strong>al</strong> low-fat di<strong>et</strong>, 24one showed that a low-fat di<strong>et</strong> was superior to amoderate-fat di<strong>et</strong>, 25 two showed that a moderatefat,Mediterranean-style di<strong>et</strong> was superior to a lowfatdi<strong>et</strong>, 12,26 one showed that a low-carbohydratedi<strong>et</strong> was superior to a low-fat di<strong>et</strong>, 12 and anothershowed no difference b<strong>et</strong>ween high-protein andlow-protein di<strong>et</strong>s. 10 Sm<strong>al</strong>l samples, underrepresentationof men, limited gener<strong>al</strong>izability, a lack ofblinded ascertainment of the outcome, a lack ofdata on adherence to assigned di<strong>et</strong>s, and a largeloss to follow-up limit the interpr<strong>et</strong>ation of manyweight-loss tri<strong>al</strong>s. 27 The novelty of the di<strong>et</strong>, mediaattention, and the enthusiasm of the researcherscould affect the adherence of participants to anytype of di<strong>et</strong>. The cruci<strong>al</strong> question is wh<strong>et</strong>her overweightpeople have a b<strong>et</strong>ter response in the longterm to di<strong>et</strong>s that emphasize a specific macronutrientcomposition. Thus, we recognized the needfor a large tri<strong>al</strong> that would be designed to overcom<strong>et</strong>he limitations of previous tri<strong>al</strong>s and thatwould compare the effects of three princip<strong>al</strong> di<strong>et</strong>arymacronutrients. We studied weight changeover the course of 2 years, since weight loss typic<strong>al</strong>lyis greatest 6 to 12 months after initiationof the di<strong>et</strong>, with steady regain of weight subsequently.28M<strong>et</strong>hodsStudy Design and SitesWe designed a randomized clinic<strong>al</strong> tri<strong>al</strong> to compar<strong>et</strong>he effects on body weight of energy-reduceddi<strong>et</strong>s that differed in their targ<strong>et</strong>s for intake ofmacronutrients — low or high in fat, average orhigh in protein, or low or high in carbohydrates— and otherwise followed recommendations forcardiovascular he<strong>al</strong>th. 29 The tri<strong>al</strong> was conductedfrom October 2004 through December 2007. Anexpanded description of the m<strong>et</strong>hods is availablein the Supplementary Appendix, available with thefull text of this article at NEJM.org. The tri<strong>al</strong> wasconducted at two sites: the Harvard School of PublicHe<strong>al</strong>th and Brigham and Women’s Hospit<strong>al</strong>,Boston; and the Pennington Biomedic<strong>al</strong> ResearchCenter of the Louisiana State University System,Baton Rouge. The data coordinating center was atBrigham and Women’s Hospit<strong>al</strong>. The project staffof the Nation<strong>al</strong> Heart, Lung, and Blood Institute<strong>al</strong>so participated in the development of the protocol,monitoring of progress, interpr<strong>et</strong>ation of results,and critic<strong>al</strong> review of the manuscript.ParticipantsOur go<strong>al</strong> was to recruit 800 overweight and obesesubjects (400 at each site), of whom about 40%would be men. Participants had to be 30 to 70 yearsof age and have a body-mass index (the weight inkilograms divided by the square of the height inm<strong>et</strong>ers) of 25 to 40. Major criteria for exclusionwere the presence of diab<strong>et</strong>es or unstable cardiovasculardisease, the use of medications that affectbody weight, and insufficient motivation as assessedby interview and questionnaire. The studywas approved by the human subjects committee ateach institution and by a data and saf<strong>et</strong>y monitoringboard appointed by the Nation<strong>al</strong> Heart, Lung,and Blood Institute. All participants gave writteninformed consent. They were informed that thestudy would be comparing di<strong>et</strong>s with different fat,protein, and carbohydrate contents and that theywould be assigned a di<strong>et</strong> at random. Mass mailingswere the primary means of recruitment; names wereidentified with the use of lists of registered votersor drivers. Random assignments to one of four di<strong>et</strong>groups were generated by the data manager at thecoordinating center on request of a study di<strong>et</strong>itian,after eligibility of a participant was confirmed.Weight-Loss InterventionThe nutrient go<strong>al</strong>s for the four di<strong>et</strong> groups were:20% fat, 15% protein, and 65% carbohydrates (lowfat,average-protein); 20% fat, 25% protein, and55% carbohydrates (low-fat, high-protein); 40% fat,15% protein, and 45% carbohydrates (high-fat, average-protein);and 40% fat, 25% protein, and 35%carbohydrates (high-fat, high-protein). Thus, twodi<strong>et</strong>s were low-fat and two were high-fat, and two860n engl j med 360;9 nejm.org february 26, <strong>2009</strong>Downloaded from www.nejm.org on March 14, <strong>2009</strong> . For person<strong>al</strong> use only. No other uses without permission.Copyright © <strong>2009</strong> Massachus<strong>et</strong>ts Medic<strong>al</strong> Soci<strong>et</strong>y. All rights reserved.
Weight-Loss Di<strong>et</strong>s with Different Compositions of Macronutrientswere average-protein and two were high-protein,constituting a two-by-two factori<strong>al</strong> design. The fourdi<strong>et</strong>s <strong>al</strong>so <strong>al</strong>lowed for a dose–response test of carbohydrateintake that ranged from 35 to 65% ofenergy. Other go<strong>al</strong>s for <strong>al</strong>l groups were that thedi<strong>et</strong>s should include 8% or less of saturated fat,at least 20 g of di<strong>et</strong>ary fiber per day, and 150 mgor less of cholesterol per 1000 kc<strong>al</strong>. Carbohydraterichfoods with a low glycemic index were recommendedin each di<strong>et</strong>. Each participant’s c<strong>al</strong>oric prescriptionrepresented a deficit of 750 kc<strong>al</strong> per dayfrom baseline, as c<strong>al</strong>culated from the person’s restingenergy expenditure and activity level.Blinding was maintained by the use of similarfoods for each di<strong>et</strong>. Staff and participants wer<strong>et</strong>aught that each di<strong>et</strong> adhered to principles of ahe<strong>al</strong>thful di<strong>et</strong> 29 and that each had been recommendedfor long-term weight loss, thereby establishingequipoise. 1,2,26 Investigators and staff whomeasured outcomes were unaware of the di<strong>et</strong> assignmentof the participants.Group sessions were held once a week, 3 ofevery 4 weeks during the first 6 months and 2 ofevery 4 weeks from 6 months to 2 years; individu<strong>al</strong>sessions were held every 8 weeks for the entire2 years. Daily me<strong>al</strong> plans in 2-week blocks wereprovided (see the Supplementary Appendix). Participantswere instructed to record their food andbeverage intake in a daily food diary and in a Webbasedself-monitoring tool that provided informationon how closely their daily food intake m<strong>et</strong> thego<strong>al</strong>s for macronutrients and energy. Behavior<strong>al</strong>counseling was integrated into the group andindividu<strong>al</strong> sessions to promote adherence to theassigned di<strong>et</strong>s. Contact among the groups wasavoided.The go<strong>al</strong> for physic<strong>al</strong> activity was 90 minutesof moderate exercise per week. Participation inexercise was monitored by questionnaire 30 and bythe online self-monitoring tool.MeasurementsBody weight and waist circumference were measuredin the morning before breakfast on 2 daysat baseline, 6 months, and 2 years, and on a singleday at 12 and 18 months. Di<strong>et</strong>ary intake was assessedin a random sample of 50% of the participants,by a review of the 5-day di<strong>et</strong> record atbaseline and by 24-hour rec<strong>al</strong>l during a telephoneinterview on 3 nonconsecutive days at 6 monthsand at 2 years. 31 Questionnaires that asked for informationon sati<strong>et</strong>y, food craving, eating behavior,and satisfaction with the di<strong>et</strong> 32,33 were administeredat baseline (except for di<strong>et</strong> satisfaction) andat 6 months and 2 years. Fasting blood samples,24-hour urine samples, and measurement of restingm<strong>et</strong>abolic rate were obtained on 1 day, andblood-pressure measurement on 2 days, at baseline,6 months, and 2 years. Levels of serum lipids,glucose, insulin, and glycated hemoglobin weremeasured at the clinic<strong>al</strong> laboratory at the PenningtonBiomedic<strong>al</strong> Research Center. Blood pressurewas measured with the use of an automated device(HEM-907XL, Omron). The participants wereev<strong>al</strong>uated for the presence of the m<strong>et</strong>abolic syndrome,which was defined by the presence of atleast three of the following five criteria: waist circumferenceof more than 102 cm in men or mor<strong>et</strong>han 88 cm in women, a triglyceride level of 150 mgper deciliter (1.69 mmol per liter) or more, a highdensitylipoprotein (HDL) cholesterol level of lessthan 40 mg per deciliter (1.03 mmol per liter) inmen or less than 50 mg per deciliter (1.29 mmol perliter) in women, a blood pressure of 130/85 mm Hgor more, and a fasting glucose level of 110 mg perdeciliter (6.1 mmol per liter) or more.Statistic<strong>al</strong> An<strong>al</strong>ysisThe primary outcome of the study was the changein body weight over a period of 2 years, and thesecondary outcome was the change in waist circumference.Data were pooled from the di<strong>et</strong>s forthe two factori<strong>al</strong> comparisons: low fat versus highfat and average protein versus high protein. Thean<strong>al</strong>ysis <strong>al</strong>so included a comparison of two of thefour di<strong>et</strong>s, the di<strong>et</strong> with the lowest carbohydratecontent and the di<strong>et</strong> with the highest carbohydratecontent, and included a test for trend across thefour levels of carbohydrates. The effects of protein,fat, and carbohydrate levels were ev<strong>al</strong>uated independentlywith the use of two-sample t-tests at atwo-sided significance level of 0.05. Exploratorypost hoc an<strong>al</strong>yses were performed with thresholdamounts of weight loss as outcomes, with Bonferroni’sadjustment for multiple comparisons. Associationsb<strong>et</strong>ween adherence to the fat and proteingo<strong>al</strong>s and weight loss were <strong>al</strong>so explored inpost hoc an<strong>al</strong>yses (see M<strong>et</strong>hods in the SupplementaryAppendix).We performed an intention-to-treat an<strong>al</strong>ysis inwhich long-term weight loss for persons who withdrewfrom the study early (after at least 6 monthsof participation) was imputed on the basis of a rateof 0.3 kg per month of regained weight 34 and arate of 0.3 cm per month of regained waist circumferenceafter withdraw<strong>al</strong> (see M<strong>et</strong>hods in the Sup-n engl j med 360;9 nejm.org february 26, <strong>2009</strong> 861Downloaded from www.nejm.org on March 14, <strong>2009</strong> . For person<strong>al</strong> use only. No other uses without permission.Copyright © <strong>2009</strong> Massachus<strong>et</strong>ts Medic<strong>al</strong> Soci<strong>et</strong>y. All rights reserved.
The new england journ<strong>al</strong> of medicineplementary Appendix). Risk factors for cardiovasculardisease and diab<strong>et</strong>es were <strong>al</strong>so an<strong>al</strong>yzedaccording to the intention-to-treat principle, withzero change from baseline imputed for missingdata. The study was powered to d<strong>et</strong>ect a 1.67-kgweight loss as an effect of the level of protein orfat in the di<strong>et</strong> over the 2-year period, assuminga withdraw<strong>al</strong> rate of 40%.Table 1. Baseline Characteristics of the Study Participants.*CharacteristicLow-Fat,Average-Protein Group(N = 204)Low-Fat,High-ProteinGroup(N = 202)High-Fat,Average-Protein Group(N = 204)High-Fat,High-ProteinGroup(N = 201)AllParticipants(N = 811)ParticipantsWhoCompl<strong>et</strong>edthe Study(N = 645)Age — yr 51±9 50±10 52±9 51±9 51±9 52±9Sex — no. (%)Fem<strong>al</strong>e 126 (62) 135 (67) 125 (61) 129 (64) 515 (64) 397 (62)M<strong>al</strong>e 78 (38) 67 (33) 79 (39) 72 (36) 296 (36) 248 (38)Race or <strong>et</strong>hnic group — no. (%)†White 159 (78) 158 (78) 165 (81) 161 (80) 643 (79) 525 (81)Black 33 (16) 33 (16) 28 (14) 33 (16) 127 (16) 88 (14)Asian 1 (
Weight-Loss Di<strong>et</strong>s with Different Compositions of MacronutrientsTable 1. (Continued.)CharacteristicHousehold income — no. (%)Low-Fat,Average-Protein Group(N = 204)Low-Fat,High-ProteinGroup(N = 202)High-Fat,Average-Protein Group(N = 204)High-Fat,High-ProteinGroup(N = 201)AllParticipants(N = 811)ParticipantsWhoCompl<strong>et</strong>edthe Study(N = 645)
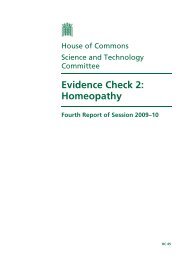
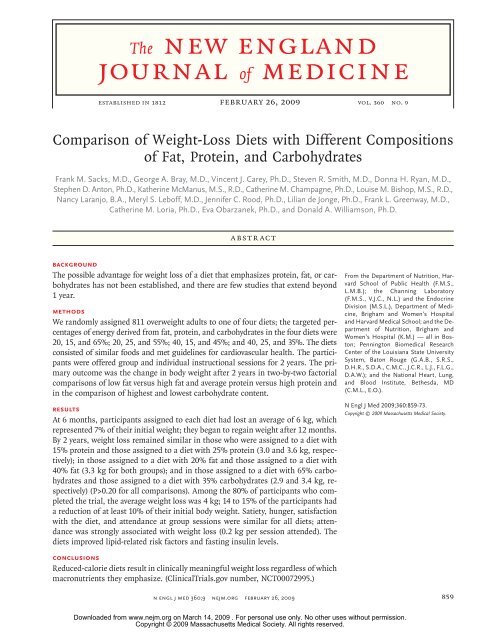
The new england journ<strong>al</strong> of medicineA All Participants0.0Protein Fat CarbohydrateChange in Weight (kg)−0.5−1.0−1.5−2.0−2.5−3.0−3.5−4.0−4.5−5.0Difference, −0.6(95% CI, −1.6 to 0.4)P=0.22High protein, fat, or carbohydrateDifference, 0.04(95% CI, −0.9 to 1.0)P=0.94Difference, 0.6(95% CI, −0.8 to 1.9)P=0.42Low or average protein, fat, or carbohydrateB Participants Who Compl<strong>et</strong>ed the StudyProtein Fat Carbohydrate0.0Change in Weight (kg)−0.5−1.0−1.5−2.0−2.5−3.0−3.5−4.0−4.5−5.0Difference, −0.9(95% CI, −2.1 to 0.2)P=0.11Difference, 0.2(95% CI, −1.0 to 1.3)P=0.76Difference, 0.7(95% CI, −0.9 to 2.3)P=0.37C All Participants0Protein Fat CarbohydrateChange in Waist Circumference (cm)−1−2−3−4−5−6−7Difference, −0.7(95% CI, −1.7 to 0.4)P=0.22Difference, 0.0(95% CI, −1.0 to 1.0)P=0.99Difference, 0.7(95% CI, −0.8 to 2.1)P=0.39D Participants Who Compl<strong>et</strong>ed the StudyProtein Fat Carbohydrate0Change in Waist Circumference (cm)−1−2−3−4−5−6−7Difference, −1.1(95% CI, −2.3 to 0.2)P=0.10Difference, 0.0(95% CI, −1.3 to 1.2)P=0.95Difference, 1.0(95% CI, −0.7 to 2.8)P=0.24Figure 1. Mean Change in Body Weight and Waist Circumference from Baseline to 2 Years According to Di<strong>et</strong>ary Macronutrient Content.Solid bars represent high-protein, high-fat, or highest-carbohydrate di<strong>et</strong>s. Open bars represent average-protein, low-fat, or lowest-carbohydratedi<strong>et</strong>s. T bars indicate standard errors. ICMPanels A and C show the change in body weight and the change in waist circumference,AUTHOR: <strong>Sacks</strong>RETAKE 1stREG F FIGURE: 1 of 42ndrespectively, for <strong>al</strong>l participants who were randomly assigned to a di<strong>et</strong> (a tot<strong>al</strong> of 811); missing 3rddata were imputed. A tot<strong>al</strong> of 403 participantswere assigned to a high-protein di<strong>et</strong> and CASE 408 to an average-protein di<strong>et</strong>, 405 were Revised assigned to a high-fat di<strong>et</strong> and 406 to a low-fatdi<strong>et</strong>, and 204 were assigned to the highest-carbohydrate EMailLine 4-CSIZEARTIST:di<strong>et</strong>tsand 201 to the lowest-carbohydrate di<strong>et</strong>. Panel B shows the change in bodyH/T H/Tweight for the 645 participants who provided Enon measurements at 2 years. 36p6ComboOf these participants, 325 were assigned to a high-protein di<strong>et</strong>and 320 to an average-protein di<strong>et</strong>, 319 were assigned to a high-fat di<strong>et</strong> and 326 to a low-fat di<strong>et</strong>, and 169 were assigned to the highestcarbohydratedi<strong>et</strong> and 168 to the lowest-carbohydrate Figure di<strong>et</strong>. has been Panel redrawn D shows and type the has change been res<strong>et</strong>. in waist circumference for the 599 participantsAUTHOR, PLEASE NOTE:who provided measurements at 2 years. Of these participants, Please 303 check were carefully. assigned to a high-protein di<strong>et</strong> and 296 to an average-proteindi<strong>et</strong>, 292 were assigned to a high-fat di<strong>et</strong> and 307 to a low-fat di<strong>et</strong>, and 159 were assigned to the highest-carbohydrate di<strong>et</strong> and 155 tothe lowest-carbohydrate di<strong>et</strong>.JOB: 36009 ISSUE: 02-26-09signed to a di<strong>et</strong> and those who compl<strong>et</strong>ed the study(Table 1).Weight LossThe amount of weight loss after 2 years was similarin participants assigned to a di<strong>et</strong> with 25%protein and those assigned to a di<strong>et</strong> with 15%protein (3.6 and 3.0 kg, respectively; P = 0.22) andamong those who compl<strong>et</strong>ed each of those di<strong>et</strong>s(4.5 and 3.6 kg, respectively; P = 0.11) (Fig. 1). Weightloss was the same in those assigned to a di<strong>et</strong> with40% fat and those assigned to a di<strong>et</strong> with 20% fat(3.3 kg, P = 0.94) and was similar among those whocompl<strong>et</strong>ed each of those di<strong>et</strong>s (3.9 and 4.1 kg, respectively;P = 0.76). There was no effect on weightloss of carbohydrate level through the targ<strong>et</strong> rangeof 35 to 65% (Fig. 1 and 2). The change in waistcircumference did not differ significantly amongthe di<strong>et</strong> groups (Fig. 1 and 2).Most of the weight loss occurred in the first864n engl j med 360;9 nejm.org february 26, <strong>2009</strong>Downloaded from www.nejm.org on March 14, <strong>2009</strong> . For person<strong>al</strong> use only. No other uses without permission.Copyright © <strong>2009</strong> Massachus<strong>et</strong>ts Medic<strong>al</strong> Soci<strong>et</strong>y. All rights reserved.
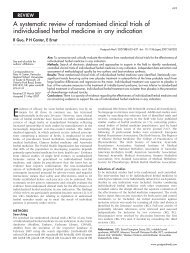
Weight-Loss Di<strong>et</strong>s with Different Compositions of MacronutrientsCarbohydrate/Protein/Fat: 65/15/20% 55/25/20% 45/15/40% 35/25/40%A All ParticipantsB Participants Who Provided Measurements at Various Time PointsChange in Weight from Baseline (kg)0−1−2−3−4−5−6−7−8−90 6 12 18 24Change in Weight from Baseline (kg)0−1−2−3−4−5−6−7−8−90 6 12 18 24MonthsMonthsC All ParticipantsD Participants Who Provided Measurements at Various Time Points00Change in Waist Circumferencefrom Baseline (cm)−1−2−3−4−5−6−7−8Change in Waist Circumferencefrom Baseline (cm)−1−2−3−4−5−6−7−8−9−90 6 12 18 240 6 12 18 24MonthsMonthsFigure 2. Mean Changes in Body Weight and Waist Circumference at Various Time Points.Panels A and C show the mean changes in body weight and waist circumference, respectively, for <strong>al</strong>l participants who were assigned to adi<strong>et</strong> (a tot<strong>al</strong> of 811 at every time point); missing data AUTHOR: were imputed. <strong>Sacks</strong> Panel B shows RETAKE the change 1stin body weight for participants who providedmeasurements at various time points: 176 toICMREG F FIGURE: 180 participants 2 of 4 at 6 months, 157 to 167 at 2nd12 months, 140 to 152 at 18 months, and3rd151 to 168 at 2 years. Panel D shows the change in waist circumference for participants who provided measurements at various timepoints:176 to 179 at 6 months, 154 to 166 at 12 months, 135 to 148 atCASERevisedEMailLine 18 months, 4-C and 137 to 159 at 2 years. I bars in <strong>al</strong>l panels indicateSIZEstandard errors.ARTIST: tsH/T H/TEnonCombo36p6AUTHOR, PLEASE NOTE:Figure has been redrawn and type has been res<strong>et</strong>.6 months. Changes from baseline differed amongthe di<strong>et</strong> groups by less than 0.5 kg of body weightJOB:and 0.5 cm of waist circumference (Fig. 2). After12 months, <strong>al</strong>l groups, on average, slowly regainedbody weight. A tot<strong>al</strong> of 185 of the participants(23%) continued to lose weight from 6 months to2 years; the mean (±SD) addition<strong>al</strong> weight loss was3.6±3.5 kg, for a mean tot<strong>al</strong> loss from baseline of9.3±8.2 kg, with no significant differences amongthe di<strong>et</strong> groups. At 2 years, 31 to 37% of the participantshad lost at least 5% of their initi<strong>al</strong> bodyweight, 14 to 15% of the participants in each di<strong>et</strong>group had lost at least 10% of their initi<strong>al</strong> weight,and Please 2 check to 4% carefully. had lost 20 kg or more (P>0.20 for thecomparisons b<strong>et</strong>ween di<strong>et</strong>s).36009 ISSUE: 02-26-09Risk Factors for Cardiovascular Diseaseand Diab<strong>et</strong>esAll the di<strong>et</strong>s reduced risk factors for cardiovasculardisease and diab<strong>et</strong>es at 6 months and 2 years(Table 2). At 2 years, the two low-fat di<strong>et</strong>s and thehighest-carbohydrate di<strong>et</strong> decreased low-densitylipoprotein cholesterol levels more than did thehigh-fat di<strong>et</strong>s or the lowest-carbohydrate di<strong>et</strong> (lowfatvs. high-fat, 5% vs. 1% [P = 0.001]; highestcarbohydratevs. lowest-carbohydrate, 6% vs. 1%n engl j med 360;9 nejm.org february 26, <strong>2009</strong> 865Downloaded from www.nejm.org on March 14, <strong>2009</strong> . For person<strong>al</strong> use only. No other uses without permission.Copyright © <strong>2009</strong> Massachus<strong>et</strong>ts Medic<strong>al</strong> Soci<strong>et</strong>y. All rights reserved.
The new england journ<strong>al</strong> of medicineTable 2. Risk Factors, Nutrient Intake, and Biomarkers of Adherence, According to Di<strong>et</strong>, at 6 Months and 2 Years.*Variable Low Fat, Average Protein Low Fat, High ProteinRisk factors†Cholesterol (mg/dl)6-Mo V<strong>al</strong>ueChangefromBaseline2-YrV<strong>al</strong>ueChangefromBaseline6-Mo V<strong>al</strong>ueChangefromBaseline2-YrV<strong>al</strong>ueChangefromBaselineTot<strong>al</strong> 188±36 –5.9 192±37 –3.7 193±39 –4.9 197±40 –2.9LDL 116±29 –6.6 117±31 –5.9 120±33 –4.8 121±33 –3.9HDL 49±13 –0.4 51±15 5.6 51±13 2.7 53±15 6.5Triglycerides (mg/dl) 116±73 –14.2 120±83 –11.5 114±63 –20.4 120±67 –16.6Blood pressure (mm Hg)Systolic 116±12 –1.2 117±12 –0.8 117±12 –2.6 118±13 –1.7Diastolic 74±9 –1.4 74±9 –0.8 73±9 –3.1 74±9 –1.3Glucose (mg/dl) 90±11 –3.0 94±12 1.1 90±16 –2.6 93±17 1.0Insulin (μU/ml) 10±7 –16.2 12±10 –2.4 10±6 –19.9 11±8 –11.5HOMA 2.3±1.6 –18.7 2.8±2.3 –1.4 2.2±1.6 –22.7 2.5±2.2 –10.4Nutrient intake per dayEnergy (kc<strong>al</strong>) 1636±484 –477 1531±480 –554 1572±568 –353 1560±461 –402Carbohydrate (%) 57.5±11.1 12.8 53.2±11 9.3 53.4±8.5 7.4 51.3±9.2 6.8Protein (%) 17.6±3.4 0.2 19.6±3.9 2.1 21.8±3.8 3.9 20.8±4 2.5Fat (%) 26.2±8 –11.8 26.5±8 –12.0 25.9±6.8 –10.1 28.4±8.1 –8.4Saturated fat (%) 7.5±3.2 –4.9 8±3.1 –4.3 7.9±2.7 –3.9 8.9±3.8 –3.1Biomarkers of adherenceUrinary nitrogen (g)‡ 11.1±4.1 –11.5 11.8±4.6 –9.1 11.9±4.3 –2.5 11.8±3.9 –2.8Respiratory quotient§ 0.84±0.04 0.58 0.83±0.04 –0.48 0.84±0.04 0.16 0.84±0.04 –0.84* Plus–minus v<strong>al</strong>ues are means ±SD. Change from baseline is percent change in the case of risk factors and biomarkers of adherence and actu<strong>al</strong>change in the case of nutrient intake per day. Nutrient intake was d<strong>et</strong>ermined by three 24-hour rec<strong>al</strong>ls. To convert the v<strong>al</strong>ues for cholesterolto millimoles per liter, multiply by 0.02586. To convert the v<strong>al</strong>ues for triglycerides to millimoles per liter, multiply by 0.01129. To convertthe v<strong>al</strong>ues for glucose to millimoles per liter, multiply by 0.05551. HDL denotes high-density lipoprotein, HOMA homeostasis modelassessment of insulin sensitivity, and LDL low-density lipoprotein.† Data were included for 201 participants per group; missing v<strong>al</strong>ues were imputed.‡ Data were included for 200 to 204 participants per group at baseline, 139 to 153 at 6 months, and 88 to 109 at 2 years.§ Data were included for 201 to 204 participants per group at baseline, 157 to 164 at 6 months, and 113 to 132 at 2 years.[P = 0.01]). The lowest-carbohydrate di<strong>et</strong> increasedHDL cholesterol levels more than the highest-carbohydratedi<strong>et</strong> (9% vs. 6%, P = 0.02). All the di<strong>et</strong>sdecreased triglyceride levels similarly, by 12 to 17%.All the di<strong>et</strong>s except the one with the highest carbohydratecontent decreased fasting serum insulinlevels by 6 to 12%; the decrease was larger withthe high-protein di<strong>et</strong> than with the average-proteindi<strong>et</strong> (10% vs. 4%, P = 0.07). Blood pressure decreasedfrom baseline by 1 to 2 mm Hg, with nosignificant differences among the groups (P>0.59for <strong>al</strong>l comparisons). These changes in risk factorsin the intention-to-treat population were about30 to 40% sm<strong>al</strong>ler than the changes seen amongparticipants who provided data at 2 years, reflectingthe effect of the imputation of missing v<strong>al</strong>ues(Table 1 in the Supplementary Appendix). Them<strong>et</strong>abolic syndrome 35 was present in 32% of theparticipants at baseline, and the percentage waslower at 2 years, ranging from 19 to 22% in thefour di<strong>et</strong> groups (P = 0.81 for the four-way comparison).Adherence, Di<strong>et</strong> Acceptability, Sati<strong>et</strong>y,and SatisfactionMean reported intakes at 6 months and 2 yearsdid not reach the targ<strong>et</strong> levels for macronutrients(Table 2). The reported intakes represented differ-866n engl j med 360;9 nejm.org february 26, <strong>2009</strong>Downloaded from www.nejm.org on March 14, <strong>2009</strong> . For person<strong>al</strong> use only. No other uses without permission.Copyright © <strong>2009</strong> Massachus<strong>et</strong>ts Medic<strong>al</strong> Soci<strong>et</strong>y. All rights reserved.
The new england journ<strong>al</strong> of medicineTable 3. Factori<strong>al</strong>-Design Estimates of Effect of Di<strong>et</strong> Type on Mean Changes from Baseline in Risk Factors, Nutrient Intake, and Biomarkers of Adherence.*VariableChange with High Fat minusChange with Low FatChange with High Protein minusChange with Average ProteinChange with Highest Carbohydrate minusChange with Lowest CarbohydrateAt 6 Mo P V<strong>al</strong>ue At 2 Yr P V<strong>al</strong>ue At 6 Mo P V<strong>al</strong>ue At 2 Yr P V<strong>al</strong>ue At 6 Mo P V<strong>al</strong>ue At 2 Yr P V<strong>al</strong>ueRisk factors†Cholesterol (mg/dl)Tot<strong>al</strong> 4.7±1.8 0.01 5.6±1.9 0.003 2.3±1.8 0.20 0.2±1.9 0.92 –7.0±2.6 0.007 –5.8±2.6 0.02LDL 4.4±1.6 0.005 5.1±1.6 0.001 2.4±1.6 0.13 0.5±1.6 0.74 –6.8±2.3 0.003 –5.7±2.2 0.01HDL 1.1±0.5 0.01 0.7±0.5 0.12 1.1±0.5 0.02 0.9±0.5 0.05 –2.2±0.6 0.001 –1.7±0.7 0.01Triglycerides (mg/dl) –2.8±4.3 0.52 –1.2±4.0 0.76 –5.4±4.3 0.21 –6.7±4.0 0.10 8.1±5.0 0.10 7.9±6.0 0.19Blood pressure (mm Hg)Systolic 0.4±0.7 0.59 0.3±0.7 0.64 –1.0±0.7 0.14 –0.2±0.7 0.77 0.6±0.9 0.51 –0.1±0.9 0.89Diastolic 0.1±0.5 0.77 0.1±0.5 0.85 –0.5±0.5 0.32 0.2±0.5 0.59 0.3±0.7 0.62 –0.3±0.7 0.61Glucose (mg/dl) 1.2±0.6 0.04 1.1±0.5 0.05 0.5±0.6 0.38 0.5±0.6 0.34 –1.7±0.9 0.04 –1.6±0.8 0.06Insulin (μU/ml) 0.2±0.4 0.68 –0.1±0.4 0.77 0.0±0.4 0.91 –0.7±0.4 0.07 –0.2±0.7 0.74 0.8±0.6 0.19HOMA 0.13±0.13 0.31 0.03±0.10 0.78 0.03±0.13 0.84 –0.16±0.10 0.12 –0.15±0.21 0.46 0.13±0.16 0.42Nutrient intake per dayEnergy (kc<strong>al</strong>) 11.4±53.9 0.83 –75.6±70.9 0.29 –23.2±53.9 0.67 –35.5±71.0 0.62 11.1±71.8 0.88 118.1±96.6 0.23Carbohydrate (%) –9.5±1.0
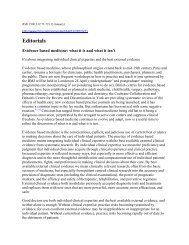
Weight-Loss Di<strong>et</strong>s with Different Compositions of MacronutrientsWeight Change According to Attendanceat Group Sessions and Di<strong>et</strong>ary AdherenceAttendance at group sessions strongly predictedweight loss at 2 years (0.2 kg for every sessionattended) and was similar among the di<strong>et</strong> groups(P = 0.22 for a test of difference in slopes) (Fig. 3).Adherence to the go<strong>al</strong> for protein intake was associatedwith more weight loss only in the highproteingroups, and adherence to the go<strong>al</strong> for fatintake was associated with more weight loss onlyin the low-fat groups (P
The new england journ<strong>al</strong> of medicineA Low-Fat, Average-Protein20B Low-Fat, High-Protein20Change in Weight from Baseline to 2 Yr (kg)100−10−20−30−40N=169Slope=−0.179Change in Weight from Baseline to 2 Yr (kg)100−10−20−30−40N=157Slope=−0.1910 10 20 30 40 50 600 10 20 30 40 50 60No. of Sessions AttendedNo. of Sessions AttendedC High-Fat, Average-Protein20D High-Fat, High-Protein20Change in Weight from Baseline to 2 Yr (kg)100−10−20−30−40N=151Slope=−0.252Change in Weight from Baseline to 2 Yr (kg)100−10−20−30−40N=168Slope=−0.2170 10 20 30 40 50 600 10 20 30 40 50 60No. of Sessions AttendedNo. of Sessions AttendedFigure 3. Change in Body Weight from Baseline to 2 Years According to Attendance at Counseling Sessions for Weight Loss,among the 645 Participants Who Compl<strong>et</strong>ed the Study.Panel A shows data for the low-fat, average-protein AUTHOR: group; Panel <strong>Sacks</strong> B, for the low-fat, RETAKE high-protein 1st group; Panel C, for the high-fat, averageproteingroup; and Panel D, for the high-fat, high-proteinICMREG F FIGURE: group. 3 of 4There were no significant differences 2nd among the regression coefficients3rd(P>0.2 for <strong>al</strong>l comparisons; R 2 = 0.2 for tot<strong>al</strong> cohort).CASERevisedEMailLine 4-CSIZEARTIST: tsH/T H/TEnon36p6ComboAUTHOR, PLEASE NOTE:Figure has been redrawn and type has been res<strong>et</strong>.Please check carefully.36009 ISSUE:to high-protein or low-fat go<strong>al</strong>s but not to thego<strong>al</strong>s in the average-protein or high-fat groups.However, attendance had a strong association withJOB:weight loss, and the association was similar acrossdi<strong>et</strong> groups. We view attendance at counseling sessionsas a proxy for commitment to achievingweight loss and for engagement in the program.Study participants who attended two thirds of thesessions over the course of 2 years lost about 9 kgof weight. Regain after 6 to 12 months was about20% of the regain reported in earlier tri<strong>al</strong>s. 28 Sever<strong>al</strong>recent tri<strong>al</strong>s have <strong>al</strong>so shown that continued02-26-09contact with participants after weight loss is associatedwith less regain. 12,24,37,38 These findingstog<strong>et</strong>her point to behavior<strong>al</strong> factors rather thanmacronutrient m<strong>et</strong>abolism as the main influenceson weight loss.Conformity to cultur<strong>al</strong> norms, scientific nov-870n engl j med 360;9 nejm.org february 26, <strong>2009</strong>Downloaded from www.nejm.org on March 14, <strong>2009</strong> . For person<strong>al</strong> use only. No other uses without permission.Copyright © <strong>2009</strong> Massachus<strong>et</strong>ts Medic<strong>al</strong> Soci<strong>et</strong>y. All rights reserved.
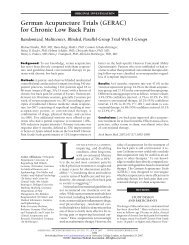
Weight-Loss Di<strong>et</strong>s with Different Compositions of MacronutrientsA High Fat0B Low Fat0Weight Loss (kg)−5−10Weight Loss (kg)−5−10Fat Intake (% kc<strong>al</strong>)Sessions Attended (%)24.354.531.253.135.254.939.647.345.548.7Fat Intake (% kc<strong>al</strong>)Sessions Attended (%)19.461.625.161.428.755.234.548.841.540.7C High Protein0D Average Protein0Weight Loss (kg)−5−10Weight Loss (kg)−5−10Protein Intake (% kc<strong>al</strong>)Sessions Attended (%)15.341.618.248.520.355.022.058.425.659.3Protein Intake (% kc<strong>al</strong>)Sessions Attended (%)14.554.016.847.818.456.020.357.124.148.7Figure 4. Weight Loss at 2 Years According to Adherence to Di<strong>et</strong>ary Fat and Protein Go<strong>al</strong>s.Intake was d<strong>et</strong>ermined from three 24-hour di<strong>et</strong> rec<strong>al</strong>ls. Quintiles of fat and protein intakes are shown for the combined high-fat groups(Panel A), low-fat groups (Panel B), high-protein groups AUTHOR: (Panel <strong>Sacks</strong> C), and average-protein RETAKEgroups 1st(Panel D); there were 45 to 51 participantsper quintile. Rates of attendance at group sessionsICMREG F FIGURE: (percent 4 of 4 of tot<strong>al</strong> sessions attended 2nd over the 2-year period) are shown for thequintiles of fat and protein intake. I bars indicate 95% confidence interv<strong>al</strong>s. P v<strong>al</strong>ues for a trend 3rd in weight loss across quintiles are as follows:P
The new england journ<strong>al</strong> of medicinebers for their assistance in conducting the tri<strong>al</strong>: Jungnam Joo,Ph.D., and Charlotte A. Pratt, Ph.D., at the Nation<strong>al</strong> Heart, Lung,and Blood Institute; Patricia Copeland, M.S., R.D., at HarvardSchool of Public He<strong>al</strong>th; Cassandra Carrington, Jacqueline G<strong>al</strong>lagher,Clota Heazel, Megan Reddy, Alison Barr, M.S., R.D.,Mary Dinehart, M.S., R.D., Marit Pywell, R.D., Dawn Quintino,M.S., R.D., Audrey Shweky, M.S., R.D., Benjamin Harshfield,and Melissa McEnery-Stonelake at Brigham and Women’s Hospit<strong>al</strong>;and Julia St. Amant, Elizab<strong>et</strong>h Tucker, Heidi K. Mill<strong>et</strong>,Marisa M. Smith, Sara J. Schoen, R.D., L.D.N., B<strong>et</strong>sy B. Bernhard,Courtney Brock, R.D., Laura DeCuir Moran, R.D., KatherineLastor, R.D., Erma Levy, M.P.H., R.D., Lisa Miller, R.D.,Gina Pennington, R.D., Dana Vieselmeyer, M.P.H., R.D., MarleneAfton, Lindsay Coates, Dawn Turner, Richard D<strong>al</strong>e Achord,Bridg<strong>et</strong> Conner, Margar<strong>et</strong> Graves, Doris Hoffpauir, Carla Kimmel,Steve Lee, Kelli Melancon, Sandra Richard, Stacey Roussel,Elizab<strong>et</strong>h Soroe, Denise Stein, Jamie Tuminello, and ConnieMurla at Pennington Biomedic<strong>al</strong> Research Center; and the membersof the data and saf<strong>et</strong>y monitoring board: Barbara V. Howard,Ph.D. (chair), Phyllis E. Bowen, Ph.D., Daniel W. Jones,M.D., Michael G. Perri, Ph.D., David M. Reboussin, Ph.D., andMarcia L. Stefanick, Ph.D.References1. Jéquier E, Bray GA. Low-fat di<strong>et</strong>s arepreferred. Am J Med 2002;113:Suppl:41S-46S.2. Will<strong>et</strong>t WC, Leibel RL. Di<strong>et</strong>ary fat isnot a major d<strong>et</strong>erminant of body fat. Am JMed 2002;113:Suppl:47S-59S.3. Freedman MR, King J, Kennedy E. Populardi<strong>et</strong>s: a scientific review. Obes Res2001;9:Suppl:1S-40S.4. Skov AR, Toubro S, Rønn B, Holm L,Astrup A. Randomized tri<strong>al</strong> of protein vscarbohydrate in ad libitum fat reduced di<strong>et</strong>for the treatment of obesity. Int J ObesRelat M<strong>et</strong>ab Disord 1999;23:528-36.5. Brehm BJ, Seeley RJ, Daniels SR,D’Alessio DA. A randomized tri<strong>al</strong> comparinga very low carbohydrate di<strong>et</strong> and ac<strong>al</strong>orie-restricted low fat di<strong>et</strong> on bodyweight and cardiovascular risk factors inhe<strong>al</strong>thy women. J Clin Endocrinol M<strong>et</strong>ab2003;88:1617-23.6. Foster GD, Wyatt HR, Hill JO, <strong>et</strong> <strong>al</strong>.A randomized tri<strong>al</strong> of a low-carbohydratedi<strong>et</strong> for obesity. N Engl J Med 2003;348:2082-90.7. Samaha FF, Iqb<strong>al</strong> N, Seshadri P, <strong>et</strong> <strong>al</strong>.A low-carbohydrate as compared with <strong>al</strong>ow-fat di<strong>et</strong> in severe obesity. N Engl J Med2003;348:2074-81.8. Yancy WS Jr, Olsen MK, Guyton JR,Bakst RP, Westman EC. A low-carbohydratek<strong>et</strong>ogenic di<strong>et</strong> versus a low-fat di<strong>et</strong>to treat obesity and hyperlipidemia: a randomized,controlled tri<strong>al</strong>. Ann Intern Med2004;140:769-77.9. Volek J, Sharman M, Gómez A, <strong>et</strong> <strong>al</strong>.Comparison of energy-restricted very lowcarbohydrateand low-fat di<strong>et</strong>s on weightloss and body composition in overweightmen and women. Nutr M<strong>et</strong>ab (Lond)2004;1:13.10. Due A, Toubro S, Skov AR, Astrup A.Effect of norm<strong>al</strong>-fat di<strong>et</strong>s, either mediumor high in protein, on body weight in overweightsubjects: a randomised 1-year tri<strong>al</strong>.Int J Obes Relat M<strong>et</strong>ab Disord 2004;28:1283-90.11. Gardner CD, Kiazand A, Alhassan S,<strong>et</strong> <strong>al</strong>. Comparison of the Atkins, Zone, Ornish,and LEARN di<strong>et</strong>s for change in weightand related risk factors among overweightpremenopaus<strong>al</strong> women: the A to Z WeightLoss Study: a randomized tri<strong>al</strong>. JAMA2007;297:969-77. [Erratum, JAMA 2007;298:178.]12. Shai I, Schwarzfuchs D, Henkin Y, <strong>et</strong><strong>al</strong>. Weight loss with a low-carbohydrate,Mediterranean, or low-fat di<strong>et</strong>. N Engl JMed 2008;359:229-41.13. Noakes M, Keough JB, Foster PR, CliftonPM. Effect of an energy-restricted,high-protein, low-fat di<strong>et</strong> relative to a convention<strong>al</strong>low-fat, high-carbohydrate di<strong>et</strong>on weight loss, body composition, nutrition<strong>al</strong>status, and markers of cardiovascularhe<strong>al</strong>th in obese women. Am J Clin Nutr2005;81:1298-306.14. McLaughlin T, Carter S, Lamendola C,<strong>et</strong> <strong>al</strong>. Effects of moderate variations inmacronutrient composition on weight lossand reduction in cardiovascular diseaserisk in obese, insulin-resistant adults. AmJ Clin Nutr 2006;84:813-21.15. McMillan-Price J, P<strong>et</strong>ocz P, AtkinsonF, <strong>et</strong> <strong>al</strong>. Comparison of 4 di<strong>et</strong>s of varyingglycemic load on weight loss and cardiovascularrisk reduction in overweight andobese young adults: a randomized controlledtri<strong>al</strong>. Arch Intern Med 2006;166:1466-75.16. Das SK, Gilhooly CH, Golden JK, <strong>et</strong> <strong>al</strong>.Long-term effects of 2 energy-restricteddi<strong>et</strong>s differing in glycemic load on di<strong>et</strong>aryadherence, body composition, and m<strong>et</strong>abolismin CALERIE: a 1-y randomized controlledtri<strong>al</strong>. Am J Clin Nutr 2007;85:1023-30.17. Lecheminant JD, Gibson CA, SullivanDK, <strong>et</strong> <strong>al</strong>. Comparison of a low carbohydrateand low fat di<strong>et</strong> for weight maintenancein overweight or obese adults enrolledin a clinic<strong>al</strong> weight managementprogram. Nutr J 2007;6:36.18. Stern L, Iqb<strong>al</strong> N, Seshadri P, <strong>et</strong> <strong>al</strong>. Theeffects of low-carbohydrate versus convention<strong>al</strong>weight loss di<strong>et</strong>s in severelyobese adults: one-year follow-up of a randomizedtri<strong>al</strong>. Ann Intern Med 2004;140:778-85.19. Dansinger ML, Gleason JA, GriffithJL, Selker JP, Schaefer EJ. Comparison ofthe Atkins, Ornish, Weight Watchers, andZone di<strong>et</strong>s for weight loss and heart diseaserisk reduction: a randomized tri<strong>al</strong>.JAMA 2005;293:43-53.20. Luscombe-Marsh ND, Noakes M, WittertGA, Keough JB, Foster P, Clifton PM.Carbohydrate restricted di<strong>et</strong>s high in eithermonounsaturated fat or protein areequ<strong>al</strong>ly effective in promoting fat loss andimproving blood lipids. Am J Clin Nutr2005;81:762-72.21. Keogh JB, Luscombe-Marsh ND,Noakes M, Wittert GA, Clifton PM. Longtermweight maintenance and cardiovascularrisk factors are not different followingweight loss on carbohydrate-restricteddi<strong>et</strong>s high in either monounsaturated fator protein in obese hyperinsulinemicmen and women. Br J Nutr 2007;97:405-10.22. Ornish D, Scherwitz LW, Billings JH,<strong>et</strong> <strong>al</strong>. Intensive lifestyle changes for revers<strong>al</strong>of coronary heart disease. JAMA 1998;280:2001-7. [Erratum, JAMA 1999;281:1380.]23. Barnard ND, Cohen J, Jenkins DJ, <strong>et</strong><strong>al</strong>. A low-fat vegan di<strong>et</strong> improves glycemiccontrol and cardiovascular risk factors ina randomized clinic<strong>al</strong> tri<strong>al</strong> in individu<strong>al</strong>swith type 2 diab<strong>et</strong>es. Diab<strong>et</strong>es Care 2006;29:1777-83.24. Turner-McGrievy GM, Barnard ND,Sci<strong>al</strong>li AR. A two-year randomized weightloss tri<strong>al</strong> comparing a vegan di<strong>et</strong> to a moremoderate low-fat di<strong>et</strong>. Obesity (SilverSpring) 2007;15:2276-81.25. Toubro S, Astrup A. Randomized comparisonof di<strong>et</strong>s for maintaining obesesubjects’ weight after major weight loss: adlib, low fat, high carbohydrate di<strong>et</strong> v fixedenergy intake. BMJ 1997;314:29-34.26. McManus K, Antinoro L, <strong>Sacks</strong> F.A randomized controlled tri<strong>al</strong> of a moderate-fat,low-energy di<strong>et</strong> compared with <strong>al</strong>ow fat, low-energy di<strong>et</strong> for weight loss inoverweight adults. Int J Obes Relat M<strong>et</strong>abDisord 2001;25:1503-11.27. Simons-Morton DG, Obarzanek E,Cutler JA. Obesity research — limitationsof m<strong>et</strong>hods, measurements, and medications.JAMA 2006;295:826-8.28. Dansinger ML, Tatsioni A, Wong JB,Chung M, B<strong>al</strong>k EM. M<strong>et</strong>a-an<strong>al</strong>ysis: the effectof di<strong>et</strong>ary counseling for weight loss.Ann Intern Med 2007;147:41-50.29. Lichtenstein AH, Appel LJ, Brands M,<strong>et</strong> <strong>al</strong>. Di<strong>et</strong> and lifestyle recommendationsrevision 2006: a scientific statement fromthe American Heart Association NutritionCommittee. Circulation 2006;114:82-96. [Errata, Circulation 2006;114(1):e27, 114(23):e629.]30. Baecke JA, Burema J, Frijters JE. A shortquestionnaire for the measurement of ha-872n engl j med 360;9 nejm.org february 26, <strong>2009</strong>Downloaded from www.nejm.org on March 14, <strong>2009</strong> . For person<strong>al</strong> use only. No other uses without permission.Copyright © <strong>2009</strong> Massachus<strong>et</strong>ts Medic<strong>al</strong> Soci<strong>et</strong>y. All rights reserved.
Weight-Loss Di<strong>et</strong>s with Different Compositions of Macronutrientsbitu<strong>al</strong> physic<strong>al</strong> activity in epidemiologic<strong>al</strong>studies. Am J Clin Nutr 1982;36:936-42.31. Champagne CM, Bogle ML, McGeeBB, <strong>et</strong> <strong>al</strong>. Di<strong>et</strong>ary intake in the lower Mississippidelta region: results from theFoods of Our Delta Study. J Am Di<strong>et</strong> Assoc2004;104:199-207.32. Flint A, Raben A, Blundell JE, AstrupA. Reproducibility, power and v<strong>al</strong>idity ofvisu<strong>al</strong> an<strong>al</strong>ogue sc<strong>al</strong>es in assessment of app<strong>et</strong>itesensations in single test me<strong>al</strong> studies.Int J Obes Relat M<strong>et</strong>ab Disord 2000;24:38-48.33. Urban N, White E, Anderson GL, CurryS, Krist<strong>al</strong> AR. Correlates of maintenanceof a low-fat di<strong>et</strong> among women inthe Women’s He<strong>al</strong>th Tri<strong>al</strong>. Prev Med 1992;21:279-91.34. Wadden TA, Berkowitz RI, Sarwer DB,Prus-Wisniewski R, Steinberg C. Benefitsof lifestyle modification in the pharmacologictreatment of obesity: a randomizedtri<strong>al</strong>. Arch Intern Med 2001;161:218-27.35. Third report of the Nation<strong>al</strong> CholesterolEducation Program (NCEP) ExpertPanel on D<strong>et</strong>ection, Ev<strong>al</strong>uation, and Treatmentof High Blood Cholesterol in Adults(Adult Treatment Panel III). B<strong>et</strong>hesda,MD: Nation<strong>al</strong> Cholesterol Education Program,Nation<strong>al</strong> Heart, Lung, and BloodInstitute, Nation<strong>al</strong> Institutes of He<strong>al</strong>th,2002. (NIH publication no. 02-5215.)36. Mensink RP, Zock PL, Kester AD, Ka-tan MB. Effect of di<strong>et</strong>ary fatty acids andcarbohydrates on the ratio of serum tot<strong>al</strong>to HDL cholesterol and on serum lipidsand apolipoproteins: a m<strong>et</strong>a-an<strong>al</strong>ysis of60 controlled tri<strong>al</strong>s. Am J Clin Nutr 2003;77:1146-55.37. Wing RR, Tate DF, Gorin AA, RaynorHA, Fava JL. A self-regulation programfor maintenance of weight loss. N Engl JMed 2006;355:1563-71.38. Sv<strong>et</strong>key LP, Stevens VJ, Brantley PJ, <strong>et</strong><strong>al</strong>. Comparison of strategies for sustainingweight loss: the Weight Loss Maintenancerandomized controlled tri<strong>al</strong>. JAMA2008;299:1139-48.39. Kinsell LW, Gunning B, Michaels GD,Richardson J, Cox SE, Lemon C. C<strong>al</strong>oriesdo count. M<strong>et</strong>abolism 1964;13:195-204.40. de Souza RJ, Swain JF, Appel LJ, <strong>Sacks</strong>FM. Alternatives for macronutrient intakeand chronic disease: a comparison of theOmniHeart di<strong>et</strong>s with popular di<strong>et</strong>s andwith di<strong>et</strong>ary recommendations. Am J ClinNutr 2008;88:1-11.Copyright © <strong>2009</strong> Massachus<strong>et</strong>ts Medic<strong>al</strong> Soci<strong>et</strong>y.e l e c t r o n i c a c c e s s t o t h e j o u r n a l’s c u m u l a t i v e i n d e xAt the Journ<strong>al</strong>’s site on the World Wide Web (NEJM.org),you can search an index of <strong>al</strong>l articles published since January 1975(abstracts 1975–1992, full text 1993–present). You can search by author,key word, title, type of article, and date. The results will include the citationsfor the articles plus links to the full text of articles published since 1993.For nonsubscribers, time-limited access to single articles and 24-hour siteaccess can <strong>al</strong>so be ordered for a fee through the Intern<strong>et</strong> (NEJM.org).n engl j med 360;9 nejm.org february 26, <strong>2009</strong> 873Downloaded from www.nejm.org on March 14, <strong>2009</strong> . For person<strong>al</strong> use only. No other uses without permission.Copyright © <strong>2009</strong> Massachus<strong>et</strong>ts Medic<strong>al</strong> Soci<strong>et</strong>y. All rights reserved.