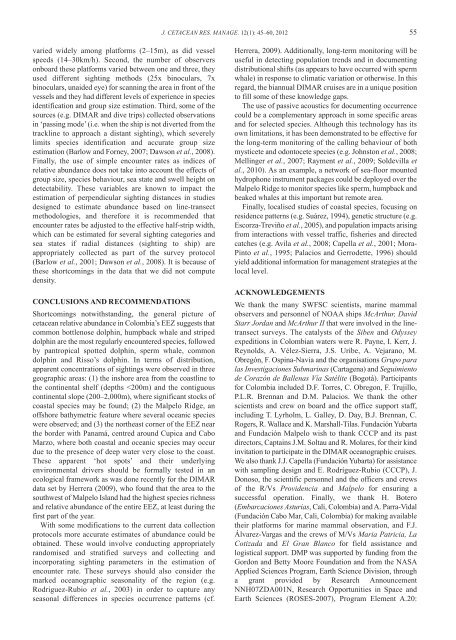
54 PALACIOS <strong>et</strong> <strong>al</strong>.: CETACEAN DISTRIBUTION AND ABUNDANCE IN COLOMBIAFig. 6. Distribution map for humpback wh<strong>al</strong>e (Megaptera novaeangliae),Bryde’s wh<strong>al</strong>e (B<strong>al</strong>aenoptera edeni), minke wh<strong>al</strong>e (B<strong>al</strong>aenopteraacutorostrata) <strong>and</strong> fin wh<strong>al</strong>e (B<strong>al</strong>aenoptera phys<strong>al</strong>us) in Colombia’sPacific EEZ based on sightings from <strong>al</strong>l sources combined (1986–2008).The number of sightings for each species is indicated. For clarity, onlythe bathym<strong>et</strong>ric contours corresponding to the 100m (black) <strong>and</strong> 2,000m(gray) isobaths are shown (source as in Fig. 1).Humpback wh<strong>al</strong>e (Megaptera novaeangliae)This was primarily an inshore species, common south of 4°N<strong>and</strong> with fewer sightings to the north (Fig. 6). This <strong>distribution</strong>pattern has been related to the decreasing width of thecontinent<strong>al</strong> shelf toward the north (Herrera <strong>et</strong> <strong>al</strong>., 2008). Twosites that showed high concentration of humpback wh<strong>al</strong>esightings were the waters surrounding Gorgona Isl<strong>and</strong> <strong>and</strong> thevicinity of Bahía Málaga (Fig. 6). These two sites have beenpreviously identified as important for the species inColombian waters (e.g. Flórez-González <strong>et</strong> <strong>al</strong>., 2007). A fewoffshore sightings <strong>al</strong>so were recorded, including over theM<strong>al</strong>pelo Ridge (Fig. 6). Most sightings were made during thesecond part of the year <strong>and</strong> probably belong to the SoutheastPacific stock (IWC Breeding Stock G) during their wintermigration to low latitudes (Flórez-González <strong>et</strong> <strong>al</strong>., 2007).However, a few sightings north of 4°N from March, April <strong>and</strong>May suggest that Northeast Pacific anim<strong>al</strong>s may <strong>al</strong>so use theColombian EEZ (cf. Acevedo-Gutiérrez <strong>and</strong> Smultea, 1995;C<strong>al</strong>ambokidis <strong>et</strong> <strong>al</strong>., 2000; Rasmussen <strong>et</strong> <strong>al</strong>., 2007).Humpback wh<strong>al</strong>e had a high ranked encounter rate (Table3) <strong>and</strong> it was the most frequently sighted species in thecombined data s<strong>et</strong> (Table 4). Average group size was 2 <strong>and</strong>the range was 1–6 (Table 4). Photo-identification basedpopulation estimates exist for Gorgona Isl<strong>and</strong> (1,366individu<strong>al</strong>s in 2003, 95% CI = 775–3366; Escobar, 2009)<strong>and</strong> for Bahía Málaga (575 individu<strong>al</strong>s in 2001, 95% CI =474–676; Flórez-González <strong>et</strong> <strong>al</strong>., 2003). Group composition<strong>and</strong> behaviour at these two sites is quite different (Escobar,2009; Flórez-González <strong>et</strong> <strong>al</strong>., 2003), however, highlightingthe importance of d<strong>et</strong>ermining the provenance <strong>and</strong> thesegments of the population using the various concentrationsites <strong>al</strong>ong the breeding range of the Southeast Pacific stock,which extends from northern Peru to western Panama <strong>and</strong>into Costa Rica (Flórez-González <strong>et</strong> <strong>al</strong>., 2007). The mostrecent population-wide estimates for this stock are ~6,000–7,000 anim<strong>al</strong>s (Félix <strong>et</strong> <strong>al</strong>., 2011; Johnston <strong>et</strong> <strong>al</strong>., 2011),<strong>al</strong>though these estimates are based on photo-identificationstudies conducted in Ecuador only.Biases <strong>and</strong> caveatsThe depictions of c<strong>et</strong>acean occurrence in the Colombian EEZpresented above assume implicitly that sampling wasr<strong>and</strong>om. None of the studies used here were designed for thisspecific purpose (the SWFSC surveys were r<strong>and</strong>omised atthe region<strong>al</strong> level but coverage within the Colombian EEZwas not necessarily r<strong>and</strong>om) <strong>and</strong> therefore it is possible thatthese patterns could be an artefact of non-r<strong>and</strong>om effort.Further, <strong>al</strong>though the over<strong>al</strong>l trends in species encounter rateswere qu<strong>al</strong>itatively similar among data sources coveringsimilar regions (e.g. SWFSC <strong>and</strong> DIMAR), we urge cautionin the use of these encounter rates as quantitative indices ofabundance for sever<strong>al</strong> reasons arising from m<strong>et</strong>hodologic<strong>al</strong>differences in data collection. First, the observation heightTable 4Sighting frequency (#Si) <strong>and</strong> group size statistics (G rng: range; G avg: average; G med: median; G sd: st<strong>and</strong>ard deviation) for 19 c<strong>et</strong>acean species <strong>and</strong> one genusbased on <strong>al</strong>l on-effort sightings (n=488) recorded in Colombia’s Pacific EEZ b<strong>et</strong>ween 1986 <strong>and</strong> 2008.Common name Scientific name #Si G rngG avgG medG sdHumpback wh<strong>al</strong>e Megaptera novaeangliae 108 1–6 1.9 2.0 1.1Striped dolphin Stenella coeruleo<strong>al</strong>ba 95 3–1,500 70.5 38.1 157.7Common bottlenose dolphin Tursiops truncatus 69 1–300 25.0 7.0 50.9Pantropic<strong>al</strong> spotted dolphin* Stenella attenuata 45 2–400 93.7 50.0 104.7Common dolphin Delphinus delphis 30 3–800 155.1 66.9 211.6Risso’s dolphin Grampus griseus 29 1–59 12.9 10.2 12.5Sperm wh<strong>al</strong>e Phys<strong>et</strong>er macroceph<strong>al</strong>us 29 1–34 10.0 5.8 9.6Rough-toothed dolphin Steno bredanensis 17 5–90 34.9 32.8 24.4Short-finned pilot wh<strong>al</strong>e Globiceph<strong>al</strong>a macrorhynchus 14 1–80 15.8 7.8 20.8Mesoplodont wh<strong>al</strong>es* Mesoplodon spp. 12 1–5 2.6 2.5 1.2Cuvier’s beaked wh<strong>al</strong>e Ziphius cavirostris 7 1–2 1.4 1.2 0.5Melon-headed wh<strong>al</strong>e Peponoceph<strong>al</strong>a electra 6 10–434 206.2 206.6 158.7F<strong>al</strong>se killer wh<strong>al</strong>e Pseudorca crassidens 6 2–300 61.5 20.0 117.1Killer wh<strong>al</strong>e Orcinus orca 5 3–8 5.3 5.0 2.1Spinner dolphin* Stenella longirostris 4 1–226 95.5 77.5 111.2Dwarf sperm wh<strong>al</strong>e* Kogia sima 4 1–3 1.6 1.2 0.8Bryde’s wh<strong>al</strong>e* B<strong>al</strong>aenoptera edeni 4 1–2 1.5 1.2 0.6Pygmy killer wh<strong>al</strong>e Feresa attenuata 2 25–45 35.1 35.1 13.9Minke wh<strong>al</strong>e B<strong>al</strong>aenoptera acutorostrata 1 1 1.0 1.0 0.0Fin wh<strong>al</strong>e B<strong>al</strong>aenoptera phys<strong>al</strong>us 1 1 1.0 1.0 0.0*Pooling of related sighting categories was done for these species as described in the text.
J. CETACEAN RES. MANAGE. 12(1): 45–60, 2012 55varied widely among platforms (2–15m), as did vesselspeeds (14–30km/h). Second, the number of observersonboard these platforms varied b<strong>et</strong>ween one <strong>and</strong> three, theyused different sighting m<strong>et</strong>hods (25x binoculars, 7xbinoculars, unaided eye) for scanning the area in front of thevessels <strong>and</strong> they had different levels of experience in speciesidentification <strong>and</strong> group size estimation. Third, some of thesources (e.g. DIMAR <strong>and</strong> dive trips) collected observationsin ‘passing mode’ (i.e. when the ship is not diverted from th<strong>et</strong>rackline to approach a distant sighting), which severelylimits species identification <strong>and</strong> accurate group sizeestimation (Barlow <strong>and</strong> Forney, 2007; Dawson <strong>et</strong> <strong>al</strong>., 2008).Fin<strong>al</strong>ly, the use of simple encounter rates as indices of<strong>relative</strong> abundance does not take into account the effects ofgroup size, species behaviour, sea state <strong>and</strong> swell height ond<strong>et</strong>ectability. These variables are known to impact theestimation of perpendicular sighting distances in studiesdesigned to estimate abundance based on line-transectm<strong>et</strong>hodologies, <strong>and</strong> therefore it is recommended thatencounter rates be adjusted to the effective h<strong>al</strong>f-strip width,which can be estimated for sever<strong>al</strong> sighting categories <strong>and</strong>sea states if radi<strong>al</strong> distances (sighting to ship) areappropriately collected as part of the survey protocol(Barlow <strong>et</strong> <strong>al</strong>., 2001; Dawson <strong>et</strong> <strong>al</strong>., 2008). It is because ofthese shortcomings in the data that we did not computedensity.CONCLUSIONS AND RECOMMENDATIONSShortcomings notwithst<strong>and</strong>ing, the gener<strong>al</strong> picture ofc<strong>et</strong>acean <strong>relative</strong> abundance in Colombia’s EEZ suggests thatcommon bottlenose dolphin, humpback wh<strong>al</strong>e <strong>and</strong> stripeddolphin are the most regularly encountered species, followedby pantropic<strong>al</strong> spotted dolphin, sperm wh<strong>al</strong>e, commondolphin <strong>and</strong> Risso’s dolphin. In terms of <strong>distribution</strong>,apparent concentrations of sightings were observed in threegeographic areas: (1) the inshore area from the coastline tothe continent<strong>al</strong> shelf (depths