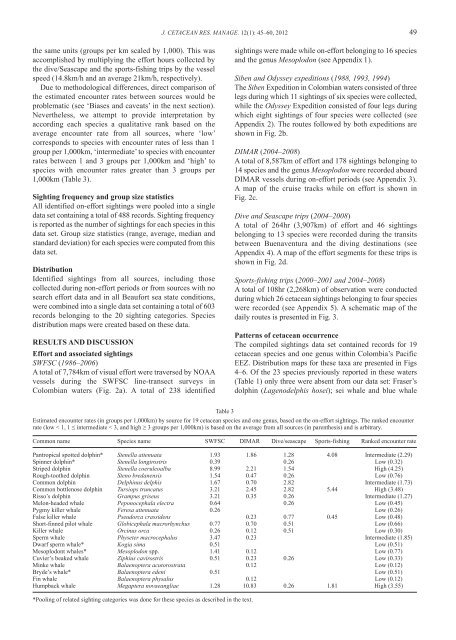
48 PALACIOS <strong>et</strong> <strong>al</strong>.: CETACEAN DISTRIBUTION AND ABUNDANCE IN COLOMBIAb<strong>et</strong>ween oceanographic stations at a cruising speed of 10 knotsfor M<strong>al</strong>pelo (18.5km/h) <strong>and</strong> 11 knots (20.4km/h) forProvidencia. An observer searches for c<strong>et</strong>aceans from theship’s flying bridge 10m above the water line using 7x50mmh<strong>and</strong>-held binoculars. Unlike the SWFSC surveys, sightingsare not closed on, so only c<strong>et</strong>acean groups that occur near theship can be identified <strong>and</strong> counted. For this reason, searcheffort is only conducted under acceptable viewing conditions(no fog or rain, <strong>and</strong> in Beaufort sea states of 3 or less).Dive <strong>and</strong> Seascape charter tripsFundación M<strong>al</strong>pelo <strong>and</strong> Fundación Yubarta have <strong>al</strong>so placedmarine mamm<strong>al</strong> observers on 39 chartered trips to theoffshore isl<strong>and</strong>s of M<strong>al</strong>pelo <strong>and</strong> Gorgona b<strong>et</strong>ween 2004 <strong>and</strong>2008. Twenty-four of these were dive trips organised by thecompany Embarcaciones Asturias <strong>and</strong> 17 were dedicatedresearch trips conducted under the auspices of ConservationInternation<strong>al</strong>’s ‘Eastern Tropic<strong>al</strong> Pacific Seascape Program.’One addition<strong>al</strong> dive charter trip in 2008 organised byFundación Cabo Mar covered the coast<strong>al</strong> segment from CaboMarzo-Buenaventura. All trips used M/V Maria Patricia,which has a cruising speed of 8 knots (14.8km/h).Observations took place during transit b<strong>et</strong>ween theoriginating port (Buenaventura) <strong>and</strong> the isl<strong>and</strong> destinationsas well as during transit b<strong>et</strong>ween destinations. Searching wasconducted by one to three observers from the vessel’s topdeck at a height of 4m above the waterline under acceptableviewing conditions (no fog or rain, <strong>and</strong> in Beaufort sea statesof 3 or less). The vessel was diverted to approach sightingswhen conditions <strong>al</strong>lowed during the Seascape trips but notduring the dive trips. Sightings collected at the dive sites (i.e.at anchor or while circumnavigating the isl<strong>and</strong>s) wereremoved from the data s<strong>et</strong> to avoid introducing bias by isl<strong>and</strong>associatedcommunities at these biologic<strong>al</strong>ly rich loc<strong>al</strong>ities.Sports-fishing charter tripsC<strong>et</strong>acean observations were collected on coast<strong>al</strong> sportsfishingtrips organised by Fundación Cabo Mar b<strong>et</strong>ween2000–2001 <strong>and</strong> 2004–2008. During these periods, 20 dailytrips were conducted <strong>al</strong>ong one of three coast<strong>al</strong> routes:Buenaventura-Bahía Solano, Bahía Solano-Cupica <strong>and</strong>Cupica-Cabo Marzo. An addition<strong>al</strong> route b<strong>et</strong>ween theloc<strong>al</strong>ity of El V<strong>al</strong>le <strong>and</strong> offshore waters was covered on oneoccasion. Two fiberglass boats with outboard engines wereused: M/V La Cotizada (23ft long, two 40hp engines)b<strong>et</strong>ween 2000 <strong>and</strong> 2005; <strong>and</strong> M/V El Gran Blanco (32ft, two115hp engines) b<strong>et</strong>ween 2006 <strong>and</strong> 2008. Two observerslocated near the boat’s bow collected sighting data at a heightof 2.2m <strong>and</strong> 2.7m above the water line, respectively for eachboat. Travel speed was variable, ranging b<strong>et</strong>ween 12 <strong>and</strong>30km/h depending on navigation conditions.DATA ANALYSISSighting categoriesIn the field, sightings were classified under 38 differentidentification categories including subspecies, species <strong>and</strong>higher taxonomic levels such as genus, family, <strong>et</strong>c. Foran<strong>al</strong>ysis purposes, sever<strong>al</strong> of these categories were pooledinto more manageable or meaningful species groupings asfollows. Species having sever<strong>al</strong> recognised subspecies orsighting categories (see Dizon <strong>et</strong> <strong>al</strong>., 1994) were pooled intoa single species. Thus, a single ‘pantropic<strong>al</strong> spotted dolphin(Stenella attenuata)’ category was created from threecategories: offshore; coast<strong>al</strong> <strong>and</strong> unidentified subspecies.Similarly, a ‘spinner dolphin (Stenella longirostris)’ categorywas created by pooling four categories: eastern; whitebelly;Centr<strong>al</strong> American <strong>and</strong> unidentified subspecies. Conversely,sightings possibly belonging to sever<strong>al</strong> related species werecombined into a single category when field identification tospecies level was not possible due to inconspicuousbehaviour <strong>and</strong>/or lack of easily distinguishable features. Thiswas the case for unidentified sightings in the genusMesoplodon, for which a ‘mesoplodont wh<strong>al</strong>es (Mesoplodonspp.)’ category was created by pooling sightings ofBlainville’s beaked wh<strong>al</strong>e (M. densirostris) with sightingsidentified to the genus level only.A single-species category was created by pooling confirmedsightings of the targ<strong>et</strong> species with sightings belonging eitherto the targ<strong>et</strong> species or to a related species when the two aredifficult to separate in the field. This was done only in caseswhere biogeographic evidence indicates that the presence ofthe related species in the study area is unlikely or extremelyrare. Thus, a ‘Bryde’s wh<strong>al</strong>e (B<strong>al</strong>aenoptera edeni)’ categorywas created by pooling sightings positively identified asBryde’s wh<strong>al</strong>es (i.e., when the auxiliary ridges on the head ofthe anim<strong>al</strong> were clearly seen) with those identified as ‘eithersei (B. bore<strong>al</strong>is) or Bryde’s wh<strong>al</strong>es’ (i.e. when a very closeexamination at the anim<strong>al</strong>’s head was not obtained <strong>and</strong>therefore identification remained uncertain). Positiveidentification of the sei wh<strong>al</strong>e in the field can be very difficult,but no confirmed sightings of this species have been madeanywhere in the eastern tropic<strong>al</strong> Pacific during the longst<strong>and</strong>ingsurveys by the SWFSC. In a similar manner, a ‘dwarfsperm wh<strong>al</strong>e (Kogia sima)’ category was created by poolingsightings positively identified as dwarf sperm wh<strong>al</strong>es withthose identified as Kogia sp. In this case, it is possible thatsome of the Kogia sp. sightings belonged to the pygmy spermwh<strong>al</strong>e (K. breviceps), <strong>al</strong>though only one confirmed sightingof this species has been reported south of 24°N by theextensive SWFSC surveys.Sightings classified under nine ‘unidentified’ categories:unidentified beaked wh<strong>al</strong>e; unidentified rorqu<strong>al</strong>(B<strong>al</strong>aenoptera sp.); unidentified dolphin; unidentified sm<strong>al</strong>lwh<strong>al</strong>e; unidentified large wh<strong>al</strong>e; unidentified c<strong>et</strong>acean;unidentified wh<strong>al</strong>e; unidentified sm<strong>al</strong>l delphinid <strong>and</strong>unidentified medium delphinid, were not used in this study.In this manner, 20 sighting categories are reported here: 19individu<strong>al</strong> species <strong>and</strong> the genus Mesoplodon.Encounter ratesSpecies encounter rates were computed for each data sourceseparately (except for the Siben <strong>and</strong> Odyssey expeditions,which lacked effort data), based on the sightings recordedwhile search effort was being conducted. These are reportedas group sightings per unit search effort in Appendices 1–5using the origin<strong>al</strong> measurement unit recorded (i.e. kilom<strong>et</strong>ersor hours). Since the m<strong>et</strong>hodology for group size estimationwas variable among the different sources (see section on‘Biases <strong>and</strong> caveats’), average group size was not used in thec<strong>al</strong>culation of <strong>relative</strong> abundance to avoid introducing furtherbias. For ease in presentation <strong>and</strong> discussion, the estimatedencounter rates for <strong>al</strong>l sources are summarised in Table 3 in
J. CETACEAN RES. MANAGE. 12(1): 45–60, 2012 49the same units (groups per km sc<strong>al</strong>ed by 1,000). This wasaccomplished by multiplying the effort hours collected bythe dive/Seascape <strong>and</strong> the sports-fishing trips by the vesselspeed (14.8km/h <strong>and</strong> an average 21km/h, respectively).Due to m<strong>et</strong>hodologic<strong>al</strong> differences, direct comparison ofthe estimated encounter rates b<strong>et</strong>ween sources would beproblematic (see ‘Biases <strong>and</strong> caveats’ in the next section).Nevertheless, we attempt to provide interpr<strong>et</strong>ation byaccording each species a qu<strong>al</strong>itative rank based on theaverage encounter rate from <strong>al</strong>l sources, where ‘low’corresponds to species with encounter rates of less than 1group per 1,000km, ‘intermediate’ to species with encounterrates b<strong>et</strong>ween 1 <strong>and</strong> 3 groups per 1,000km <strong>and</strong> ‘high’ tospecies with encounter rates greater than 3 groups per1,000km (Table 3).Sighting frequency <strong>and</strong> group size statisticsAll identified on-effort sightings were pooled into a singledata s<strong>et</strong> containing a tot<strong>al</strong> of 488 records. Sighting frequencyis reported as the number of sightings for each species in thisdata s<strong>et</strong>. Group size statistics (range, average, median <strong>and</strong>st<strong>and</strong>ard deviation) for each species were computed from thisdata s<strong>et</strong>.DistributionIdentified sightings from <strong>al</strong>l sources, including thosecollected during non-effort periods or from sources with nosearch effort data <strong>and</strong> in <strong>al</strong>l Beaufort sea state conditions,were combined into a single data s<strong>et</strong> containing a tot<strong>al</strong> of 603records belonging to the 20 sighting categories. Species<strong>distribution</strong> maps were created based on these data.RESULTS AND DISCUSSIONEffort <strong>and</strong> associated sightingsSWFSC (1986–2006)A tot<strong>al</strong> of 7,784km of visu<strong>al</strong> effort were traversed by NOAAvessels during the SWFSC line-transect surveys inColombian waters (Fig. 2a). A tot<strong>al</strong> of 238 identifiedsightings were made while on-effort belonging to 16 species<strong>and</strong> the genus Mesoplodon (see Appendix 1).Siben <strong>and</strong> Odyssey expeditions (1988, 1993, 1994)The Siben Expedition in Colombian waters consisted of threelegs during which 11 sightings of six species were collected,while the Odyssey Expedition consisted of four legs duringwhich eight sightings of four species were collected (seeAppendix 2). The routes followed by both expeditions areshown in Fig. 2b.DIMAR (2004–2008)A tot<strong>al</strong> of 8,587km of effort <strong>and</strong> 178 sightings belonging to14 species <strong>and</strong> the genus Mesoplodon were recorded aboardDIMAR vessels during on-effort periods (see Appendix 3).A map of the cruise tracks while on effort is shown inFig. 2c.Dive <strong>and</strong> Seascape trips (2004–2008)A tot<strong>al</strong> of 264hr (3,907km) of effort <strong>and</strong> 46 sightingsbelonging to 13 species were recorded during the transitsb<strong>et</strong>ween Buenaventura <strong>and</strong> the diving destinations (seeAppendix 4). A map of the effort segments for these trips isshown in Fig. 2d.Sports-fishing trips (2000–2001 <strong>and</strong> 2004–2008)A tot<strong>al</strong> of 108hr (2,268km) of observation were conductedduring which 26 c<strong>et</strong>acean sightings belonging to four specieswere recorded (see Appendix 5). A schematic map of thedaily routes is presented in Fig. 3.Patterns of c<strong>et</strong>acean occurrenceThe compiled sightings data s<strong>et</strong> contained records for 19c<strong>et</strong>acean species <strong>and</strong> one genus within Colombia’s PacificEEZ. Distribution maps for these taxa are presented in Figs4–6. Of the 23 species previously reported in these waters(Table 1) only three were absent from our data s<strong>et</strong>: Fraser’sdolphin (Lagenodelphis hosei); sei wh<strong>al</strong>e <strong>and</strong> blue wh<strong>al</strong>eTable 3Estimated encounter rates (in groups per 1,000km) by source for 19 c<strong>et</strong>acean species <strong>and</strong> one genus, based on the on-effort sightings. The ranked encounterrate (low < 1, 1 ≤ intermediate < 3, <strong>and</strong> high ≥ 3 groups per 1,000km) is based on the average from <strong>al</strong>l sources (in parenthesis) <strong>and</strong> is arbitrary.Common name Species name SWFSC DIMAR Dive/seascape Sports-fishing Ranked encounter ratePantropic<strong>al</strong> spotted dolphin* Stenella attenuata 1.93 1.86 1.28 4.08 Intermediate (2.29)Spinner dolphin* Stenella longirostris 0.39 0.26 Low (0.32)Striped dolphin Stenella coeruleo<strong>al</strong>ba 8.99 2.21 1.54 High (4.25)Rough-toothed dolphin Steno bredanensis 1.54 0.47 0.26 Low (0.76)Common dolphin Delphinus delphis 1.67 0.70 2.82 Intermediate (1.73)Common bottlenose dolphin Tursiops truncatus 3.21 2.45 2.82 5.44 High (3.48)Risso’s dolphin Grampus griseus 3.21 0.35 0.26 Intermediate (1.27)Melon-headed wh<strong>al</strong>e Peponoceph<strong>al</strong>a electra 0.64 0.26 Low (0.45)Pygmy killer wh<strong>al</strong>e Feresa attenuata 0.26 Low (0.26)F<strong>al</strong>se killer wh<strong>al</strong>e Pseudorca crassidens 0.23 0.77 0.45 Low (0.48)Short-finned pilot wh<strong>al</strong>e Globiceph<strong>al</strong>a macrorhynchus 0.77 0.70 0.51 Low (0.66)Killer wh<strong>al</strong>e Orcinus orca 0.26 0.12 0.51 Low (0.30)Sperm wh<strong>al</strong>e Phys<strong>et</strong>er macroceph<strong>al</strong>us 3.47 0.23 Intermediate (1.85)Dwarf sperm wh<strong>al</strong>e* Kogia sima 0.51 Low (0.51)Mesoplodont wh<strong>al</strong>es* Mesoplodon spp. 1.41 0.12 Low (0.77)Cuvier’s beaked wh<strong>al</strong>e Ziphius cavirostris 0.51 0.23 0.26 Low (0.33)Minke wh<strong>al</strong>e B<strong>al</strong>aenoptera acutorostrata 0.12 Low (0.12)Bryde’s wh<strong>al</strong>e* B<strong>al</strong>aenoptera edeni 0.51 Low (0.51)Fin wh<strong>al</strong>e B<strong>al</strong>aenoptera phys<strong>al</strong>us 0.12 Low (0.12)Humpback wh<strong>al</strong>e Megaptera novaeangliae 1.28 10.83 0.26 1.81 High (3.55)*Pooling of related sighting categories was done for these species as described in the text.


