Stata Tutorial - Data and Statistical Services - Princeton University
Stata Tutorial - Data and Statistical Services - Princeton University
Stata Tutorial - Data and Statistical Services - Princeton University
- No tags were found...
Create successful ePaper yourself
Turn your PDF publications into a flip-book with our unique Google optimized e-Paper software.
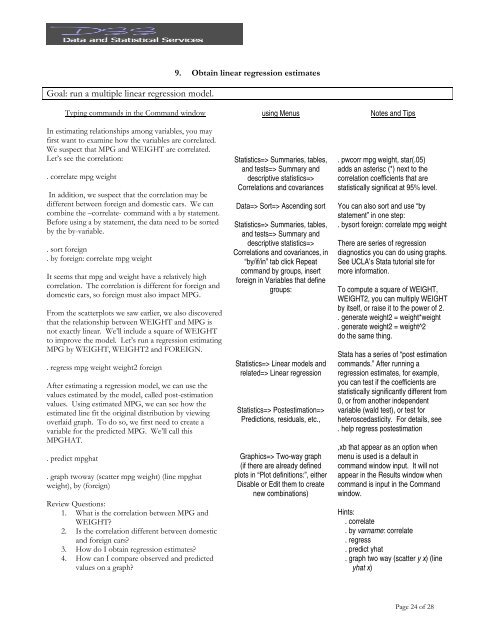
Goal: run a multiple linear regression model.9. Obtain linear regression estimatesTyping comm<strong>and</strong>s in the Comm<strong>and</strong> windowIn estimating relationships among variables, you mayfirst want to examine how the variables are correlated.We suspect that MPG <strong>and</strong> WEIGHT are correlated.Let’s see the correlation:. correlate mpg weightIn addition, we suspect that the correlation may bedifferent between foreign <strong>and</strong> domestic cars. We cancombine the –correlate- comm<strong>and</strong> with a by statement.Before using a by statement, the data need to be sortedby the by-variable.. sort foreign. by foreign: correlate mpg weightIt seems that mpg <strong>and</strong> weight have a relatively highcorrelation. The correlation is different for foreign <strong>and</strong>domestic cars, so foreign must also impact MPG.From the scatterplots we saw earlier, we also discoveredthat the relationship between WEIGHT <strong>and</strong> MPG isnot exactly linear. We’ll include a square of WEIGHTto improve the model. Let’s run a regression estimatingMPG by WEIGHT, WEIGHT2 <strong>and</strong> FOREIGN.. regress mpg weight weight2 foreignAfter estimating a regression model, we can use thevalues estimated by the model, called post-estimationvalues. Using estimated MPG, we can see how theestimated line fit the original distribution by viewingoverlaid graph. To do so, we first need to create avariable for the predicted MPG. We’ll call thisMPGHAT.. predict mpghat. graph twoway (scatter mpg weight) (line mpghatweight), by (foreign)Review Questions:1. What is the correlation between MPG <strong>and</strong>WEIGHT?2. Is the correlation different between domestic<strong>and</strong> foreign cars?3. How do I obtain regression estimates?4. How can I compare observed <strong>and</strong> predictedvalues on a graph?using MenusStatistics=> Summaries, tables,<strong>and</strong> tests=> Summary <strong>and</strong>descriptive statistics=>Correlations <strong>and</strong> covariances<strong>Data</strong>=> Sort=> Ascending sortStatistics=> Summaries, tables,<strong>and</strong> tests=> Summary <strong>and</strong>descriptive statistics=>Correlations <strong>and</strong> covariances, in“by/if/in” tab click Repeatcomm<strong>and</strong> by groups, insertforeign in Variables that definegroups:Statistics=> Linear models <strong>and</strong>related=> Linear regressionStatistics=> Postestimation=>Predictions, residuals, etc.,Graphics=> Two-way graph(if there are already definedplots in “Plot definitions:”, eitherDisable or Edit them to createnew combinations)Notes <strong>and</strong> Tips. pwcorr mpg weight, star(.05)adds an asterisc (*) next to thecorrelation coefficients that arestatistically significat at 95% level.You can also sort <strong>and</strong> use “bystatement” in one step:. bysort foreign: correlate mpg weightThere are series of regressiondiagnostics you can do using graphs.See UCLA’s <strong>Stata</strong> tutorial site formore information.To compute a square of WEIGHT,WEIGHT2, you can multiply WEIGHTby itself, or raise it to the power of 2.. generate weight2 = weight*weight. generate weight2 = weight^2do the same thing.<strong>Stata</strong> has a series of “post estimationcomm<strong>and</strong>s.” After running aregression estimates, for example,you can test if the coefficients arestatistically significantly different from0, or from another independentvariable (wald test), or test forheteroscedasticity. For details, see. help regress postestimation,xb that appear as an option whenmenu is used is a default incomm<strong>and</strong> window input. It will notappear in the Results window whencomm<strong>and</strong> is input in the Comm<strong>and</strong>window.Hints:. correlate. by varname: correlate. regress. predict yhat. graph two way (scatter y x) (lineyhat x)Page 24 of 28


